


Abstract
Routine quantification of myocardial blood flow (MBF) requires robust and reproducible processing of dynamic image series. The goal of this study was to evaluate the reproducibility of 3 highly automated software programs commonly used for absolute MBF and flow reserve (stress/rest MBF) assessment with 82Rb PET imaging. Methods: Dynamic rest and stress 82Rb PET scans were selected in 30 sequential patient studies performed at 3 separate institutions using 3 different 3-dimensional PET/CT scanners. All 90 scans were processed with 3 different MBF quantification programs, using the same 1-tissue-compartment model. Global (left ventricle) and regional (left anterior descending, left circumflex, and right coronary arteries) MBF and flow reserve were compared among programs using correlation and Bland–Altman analyses. Results: All scans were processed successfully by the 3 programs, with minimal operator interactions. Global and regional correlations of MBF and flow reserve all had an R2 of at least 0.92. There was no significant difference in flow values at rest (P = 0.68), stress (P = 0.14), or reserve (P = 0.35) among the 3 programs. Bland–Altman coefficients of reproducibility (1.96 × SD) averaged 0.26 for MBF and 0.29 for flow reserve differences among programs. Average pairwise differences were all less than 10%, indicating good reproducibility for MBF quantification. Global and regional SD from the line of perfect agreement averaged 0.15 and 0.17 mL/min/g, respectively, for MBF, compared with 0.22 and 0.26, respectively, for flow reserve. Conclusion: The 1-tissue-compartment model of 82Rb tracer kinetics is a reproducible method for quantification of MBF and flow reserve with 3-dimensional PET/CT imaging.
- myocardial blood flow quantification
- myocardial perfusion imaging
- rubidium positron emission tomography
- coronary flow reserve
- myocardial perfusion reserve
Absolute quantification of myocardial blood flow (MBF) at stress and rest with dynamic PET imaging is an important tool for clinicians and provides information complementary to relative myocardial perfusion imaging (1–3). With standard list-mode acquisition and fast image reconstruction, dynamic, gated, and standard static perfusion images can be obtained with a single injection of the radiopharmaceutical and without additional imaging time. Automated image analysis tools are required for reliable and robust clinical use of dynamic data for MBF quantification (4). The performance of several such software programs for MBF quantification has been reported recently (5–9), each of which uses different tracers and methods of segmenting and sampling the left ventricular myocardium and blood-pool activity to obtain input curves. Although each of these tools greatly simplifies MBF quantification, uses the same tracer kinetic model for 82Rb-rubidium (10), and has been validated individually, the effect of different model implementations has not been characterized. Previous studies have compared different tracer kinetic models and implementations for 13N-ammonia (11,12) but not for 82Rb-rubidium and in particular not for 3-dimensional (3D)–mode PET, which is the current standard technology. We aimed to compare 3 software packages that have been implemented clinically for the quantitative analysis of MBF and myocardial flow reserve (MFR) with rubidium PET. These methods include QPET (Cedars-Sinai) (5), syngoMBF (Siemens Healthcare) (6), and FlowQuant (University of Ottawa Heart Institute) (7). These 3 software programs perform MBF quantification using different implementations of the same 1-tissue-compartment model and different methods of segmenting the left ventricle and sampling tracer activity in the myocardium and blood pool.
MATERIALS AND METHODS
Study Design
Ninety patients were included in the study. All were referred clinically for the evaluation of known or suspected ischemic heart disease using rest–stress myocardial perfusion imaging with 82Rb PET (n = 30 sequential studies per site: June 2009 at Ottawa Heart, December 2009 to March 2010 at Cedars-Sinai, May to October 2010 at Central Manchester). After the initial quality assurance review, 1 scan from Central Manchester with an extreme motion artifact was replaced with a patient from the same period to maintain a balanced design. The population sample is representative of patients commonly referred for diagnosis of coronary artery disease and evaluation of myocardial ischemia, including patients with a previous history of myocardial infarction or revascularization. All images (90 rest and 90 stress) were processed using all 3 software packages at the respective development sites, to obtain MBF and MFR for the entire myocardial region (global) and regionally in the 3 main coronary artery territories according to the guidelines of the American Heart Association on polar map segmentation (13). The global and regional MBF and MFR were then exchanged among centers for analysis. The study protocols were approved by each of the institutional human research ethics boards. All patients gave signed informed consent.
Image Acquisition
The 82Rb PET studies were performed at 3 sites, with 3 types of scanners from 2 different vendors, using slightly different imaging and reconstruction protocols and 2 types of 82Rb generators, according to the routine clinical practice at each center as described below.
Ottawa Heart Institute
Scans were acquired on a Discovery RX PET-VCT 64-slice scanner (GE Healthcare) using a 3D list-mode acquisition after a 30-s square-wave intravenous infusion (14) of 82Rb (10 MBq/kg; Jubilant DraxImage). Patients were studied after an overnight fast and were instructed to refrain from caffeine- or theophylline-containing products or medications for 12 h before the study. After a normal end-expiration low-dose, fast (0.4 mSv, 120 kVp, 20–200 mA [automatically modulated using a 50% noise index], 1.5 s) CT acquisition for attenuation correction (AC), 82Rb was administered to the patient and a 6-min PET acquisition was started when the increase in true counts exceeded 10 kcps. Cardiac stress was induced using dipyridamole (0.142 mg/min) administered over 5 min, and a second 82Rb infusion and PET acquisition were started 3 min later. Aminophylline was injected 4 min later to reduce side effects in all patients. A second CT scan was obtained for AC of the stress PET scan. During the entire examination, the patient was instructed to breathe normally. CT AC alignment with PET was verified visually by an experienced technologist and corrected if necessary by manual 3D translation, using the vendor ACQC program. Images were reconstructed using filtered backprojection and a 12-mm Hann filter into 14 time frames (9 × 10 s, 3 × 30 s, 1 × 60 s, and 1 × 120 s; total, 6 min).
Cedars-Sinai Medical Center
Patients were scanned on a Biograph True Point PET/CT 64-slice system (Siemens Healthcare) in 3D mode. Patients were studied after an overnight fast and were instructed to refrain from caffeine- or theophylline-containing medications for 24 h before the study. Two CT-based transmission scans (0.4 mSv; 120 kVp; effective tube current, 26 mA [11-mAs quality reference]; 3.3 s) were obtained before the rest study and after the stress study for AC. Rest and stress CT transmission scans were acquired at end-expiration breath-hold. The CT attenuation map registration with the PET images was verified visually by an experienced technologist, and alignment was corrected if necessary by manual 3D translation. Regional myocardial perfusion was first assessed during rest using 925–1,850 MBq of 82Rb (Bracco Diagnostics) infused intravenously at 35–50 mL/min. A 6-min rest scan was started simultaneously with the start of the rest infusion. Immediately after completion of rest imaging, a second stress CT transmission scan was obtained. Two minutes after the start of adenosine infusion (0.14 mg/kg/min for 7 min), 925–1,850 MBq of 82Rb were administered using a separate intravenous line in the other arm to prevent interference with the adenosine infusion. Sixteen dynamic frames were reconstructed (12 × 10 s, 2 × 30 s, 1 × 60 s, and 1 × 120 s; total, 6 min) using the vendor iterative method (Fourier rebinning + 2-dimensional attenuation-weighted ordered-subsets expectation maximization) with 2 iterations, 8 subsets, and 8-mm gaussian postprocessing filter.
Central Manchester University Hospitals
Patients underwent serial rest–stress imaging on a Biograph mCT 64-slice scanner (Siemens Healthcare) using list-mode 3D acquisition after 82Rb infusion (Bracco Diagnostics). Patients were instructed to abstain from caffeine for 12 h before imaging. Low-dose CT (0.4 mSv; 120 kVp; effective tube current, 26 mA [11-mAs quality reference]; 3.3 s) was performed for AC, during normal breathing. A 1,480-MBq (40 mCi) infusion of 82Rb was administered intravenously at 50 mL/min. Acquisition started with the tracer infusion and continued for 6 min. Stress was induced with adenosine infused at 140 cg/kg/min for 4.5 min, with acquisition starting 2.5 min later. Alignment between non–attenuation-corrected PET and CT images was verified and corrected manually by an experienced technologist for any patient body motion. In cases of significant patient motion between PET and CT, an additional low-dose CT scan was acquired at the end of the study for stress AC. Both rest and stress dynamic images were reconstructed into 26 time frames (12 × 5 s, 6 × 10 s, 4 × 20 s, and 4 × 40 s; total, 6 min) using the vendor standard ordered-subsets expectation maximization 3D reconstruction (2 iterations, 24 subsets) with 6.5-mm gaussian postprocessing filter.
MBF Analysis
Global and regional MBF and MFR were obtained using 3 highly automated software programs listed in Table 1 and illustrated in Supplemental Figure 1 (supplemental materials are available online only at http://jnm.snmjournals.org). The analysis of all studies was performed independently by 3 different expert operators (1 for each software tool) who did not know the results obtained by the other methods.
MBF Quantification Software Programs
syngoMBF
For syngoMBF, each case was processed automatically with a quality control step in which the operator confirmed or modified the results of automatic reorientation (15,16) and invoked an additional option for advanced motion correction (17) if needed. The myocardium was segmented automatically and sampled into 15 rings with 36 segments. Myocardial tissue time–activity curves were obtained at each time frame as the averaged value of a region with approximately 1-cm radial thickness around the midmyocardial surface along the radial line. The arterial blood input function used for kinetic analyses was obtained from the dynamic sequence by averaging the activity in a 2-cm cylindric region of interest 1.5 cm in diameter placed automatically in the middle of the left ventricle in the basal region.
FlowQuant
For FlowQuant, a batch processing study was configured with all the image files and processed automatically without any operator interaction. FlowQuant rest–stress MBF analysis was performed as reported previously (7). Briefly, transaxial dynamic images were automatically reoriented to short-axis slices by fitting partial ellipses to the myocardium in 3 orthogonal planes. A spline model of the left ventricular (LV) myocardium was fit to the short-axis images averaged from 2 to 6 min. On the basis of the spline contours, a 0.8-cm by approximately 4-cm cylindric blood region of interest was positioned automatically in the LV and left atrium cavities, maximizing the distance from the myocardial wall and reducing myocardium-to-blood spillover contamination of the arterial input function. Sixteen rings with 36 segments were sampled with 4-mm thickness in the LV myocardium to generate a full polar map; redundancy in the apex was removed, resulting in 496 myocardial regions of interest roughly equal in area. The arterial blood and myocardium regions of interest were used to sample the full dynamic image sequence over 6 min.
QPET
For QPET, the cases were processed in batch mode. LV contours were positioned automatically with a recently described improved algorithm (18). Briefly, the LV contour was determined from the summed dynamic image data skipping the first 2 min—a method that is based on the original quantitative gated SPECT contour detection principles (19) and the improved valve-plane definition of AC-corrected high-resolution PET. The 3D cylindric region for the LV input function was automatically placed in the middle of the valve plane, with a 1- by 2-cm length oriented along the long axis of the heart. The dynamic myocardial samples were obtained from the polar map by analyzing all time frames within the fixed LV contour boundaries as reported for 13N-ammonia MBF (5).
Tracer Kinetics and Flow Reserve
A standard 1-tissue-compartment model (20) was used by all 3 programs, including regional uptake and clearance parameters (K1 [mL/min/g] and k2 [min−1]), blood-to-myocardium spillover fraction fb, and myocardial partial-volume corrections (1 – fb). A Renkin and Crone function (21,22) describing the 82Rb extraction fraction was used to estimate MBF from K1, based on the 13N-ammonia correlation reported in humans by Lortie et al. (10).
Stress and rest MBF were computed for each sample in the polar map. MFR was computed by dividing the stress polar map by the rest values at each point. MBF in each vascular territory was then obtained by averaging the polar map segments in the regions of the left anterior descending artery, left circumflex coronary artery, and right coronary artery according to the standard 17-segment American Heart Association model (13).
The following program-specific variations were noted. To reduce noise in the time–activity curves, QPET computations were performed in 70 myocardial regions with equal surface areas. These MBFs were then interpolated using a surface-area–weighted bicubic method to determine MBFs for each of the polar map samples. The global values were computed within the whole LV region bounded by the valve plane. FlowQuant computations were performed in every fourth polar map sector (124 total), and the results were interpolated back to the original polar map dimension before calculation of LV regional and global (polar map mean) MBFs. In syngoMBF, kinetic model fitting was performed on each of the 505 polar map sectors to compute regional MBFs.
Statistical Analysis
Differences in population means were evaluated using 1-way ANOVA. Agreement between pairs of MBF and MFR were visualized using Bland–Altman analysis. Ninety-five percent limits of agreement were plotted as mean ± coefficient of repeatability (RPC = 1.96 × SD), assuming a gaussian distribution. Three-dimensional scatterplots were used to evaluate the agreement among all 3 methods simultaneously, using a line of best fit (slope and intercept) and the line of identity. The SD of the residual errors (distance from line of best fit) was used to evaluate the disagreement between any method and the average value among all 3 methods. Thus, no single software tool was used as a standard to which the other 2 methods would be compared. Agreement rates were calculated among the programs for classification of scans as abnormal using a stress MBF of less than 2.0 mL/min/g and an MFR of less than 2.0 as reported previously (23). P values of less than 0.05 were considered statistically significant.
RESULTS
The patient demographics and hemodynamic data are summarized in Table 2. The proportions of male and female subjects were similar (53% and 47%); age and body mass index were typical of the patient population referred clinically for assessment of ischemia using myocardial perfusion imaging. The mild increases in heart rate and rate–pressure product from rest to stress were also typical for adenosine and dipyridamole vasodilators.
Patient Demographics and Hemodynamics
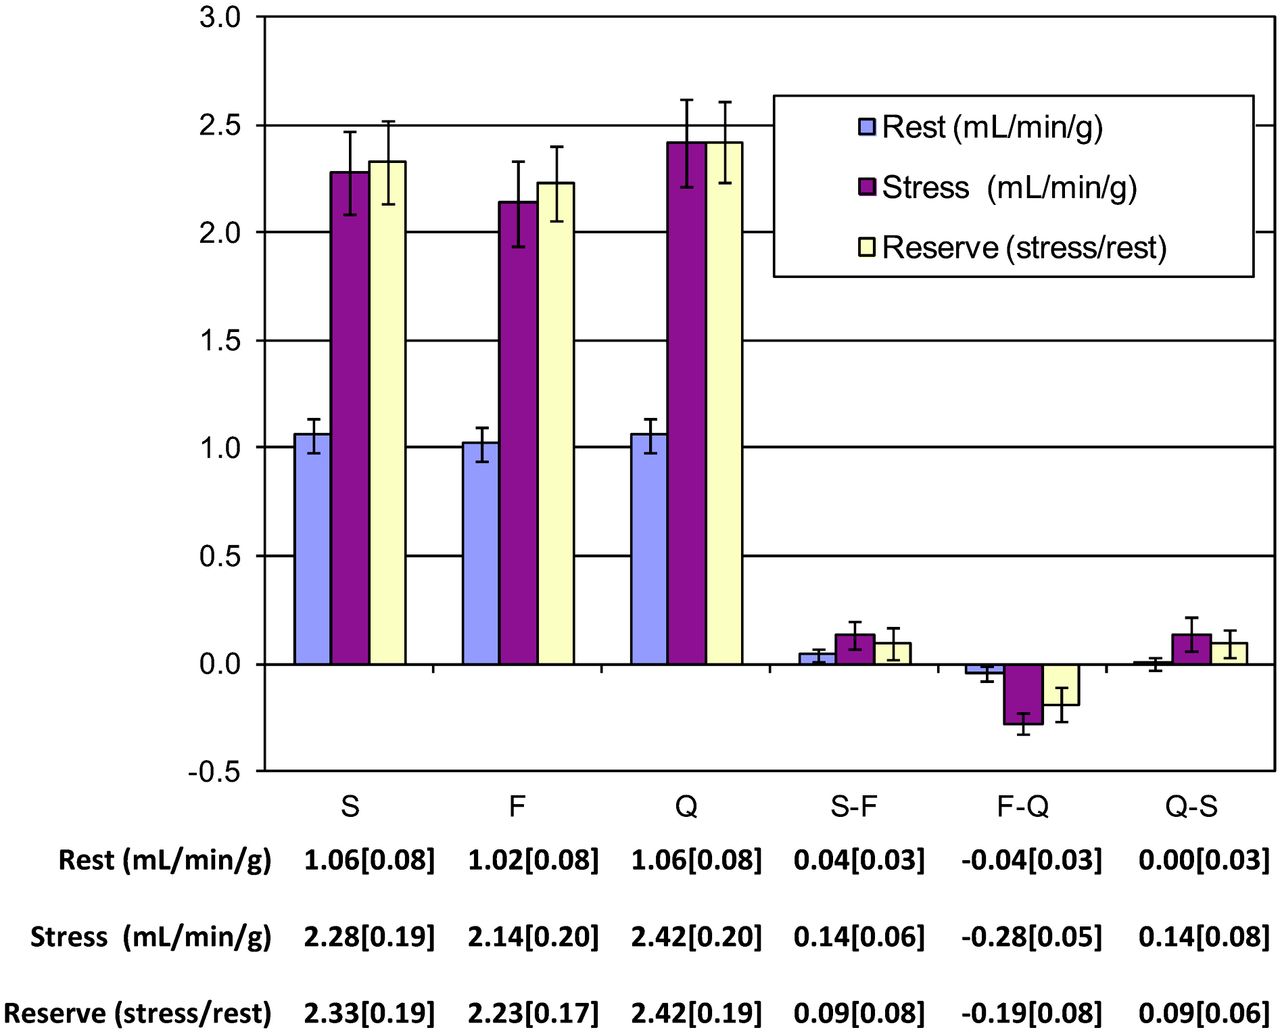
Global average rest, stress, and flow reserve values were similar using all 3 methods as indicated in Figure 1; 1-way ANOVA indicated no significant bias among methods (P = 0.68, 0.14, and 0.35, respectively). Average LV flow differences were no more than 0.04 mL/min/g at rest and no more than 0.28 mL/min/g at stress; Bland–Altman pairwise comparisons between the methods are shown in Figure 2 for MBF and MFR for comparisons between syngoMBF and FlowQuant, FlowQuant and QPET, and QPET and syngoMBF. Small pairwise differences between the methods were noted for global MBF (–9% to +6%) and MFR (–7% to +5%) (P < 0.05). The average RPC was 0.26 and 0.29 for the relative MBF and MFR differences, respectively, between programs.

Global flow values and 95% confidence interval measured with syngoMBF (S), FlowQuant (F), and QPET (Q). There were no significant differences among programs for rest (P = 0.68), stress (P = 0.14), or flow reserve (P = 0.35) values.
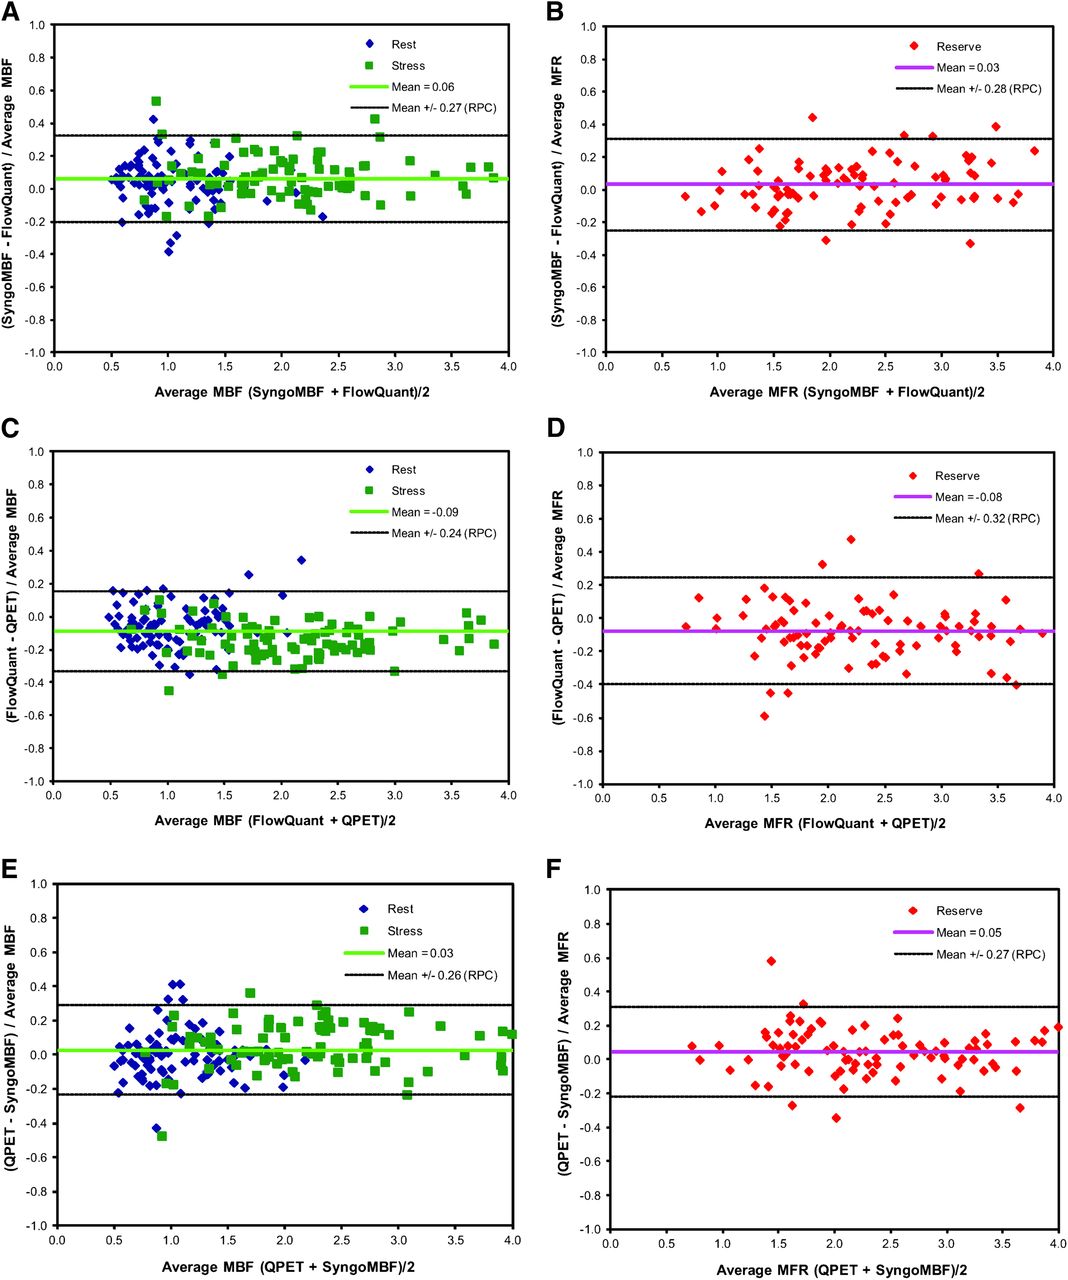
Bland–Altman plots of rest and stress MBF differences (A, C, and E) and of MFR differences (reserve; B, D, and F) between syngoMBF and FlowQuant (A and B), FlowQuant and QPET (C and D), and QPET and syngoMBF (E and F).
The 3 methods were also compared simultaneously using 3D scatterplots, as shown in Figure 3. The combined correlation was good for MBF (R2 > 0.97 for each of the 3 vascular territories, and R2 = 0.98 for global average) and MFR (R2 > 0.92 for each territory and R2 = 0.95 for global average). For global MBF, the SE of the regression (SER) was less than 0.14 mL/min/g, or 8.4% of the average MBF across all programs. Regional MBF tended to have a slightly higher SER (<0.16 mL/min/g) across all territories (P = 0.07). For global MFR, the SER was less than 0.23 (9.9% of mean) across all programs, and regional MFR had a higher SER (<0.28) across all territories (P = 0.02). Assuming no bias between any of the 3 programs (i.e., line of identity as best fit), the global average SER remained less than 0.16 mL/min/g (9.6%) for rest and stress MBF and less than 0.25 (10.7%) for MFR as shown in Supplemental Figure 2.

3D scatterplots of syngoMBF vs. FlowQuant vs. QPET values of rest and stress MBF (flow) and MFR (reserve) for global left ventricle (A and B) and regional vascular territories (C–H). R2 is total variance described by 3D unit basis vector (V) line of best fit. SEE is SD of residual errors from regression line of best fit for each of the 3 programs.
The pairwise agreement between programs ranged from 86% to 90% for detection of impaired stress MBF and from 88% to 91% for impaired flow reserve as shown in Table 3. All 3 programs identified the same patients with impaired stress MBF of less than 2.0 mL/min/g (or flow reserve < 2.0) in 82% (or 84%) of cases.
Agreement of Global LV Stress MBF and Flow Reserve Interpretation
DISCUSSION
To our knowledge, this is the first report comparing different software programs for the routine quantification of MBF and flow reserve using 82Rb PET imaging. Differences in mean MBF and flow reserve were less than 10% in general, indicating good agreement among the 3 program implementations of the same tracer kinetic model, using slightly different blood and myocardial sampling methods. These results suggest that the 3 software tools are relatively equivalent for estimation of MBF with 82Rb PET. Good reproducibility of MBF measurements obtained with the 1-tissue-compartment model of 82Rb kinetics also enabled consistent classification (∼80%–90%) of normal versus abnormal stress MBF and flow reserve. In 10% and 12% of patients with pairwise discordance in classification of abnormal flow reserve or stress flow of less than 2.0 (Table 2), the mean differences were small (0.02 ± 0.47 and 0.06 ± 0.21, respectively), but variance was significantly higher in flow reserve versus stress flow differences among programs (P < 0.001). A small number of outliers were evident in the Bland–Altman plots (Fig. 2); only 3 of 540 differences in flow reserve or stress flow (∼0.5%) were greater than 50% of the mean value. If a graded classification is used in which normal is ≥3.0, probably normal is ≥2.5, equivocal is ≥2.0, probably abnormal is <2.0, and abnormal is <1.5, then 98% of patients fall into the same or an adjacent class. Despite this variability in individual-patient classification, our results suggest that these 3 programs may be used interchangeably in multicenter trials evaluating population outcomes with clinical management directed by absolute blood flow imaging with 82Rb PET.
The present study results are similar to those reported recently by Slomka et al. (5) for 13N-ammonia PET using 1- or 2-tissue-compartment models, demonstrating a small average bias of –5% to +7% between MBF measurements and –7% to +8% for MFR. However, the range of differences among programs appears to be smaller for both MBF and MFR in the present study (SER < 0.14 and 0.23) than in the previous study with 13N-ammonia PET (SER < 0.31 and 0.74). These findings suggest that improved reproducibility in the present study may result from the use of the same 1-tissue-compartment model, as opposed to the previous study, in which different tracer kinetic models and software programs were compared. This finding is also reinforced in the study by Khorsand et al. (11), who concluded that program-specific reference databases were required because of significant bias between MBFs obtained with different compartment models used for tracer kinetic analysis of 13N-ammonia PET studies (12).
All 3 software packages provide highly automatic processing with quality control, further promoting common standards for clinical interpretation and research (5–7). However, some small differences between the flow results from the 3 packages remain. The Bland–Altman RPC and SER provide good estimates of the precision of the computed values, allowing a threshold of normal flow to be defined, with some margin of uncertainty for equivocal cases. This may need to be investigated further with a dedicated study protocol involving the generation of reference databases to characterize any potential physiologic dependencies, as well as scanning equipment and protocol variations. For example, whereas the flow reserve values were not significantly different among centers (P = 0.13), there were differences in the rest and stress MBFs (2-way ANOVA, P < 0.001), indicating that scanner- or protocol-specific normal cutoff values may be required.
In the present study, the 3 different MBF programs were run by 3 different operators; therefore, part of the observed variability in the results can be attributed to the known effects of intra- and interoperator variability. Using a single program implementation of the 1-tissue-compartment model (FlowQuant), the intra- and interoperator RPC values were reportedly 2%–8% for MBF and 8%–17% for MFR (7). Similar values of approximately 8%–16% and 16%–18% were reported for MBF and flow reserve, respectively, using syngoMBF (15). Interobserver RPC using QPET was approximately 14% for MBF and 12% for flow reserve (5).
This study had several potential limitations. It was limited to only 3D PET/CT scanners; however, this is currently the most prevalent type of PET scanner available commercially. The same patients were not scanned repeatedly on the different 3D PET/CT systems; therefore, differences in MBFs among scanners were not compared. However, the accuracy of flow values should be confirmed for any particular PET system used in clinical practice (24). Because scan repeatability was not assessed, potential issues with using site- or scanner-specific reference databases for scan assessment will need to be investigated further.
We did not compare the programs separately in each subpopulation from the 3 sites because of the small sample size and the potentially variable clinical referral patterns and patient demographics among sites. All 3 programs processed the data smoothly without limitation to the site of origin, number of frames, scanning duration, or specific scanner restrictions.
There are several sources of variability among the 3 tools, such as different methods of myocardial segmentation and polar map sampling, nonuniform definition of vascular territories, dynamic motion correction, LV input region, and manual interactions. These will lead to some level of variability in the measurements and statistics derived from the computed flow values. Some manual interactions were needed in a minority of cases and were performed separately by 3 different observers at 3 sites. Furthermore, syngoMBF included a motion correction step that was systematically used in this experiment. This study examined the overall variability without attributing it to these separate factors. It is possible that the variation would be smaller if the studies were processed by the same operator using all tools.
We limited the reproducibility comparison in the present study to 3 software tools using the same tracer kinetic model as implemented by each of the groups, but there are other tools available for clinical or research use and further comparisons would be of interest. We did not compare the effectiveness of each tool with respect to detection of the disease according to an external gold standard such as angiography; however, close diagnostic agreement among the tools indicates that such performance should be similar.
CONCLUSION
The comparison of the 3 software packages (syngoMBF, FlowQuant, and QPET) shows good agreement between MBF and flow reserve values, with consistent identification of abnormal stress flow and flow reserve in most patients. Differences in program implementation such as motion correction and myocardial sampling parameters, as well as operator variability, likely explain the small residual variations observed.
DISCLOSURE
The costs of publication of this article were defrayed in part by the payment of page charges. Therefore, and solely to indicate this fact, this article is hereby marked “advertisement” in accordance with 18 USC section 1734. This work was supported by an Imaging in Cardiovascular Therapeutics grant from the Ontario Research Fund (RE02038) and a Molecular Function and Imaging Program grant from the Ontario Heart and Stroke Foundation (PRG6242). Robert deKemp, Ran Klein, and Rob Beanlands are consultants for Jubilant DraxImage. Robert deKemp and Ran Klein receive revenues from the sale of FlowQuant. Piotr Slomka and Guido Germano receive revenues from the sale of QPET. No other potential conflict of interest relevant to this article was reported.
Footnotes
Published online Feb. 27, 2013.
- © 2013 by the Society of Nuclear Medicine and Molecular Imaging, Inc.
REFERENCES
- Received for publication August 15, 2012.
- Accepted for publication November 5, 2012.


Jump to section
Related Articles
Cited By...
- AI-enabled CT-guided end-to-end quantification of total cardiac activity in 18FDG cardiac PET/CT for detection of cardiac sarcoidosis
- Automated Motion Correction for Myocardial Blood Flow Measurements and Diagnostic Performance of 82Rb PET Myocardial Perfusion Imaging
- Reply: Clarifying the Utility of Myocardial Blood Flow and Myocardial Flow Reserve After Cardiac Transplantation
- Comparative Prognostic and Diagnostic Value of Myocardial Blood Flow and Myocardial Flow Reserve After Cardiac Transplantation
- Clinical Quantification of Myocardial Blood Flow Using PET: Joint Position Paper of the SNMMI Cardiovascular Council and the ASNC
- Effects of Hypercapnia on Myocardial Blood Flow in Healthy Human Subjects
- Randomized Trial Comparing the Effects of Ticagrelor Versus Clopidogrel on Myocardial Perfusion in Patients With Coronary Artery Disease
- Characterization of 3-Dimensional PET Systems for Accurate Quantification of Myocardial Blood Flow
- Effect of Outflow Tract Contributions to 82Rb-PET Global Myocardial Blood Flow Computations
- Integration of Quantitative Positron Emission Tomography Absolute Myocardial Blood Flow Measurements in the Clinical Management of Coronary Artery Disease
- Comparison and Prognostic Validation of Multiple Methods of Quantification of Myocardial Blood Flow with 82Rb PET
- Quantification of Myocardial Blood Flow in Absolute Terms Using 82Rb PET Imaging: The RUBY-10 Study
- The Prevalence of Microvascular Dysfunction, Its Role Among Men, and Links With Adverse Outcomes: Noninvasive Imaging Reveals the Tip of the Iceberg
- Effects of Sex on Coronary Microvascular Dysfunction and Cardiac Outcomes