


Abstract
Elevation of the end-tidal partial pressure of CO2 (PETco2) increases cerebral and myocardial blood flow (MBF), suggesting that it may be a suitable alternative to pharmacologic stress or exercise for myocardial perfusion imaging. The purpose of this study was to document the pharmacodynamics of CO2 for MBF using prospective end-tidal targeting to precisely control arterial Pco2 and PET to measure the outcome variable, MBF. Methods: Ten healthy men underwent serial 82Rb PET/CT imaging. Imaging was performed at rest and during 6-min hypercapnic plateaus (baseline; PETco2 at 50, 55, and 60 mm Hg; repeat of PETco2 at 60 mm Hg; and repeat of baseline). MBF was measured using 82Rb injected 3 min after the beginning of hypercapnia and a 1-tissue-compartment model with flow-dependent extraction correction. Results were compared with those obtained during an adenosine stress test (140 μg/kg/min). Results: Baseline PETco2 was 38.9 ± 0.8 (mean ± SD) mm Hg (range, 35–43 mm Hg). All PETco2 targets were sustained, with SDs of less than 1.5 mm Hg. Heart rate, systolic blood pressure, rate × pressure product, and respiratory frequency increased with progressive hypercapnia. MBF increased significantly at each level of hypercapnia to 1.92-fold over baseline (0.86 ± 0.24 vs. 0.45 ± 0.08 mL/min/g; P = 0.002) at a PETco2 of 60 mm Hg. MBF after the administration of adenosine was significantly greater than that with the maximal hypercapnic stimulus (2.00 vs. 0.86 mL/min/g; P < 0.0001). Conclusion: To our knowledge, this study is the first to assess the response of MBF to different levels of hypercapnia in healthy humans with PET. MBF increased with increasing levels of hypercapnia; MBF at a PETco2 of 60 mm Hg was double that at baseline.
- hypercapnia
- myocardial blood flow
- adenosine
- myocardial perfusion imaging
- rubidium
- end-tidal partial pressure of CO2
Little is known about the effects of hypercapnia (arterial Pco2 [Paco2] of >45 mm Hg) on myocardial blood flow (MBF) in humans. The effects of Paco2 on MBF were first studied more than 100 y ago in dogs, in which coronary blood flow increased with hypercapnia (1,2). The authors attributed the increased MBF to smooth muscle relaxation leading to decreased coronary resistance. These results were reproduced using different MBF measurement techniques in different animal models (3–6).
Yang et al. were the first to systematically examine the dose–response characteristics of controlled hypercapnia on absolute MBF in humans using precise CO2 targeting (7). They studied the effect of a single 10-mm Hg increase in the end-tidal partial pressure of CO2 (PETco2) on MBF in healthy humans using myocardial blood oxygen level–dependent MRI, a surrogate of MBF (7). They demonstrated that hypercapnia created a hyperemic response similar to that reported for adenosine infusion. Studies in canines demonstrated the dynamic response of MBF over a range of 30–60 mm Hg. More recently, Yang et al. showed no significant difference between the responses to hypercapnia and adenosine infusion in canines without coronary stenosis, with MBF doubling over that at baseline (8).
Other studies investigating the effects of hypercapnia on MBF in humans were performed with dissimilar protocols and produced variable results. None provided the dynamic range of response of MBF to graded PETco2. In this study, we assessed the relationship between graded levels of PETco2 and increases in MBF, as measured using PET imaging. The dose–response relationship between PETco2 and MBF is a prerequisite for using CO2 as a noninvasive stimulus in the measurement of myocardial flow reserve (MFR).
MATERIALS AND METHODS
Study Population
Eleven healthy male volunteers, screened by a clinical history and physical examination, were recruited for this study. One recruited subject did not attend on imaging day and was therefore excluded. Participants had no history of obstructive coronary artery disease (CAD) and had no symptoms of CAD or heart failure. Participants provided written informed consent, and the study was approved by the Ottawa Health Science Network Research Ethics Board. Participants were instructed to avoid caffeinated drinks for 24 h before imaging.
PET Imaging
At present, MBF may be assessed noninvasively with several methods. Transthoracic echocardiography can estimate epicardial coronary artery flow reserve, and MRI can approximate global and regional flow reserve. Nevertheless, PET imaging remains the clinical gold standard to which other noninvasive techniques are compared and validated. The accuracy and repeatability of PET have made it the method of choice for quantifying absolute MBF (9).
All participants underwent a baseline rest 82Rb PET scan to quantify MBF and low-dose CT for attenuation correction. After this baseline study, serial 82Rb PET scans using 3 levels of PETco2 (50, 55, and 60 mm Hg), a suitable surrogate of Paco2 (10), were acquired. Using sequential gas delivery, PETco2 levels were within ±1 mm Hg of their arterial equivalents (11). The 60–mm Hg level scan was repeated after a rest period of at least 10 min. A second rest 82Rb PET scan was performed after a return to normocapnia. For every level of PETco2, hypercapnia was maintained for 6 min. 82Rb infusion and PET acquisition were started 3 min after the beginning of hypercapnia. This acquisition was followed by an adenosine stress 82Rb PET scan at least 20 min later (Fig. 1). A total of 7 82Rb PET scans per participant were performed within 90 min.
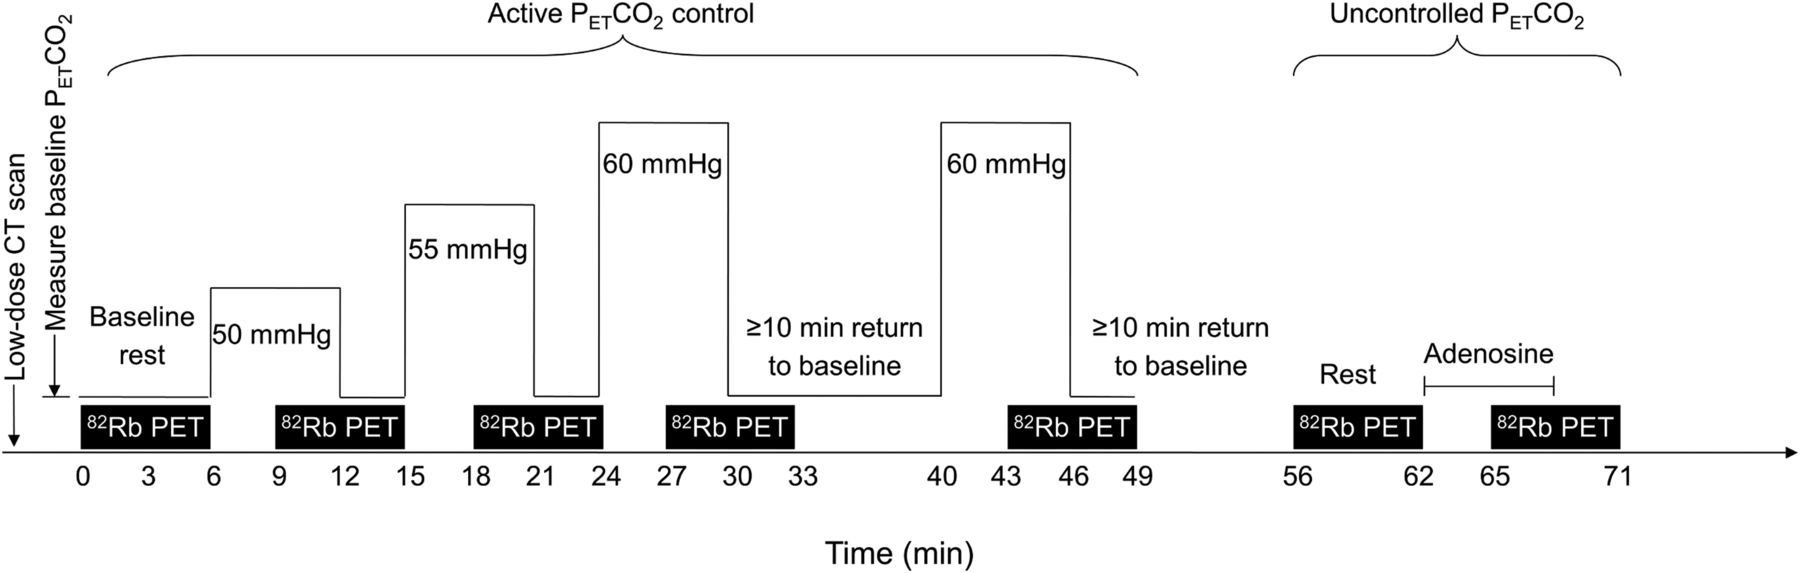
Sequence of imaging during single visit.
Heart rate (HR) and blood pressure were measured 1 to 3 min before stress, immediately before tracer injection, and 3 to 5 min after injection (Spot Vital Signs Device; Welch Allyn). Additionally, during pharmacologic and hypercapnic stresses, HR was measured every minute using 12-lead echocardiography (CardioSoft Diagnostic System; GE). The rate × pressure product (RPP) calculation was performed using the average HR and systolic blood pressure (SBP) at peak stress and after tracer infusion.
82Rb PET imaging was performed according to the University of Ottawa Heart Institute standard clinical protocol previously described (12). In brief, participants were positioned in a 3-dimensional PET system (GE Discovery 690 PET/CT). The initial rest PET scan included low-dose CT for attenuation correction (fast helical, 1.5 s, 120 kVp with axial and angular mA modulation at a noise index of 50). After 82Rb was administered at 10 MBq/kg intravenously over 30 s, PET imaging was performed over a period of 6 min. MBF was quantified using a 1-tissue-compartment model with flow-dependent extraction correction (12). Polar maps representing MBF were generated for each rest and stress state using validated software (FlowQuant; University of Ottawa Heart Institute) (13). Corrected MBF values were calculated using the population average rest RPP according to the following formula: corrected MBF = (MBF × average RPP)/subject RPP. MFR were calculated by dividing MBF values by rest-MBF. All presented MBF and MFR were unadjusted except when noted otherwise.
Hypercapnia
Until recently, precise modulation of Paco2 and arterial oxygen tension (Pao2) levels could be achieved only by changing the concentrations of inspired gases. These fixed inspired gas methods are affected by variations in breathing patterns (frequency and tidal volume), leading to variability in end-tidal gas concentrations (14). A new approach of breath-by-breath control of arterial blood gases using sequential gas delivery (10,11,15) enabled the automated prospective control of arterial blood gases (16) independently of the subject’s ventilation or pattern of breathing. Using sequential gas delivery, it is possible to maintain a euoxic–hypercapnic state at any level for several minutes with minimal discomfort for the subject (17)—conditions needed for the precise assessment of MBF using PET imaging.
PETco2 and end-tidal O2 partial pressure targets were achieved using prospective end-tidal gas targeting with previously described algorithms (11). These algorithms were applied by a computerized gas blender (RespirAct; Thornhill Research) that had Pco2 and Po2 sensors and that was connected to a sequential gas delivery breathing circuit (15). Pilot studies with the computerized gas blender showed that a Pco2 of 60 mm Hg could be tolerated consistently for several minutes. Therefore, this level was chosen as the upper Pco2 target for the study, so that a dose–response relationship could be discerned and provide an indication of whether the response of MBF to Pco2 plateaued as Pco2 approached 60 mm Hg.
For this study, 3 levels of PETco2 (50, 55, and 60 mm Hg) were targeted and maintained over 6 min while euoxia was maintained (end-tidal O2 partial pressure of 100 mm Hg). Tidal Pco2 and Po2 were monitored continuously and recorded. Before imaging, the participants’ Pco2 was increased to 60 mm Hg for 6 min to familiarize them with the sensation of hypercapnia and confirm their tolerance for the change. Baseline PETco2 levels were estimated using average PETco2 measurements after initial application of the mask and before hypercapnia. Baseline respiratory frequencies ( f ) were calculated after the participant was positioned under the camera while wearing the mask.
Study Tolerability
Subjects graded the discomfort associated with hypercapnia and adenosine on a subjective scale from 0 to 10, with 0 representing no discomfort and 10 representing intolerable discomfort.
Statistical Analysis
One-way repeated-measures ANOVAs were conducted before comparison of the different imaging states using the first baseline study and the first maximal hypercapnic stimulus (60 mm Hg). When data for a participant were missing, the entire dataset for that participant was excluded from repeated-measures ANOVAs. Post hoc analyses were conducted using paired Student t tests with Bonferroni–Holm sequential corrections for multiple comparisons with the dataset for all patients. A total of 8 comparisons were performed for the variables of interest (baseline vs. 50 mm Hg, baseline vs. 60 mm Hg, 50 mm Hg vs. 55 mm Hg, 55 mm Hg vs. 60 mm Hg, 60 mm Hg vs. repeat 60 mm Hg, 60 mm Hg vs. adenosine, baseline vs. repeat baseline, and repeat baseline vs. adenosine). Tolerability levels were compared using paired t tests. The average MFR was computed from the individual MFRs measured in each participant.
Unless otherwise specified, the results are presented as mean ± SD. P values of less than 0.05 were considered statistically significant. Statistical analysis was performed using GraphPad Prism version 6.01 for Windows (GraphPad Software) and MedCalc for Windows, version 12.2 (MedCalc Software).
RESULTS
Population
The participants’ age, weight, height, and body mass index were 30 ± 12 y, 84.8 ± 11.2 kg, 178 ± 8 cm, and 26.9 ± 4.3 kg/m2, respectively. All participants had normal 12-lead echocardiography results before entering the study. The measured baseline PETco2 was 38.9 ± 0.8 mm Hg (range, 35–43 mm Hg). For 1 participant, imaging at the 55-mm Hg level was not acquired for technical reasons; imaging at the 60-mm Hg level was not acquired for another participant because of an inability to maintain a stable PETco2. Data from these 2 participants were excluded from the repeated-measures ANOVAs. For 2 other participants, repeat 60-mm Hg acquisitions were not obtained.
Hypercapnic Stimulus
All PETco2 targets were attained, with SDs of less than 1.5 mm Hg (Table 1). A representative PETco2 tracing presented in Figure 2 shows a rapid increase in the PETco2 to the target level and then a stable PETco2 at all target levels.
Summary of Results

Representative curve of target PETco2 (red line) and measured PETco2 (black dots) in participant at different levels of hypercapnia.
Hemodynamic Parameters
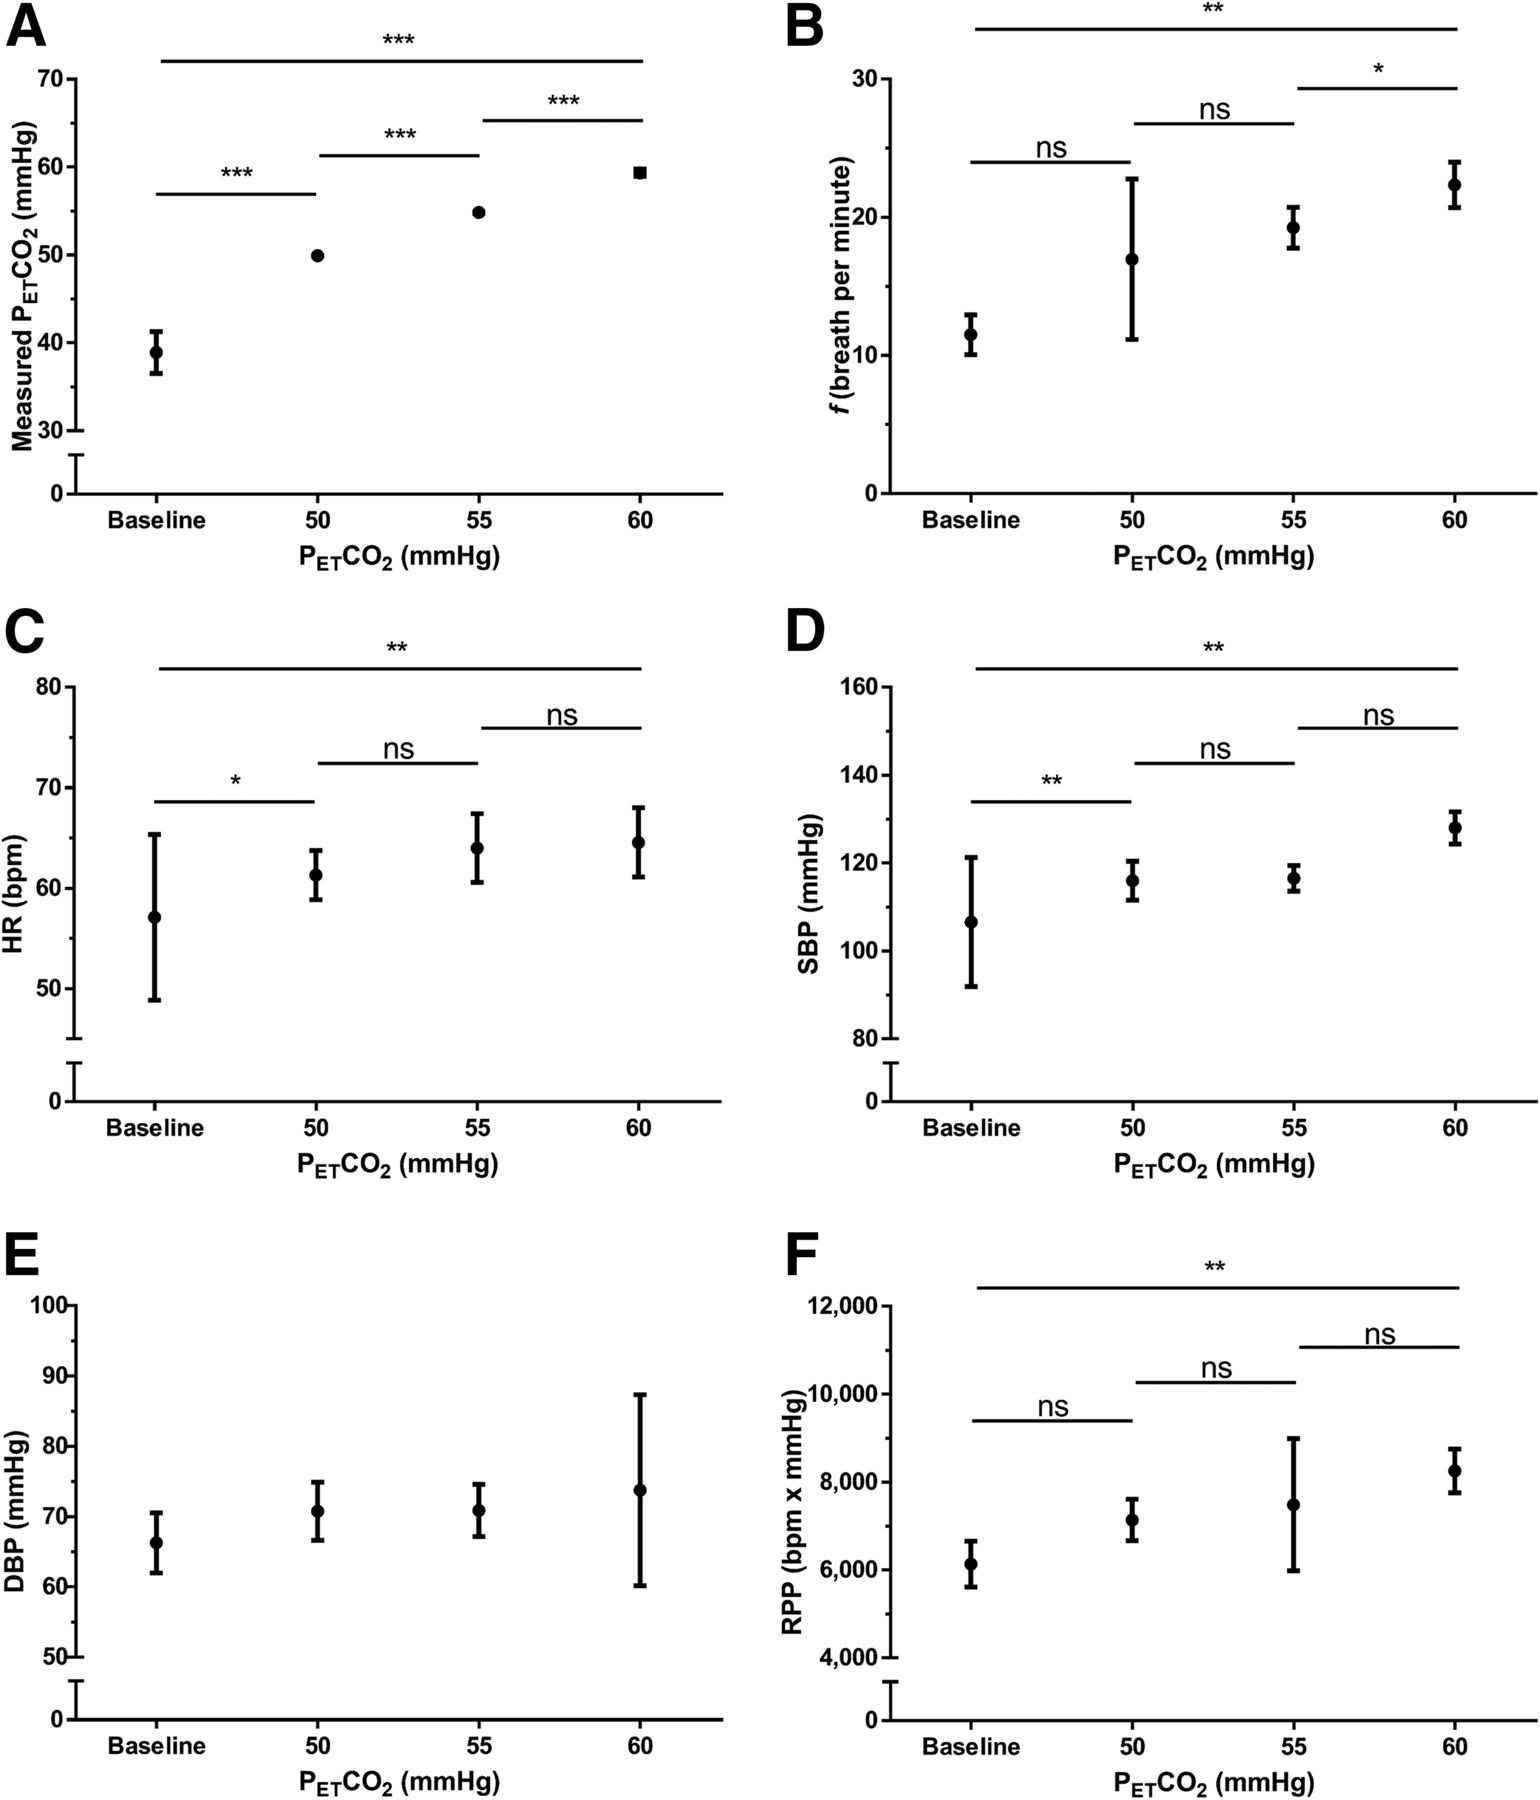
HR, SBP, f, and RPP increased with progressive levels of hypercapnia (Table 1; Fig. 3). There was a moderate correlation between RPP and MBF (R2 = 0.41; P < 0.0001) (Fig. 4A). Diastolic blood pressure (DBP) did not change (P = 0.2, as determined by ANOVA).

Measured PETco2 (A), f (B), HR (C), SBP (D), DBP (E), and RPP (F) of all participants at baseline and at different levels of hypercapnia. Results are presented as mean ± SD. P values of ≥0.05 were not significant (ns). *P < 0.05. **P < 0.01. ***P < 0.0001.
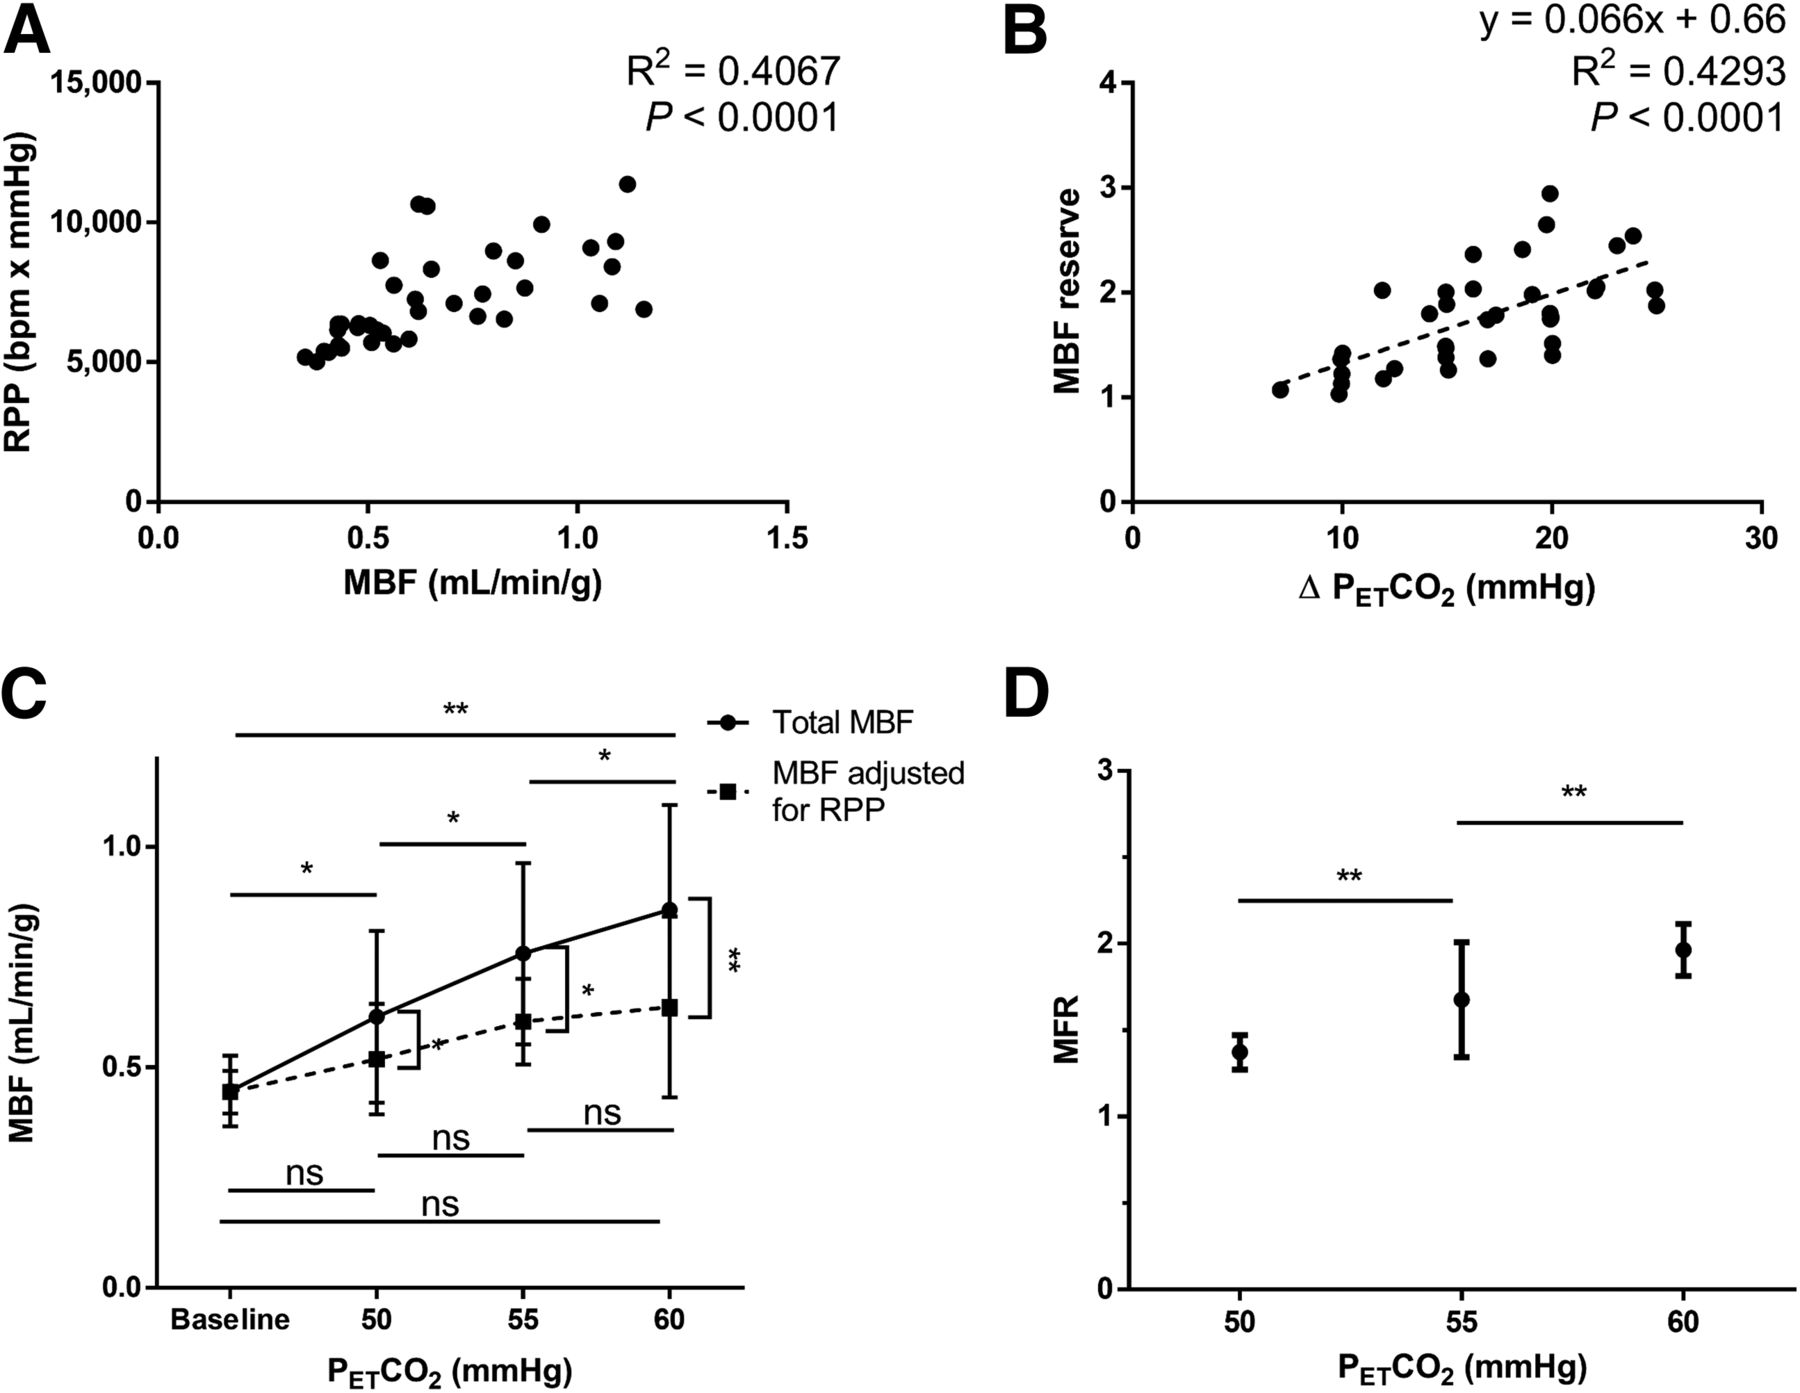
(A) MBF vs. RPP. (B) MFR vs. increase in PETco2. (C) Relationships between MBF and PETco2 and between adjusted MBF and PETco2. (D) Relationship between MFR and hypercapnia. Results are presented as mean ± SD. *P < 0.05. **P < 0.01.
MBF and MFR
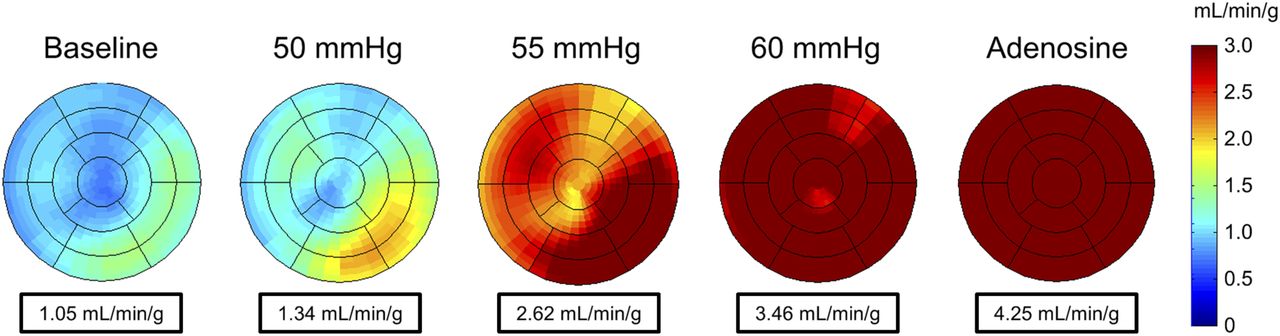
MBF increased 92% with the maximal hypercapnic stimulus (0.86 ± 0.24 vs. 0.45 ± 0.08 mL/min/g; P = 0.002) (Fig. 5). Increases in PETco2 and MFR were significantly correlated (R2 = 0.43; P < 0.0001) (Fig. 4B). The dose–response relationship between MBF and PETco2 levels is shown in Figure 4C. MBF was significantly greater at 50 mm Hg than at baseline (P = 0.030), at 55 mm Hg than at 50 mm Hg (P = 0.014), at 60 mm Hg than at 55 mm Hg (P = 0.011), and at 60 mm Hg than at baseline (P = 0.002). There was a similar dose–response relationship for corrected MBF (Fig. 4C). Corrected MBF values were significantly lower than noncorrected values at 50 mm Hg (P = 0.032), 55 mm Hg (P = 0.0174), and 60 mm Hg (P = 0.002). MFR was significantly higher at 55 mm Hg than at 50 mm Hg (1.70 vs. 1.38; P = 0.005) and significantly higher at 60 mm Hg than at 55 mm Hg (1.91 vs. 1.70; P = 0.005).

MBF polar maps of representative subject, showing global MBF at baseline, during hypercapnic stimuli, and during adenosine stress.
Multiple regression analyses were conducted to examine the relationship between MBF and 2 potential predictors, PETco2 and RPP. The multiple regression model with 2 predictor variables produced an R2 of 0.55, an F2,35 of 21.23, and a P value of less than 0.001. Both PETco2 (β = 0.01285; P = 0.0022) and RPP (β = 0.00006; P = 0.0014) had significant positive regression weights.
Adenosine
Adenosine increased MBF in all subjects, to 2.00 ± 0.34 mL/min/g, resulting in an MFR of 4.53 ± 0.70 (range, 3.56–5.73). The adenosine-induced increase in MBF was significantly greater than that elicited by the maximal hypercapnic stimulus of 60 mm Hg (2.00 vs. 0.86 mL/min/g; P < 0.0001).
Reproducibility
The interval between the first and second 60–mm Hg acquisitions averaged 24.8 ± 8.3 min (range, 12–41 min). MBF at the repeat 60–mm Hg stimulus was not significantly different from at the initial 60–mm Hg one (0.87 vs. 0.86 mL/min/g; P = 0.051) (Fig. 6A). This finding remained true when correction for RPP was used (0.64 vs. 0.59 mL/min/g; P = 0.434). Finally, MFR was, on average, marginally greater at the repeat 60–mm Hg level than at the initial 60–mm Hg stress (2.12 vs. 1.97; P = 0.019) (Fig. 6B).

Average MBF (A) and MFR (B) during initial and repeat 60-mm Hg PETco2 stress. Results are presented as mean ± SD. P values of ≥0.05 were not significant. *P < 0.05.
Study Tolerability
For 7 subjects, hypercapnia was more tolerable than adenosine, whereas for 2 subjects, adenosine was more tolerable than hypercapnia. In 1 subject, both stimuli were equally tolerable. Average tolerability scores for hypercapnic and adenosine stimuli did not significantly differ (4.5 ± 2.0 vs. 6.0 ± 2.5; P = 0.15).
DISCUSSION
To our knowledge, this study in healthy young men is the first documentation of a dose–response curve for CO2 and MBF with PET. MBF increased progressively with hypercapnia, reaching a doubling of the baseline MBF at a PETco2 of 60 mm Hg. Although some animal studies showed no change in MBF with hypercapnia (18,19), our results are consistent with those of other animal studies reporting an increase in MBF with hypercapnia (7,8,20,21). Beaudin et al. (22), using cardiac MRI, demonstrated an increase of 34% in coronary sinus flow with a Paco2 of 45 mm Hg. Tzou et al. (23) demonstrated that hypercapnia increased by approximately 40% the coronary blood flow velocity of the left anterior descending coronary artery, as measured with transthoracic Doppler echocardiography. Furthermore, this increase in blood flow velocity was greater at higher levels of inspired CO2. Similar results were obtained with invasive measurements of coronary sinus flow (24).
However, other studies with Doppler echocardiography and PET showed little or no increase in MBF with hypercapnia (25,26). In these studies, the application of fixed inspired CO2 concentrations elicited unreliable increases in Paco2 (14); indeed, when measured, Paco2 had barely changed, if at all (25). However, these studies in humans were hampered by the inability to attain and maintain the specific Pco2 levels needed to generate an MBF–Pco2 relationship or to separate the direct effects of CO2 from the secondary effects of increases in myocardial work due to hypercapnia-induced increases in HR and SBP (22,24,26). In our young subjects, these secondary effects were mild but contributed to the increase in MBF (Fig. 4).
We also found that hypercapnia elicited reproducible changes in MBF with a repeat PETco2 stimulus of 60 mm Hg. In contrast, the pharmacokinetics of intravenous agents resulted in unpredictable blood levels and time courses of the effects (see Fierstra et al. (10) for a discussion). Hypercapnia in the range of 60 mm Hg is high but not outside the range commonly encountered in adults in the community. For example, in people with obstructive sleep apnea, such levels occur as often as 5–20 times/h all night (27). Hypercapnia does not cause irreversible adverse effects, even in patients with underlying morbidities (28–30). A PETco2 of 60 mm Hg was well tolerated by all subjects in the present study. As such, hypercapnia may be considered a candidate in the search for an MBF stimulus that is noninvasive, tolerable, safe, rapidly reversible and, most importantly, reproducible—in terms of both stimulus and response.
An increase in RPP, a proxy of cardiac work, with hypercapnia is associated with increased myocardial work and oxygen consumption (31), leading to increased MBF. In the present study, hypercapnia increased both HR and SBP, consistent with previous results in humans (32,33). After correction for RPP, there was still a significant increase in MBF. This result was confirmed by multiple variable regression analyses demonstrating independent contributions of RPP and PETco2. These data suggest that the increase in MBF can be partially, but not completely, attributed to increased cardiac work. If the increase in MBF due to increased myocardial work is assumed to be proportional to the increase in RPP, then approximately half of the increase in MBF was due to increased cardiac work. The other half likely was related to the direct vasodilatation effect of hypercapnia. Indeed, prior studies demonstrated that hypercapnia dilates the coronary arteries, a phenomenon mediated by endothelium-derived nitric oxide, adrenergic stimulus, and other mechanisms yet to be determined (3,34–36). At similar PETco2 levels in healthy young subjects, Claassen et al. (37) observed a 23% increase in the mean arterial pressure with an SBP of up to 160 mm Hg, which would have increased RPP considerably more than the conditions in the present study and which would have provided greater stress. Like them, we found hypertensive responses plateauing as PETco2 approached 60 mm Hg.
In all subjects, adenosine injection increased MBF more than the maximal hypercapnic stimulus, with an average MFR of 4.53 for adenosine stress. On the one hand, this finding is consistent with previously published results reporting an MFR of 4 to 5 after adenosine stress and shows that our subjects had normal or above-normal coronary flow reserve (38). On the other hand, this result differs from the recently published observations of Yang et al. (8), who evaluated changes in MBF with hypercapnia (Paco2 increased by 25 mm Hg) and adenosine stresses in canines without coronary stenosis, with non–flow-limiting coronary stenosis, and after caffeine administration. In canines without coronary stenosis, increases in MBF did not differ in response to hypercapnia and adenosine, doubling relative to the baseline level (8). Similar results were observed using myocardial blood oxygen level–dependent MRI (7).
We observed similar MFR levels with hypercapnia, but MFR was greater with adenosine. These findings could have been related to the fact that the effects of adenosine on MBF are species-dependent and a standard dose of adenosine (140 μg/kg/min) is insufficient to produce maximal hyperemia in canines (39). Nevertheless, the increases in MBF with hypercapnia were similar in magnitude to previously reported increases during exercise stress (1.8–2.0) (38,40) and with dipyridamole (41,42). Our subject population overlaps the coronary stress test population, some of whom also are young and have normal coronary anatomy. A definitive answer as to what extent hypercapnia can substitute for exercise and dipyridamole would require head-to-head comparisons of exercise versus hypercapnia and dipyridamole versus hypercapnia in a coronary stress test population.
Finally, we showed that the effect of hypercapnia on MBF was reproducible; MBF and corrected MBF with the first and repeat 60–mm Hg stimuli did not differ. The finding that MFR was 8% greater on repeat measurements may have been due to a combination of test-retest variability and the effects of the intervening rest period of 12–41 min with free breathing of room air, whereas the initial 60–mm Hg acquisition was performed soon after the 50– and 55–mm Hg acquisitions. Indeed, this finding may have been partly attributable to the fact that the MBF response to an increase in Paco2 decreased during prolonged (>10 min) hypercapnia (3).
The main limitation of this study pertained to the population studied. Our subjects were all healthy male volunteers with low resting MBF (female subjects were not purposely excluded; all of the volunteers were male). Whether similar results would be obtained with different populations, such as patients with CAD and subjects with high resting MBF, remains to be determined.
CONCLUSION
To our knowledge, this study is the first to assess changes in MBF in response to different levels of hypercapnia in humans with PET. MBF increased at each incremental PETco2 level up to 60 mm Hg. Approximately half of this increase could be attributed to increased cardiac work, as indicated by the RPP. With the maximal hypercapnic stimulus of 60 mm Hg, MBF doubled—comparable to the increase in MBF obtained with exercise stress. Larger increases in RPP due to hypercapnia may increase MBF further.
Hypercapnia has additional characteristics to commend it for clinical investigation: it is readily available, inexpensive, and an intrinsic molecule that can be precisely, consistently, and reproducibly administered by automated delivery systems. It is well tolerated at the effective partial pressure of 60 mm Hg, and it is safe even at multiple times its effective dose, giving it a large safety margin as a drug. The rapid onset and offset of Pco2 levels and the consistency of MBF with repeated hypercapnia tests commend it for repeated tests in a single session, as is sometimes required in clinical practice. To assess the potential clinical impact of hypercapnia in the diagnosis of CAD, further investigations comparing MBF with hypercapnia versus pharmacologic stress or exercise in patients with CAD are warranted.
DISCLOSURE
No potential conflict of interest relevant to this article was reported.
Acknowledgments
We thank Farrah Ahmed, Brian Marvin, and Marlie Poirier of the University of Ottawa Heart Institute, Ottawa, Ontario, Canada, for their contribution in the collection of data. We thank Steve Iscoe for editorial comments.
Footnotes
Published online Jun. 15, 2017.
- © 2018 by the Society of Nuclear Medicine and Molecular Imaging.
REFERENCES
- Received for publication April 4, 2017.
- Accepted for publication June 8, 2017.


