


Abstract
Several models for predicting the likelihood of nonsentinel lymph node (NSLN) metastasis using histopathologic parameters in sentinel-positive breast cancer patients have been proposed. In this study, we established a new model that uses sentinel lymphoscintigraphic findings and histopathologic parameters as covariates and assessed its predictive performance. Methods: The analysis included breast cancer patients (n = 301 women) who underwent sentinel lymphoscintigraphy (SLS) using 99mTc-labeled human serum albumin, had sentinel lymph node biopsy results positive for metastasis, and subsequently underwent complete axillary lymph node dissection. First, we devised a grading system relating SLS patterns to the risk of NSLN metastasis positivity. Second, we developed a multivariate logistic regression model for the prediction of NSLN metastasis using the SLS pattern and histopathologic parameters as covariates and compared its performance with that of the extensively validated Memorial Sloan-Kettering Cancer Center model using receiver-operating-characteristic curve analysis. Results: The SLS visual grade was strongly correlated with the presence of NSLN metastases. A well-calibrated prediction model for NSLN metastasis was constructed using SLS grade and histopathologic findings. The mean area under the curve of our model was 0.812, which is significantly greater than that of the Memorial Sloan-Kettering Cancer Center model (P < 0.001). A nomogram was drawn to facilitate the application of our model. Conclusion: SLS can aid in predicting NSLN metastasis in patients with breast cancer. Our model performed better than did established prediction models.
The reduction of the extent of surgery has been a recent continuous trend in breast cancer treatment. Breast-conserving surgery and sentinel lymph node biopsy (SLNB) techniques have largely replaced modified radical mastectomy and systematic axillary dissection for early-stage breast cancer patients. SLNB facilitates the assessment of axillary lymph node (LN) status with high negative predictive value in patients with clinically node-negative early-stage breast cancer. When positive LN metastasis is detected by SLNB, the patient then undergoes complete axillary LN dissection (ALND). However, previous reports suggest that no additional LN metastasis is found on axillary dissection in approximately 50%–65% of such patients (1,2). Therefore, more than half of patients positive for sentinel lymph node (SLN) metastasis will have unnecessary ALND under the current guidelines.
Many studies concerning the predictive factors for additional LN metastasis in SLN-positive patients have been published. Several centers have developed models for predicting additional LN metastasis based on histopathologic findings (3–7), but these usually perform suboptimally. For example, the receiver-operating-characteristic (ROC) curve analysis of the Memorial Sloan-Kettering Cancer Center (MSKCC) model (3), one of the most extensively validated models, shows an area under the curve (AUC) of 0.72–0.86 (3,4,8–10).
Sentinel lymphoscintigraphy (SLS) is performed to map SLNs using radiopharmaceutical tracers. SLS is thought to be useful for evaluating the success or failure of SLN mapping and also for the rough localization of SLNs. In our hospital, 99mTc-labeled radiopharmaceuticals, such as 99mTc-antimony trisulfide colloid, 99mTc-tin colloid, and 99mTc-human serum albumin (HSA), have been used for this purpose. During routine clinical practice, we observed a possible relationship between the findings of increased retention in upstream lymphatic vessels and decreased uptake in SLNs on SLS and increased axillary tumor burden. This association was more prominent when more fluid radiopharmaceuticals such as 99mTc-HSA (the particle size of which is much smaller than that of 99mTc-antimony trisulfide colloid or 99mTc-tin colloid) were used. Therefore, we hypothesized that the sentinel lymphoscintigraphic pattern might be a useful predictor of additional LN metastasis in SLN-positive breast cancer patients.
In this study, we first demonstrated the utility of SLS findings for predicting nonsentinel LN (NSLN) metastasis in SLN-positive breast cancer patients. We then constructed a model for predicting NSLN metastasis using the SLS pattern as a covariate. Finally, we compared the performance of this model with that of the MSKCC model.
MATERIALS AND METHODS
Patient Population
From August 2005 to December 2008, 1,627 female breast cancer patients underwent surgery with SLN biopsy using 99mTc-HSA for SLN mapping. Of these 1,627 patients, 301 who met the inclusion criteria were retrospectively enrolled in the study. The inclusion criteria were positivity for SLN metastasis; no neoadjuvant chemotherapy; and complete ALND, with an adequate number (≥6) of dissected LNs. These 301 patients were used to demonstrate the utility of SLS as a predictor of NSLN metastasis and to construct and validate the prediction model (Table 1).
Patient Population
From the 1,627 patients with 99mTc-HSA SLS results, 200 who had no SLN metastasis and received no neoadjuvant chemotherapy were randomly selected and used as an auxiliary dataset for validating the utility of SLS (Table 1).
This study was performed in accordance with guidelines from our institutional review board on the review of medical records (NCCNCS-11-535).
SLS Procedure and Image Interpretation
On the day of surgery, 37 MBq of 99mTc-HSA (0.2 mL; Techne Albumin Kit [Daiichi Radioisotope Laboratory]) were injected intradermally in the periareolar area within the tumor-bearing breast quadrant. Immediately after injection, anterior planar images were acquired for 5 min using a single-head γ-camera (Argus; ADAC Laboratories) with a high-resolution parallel collimator. After the acquisition of the anterior images, lateral images were acquired for 5 min.
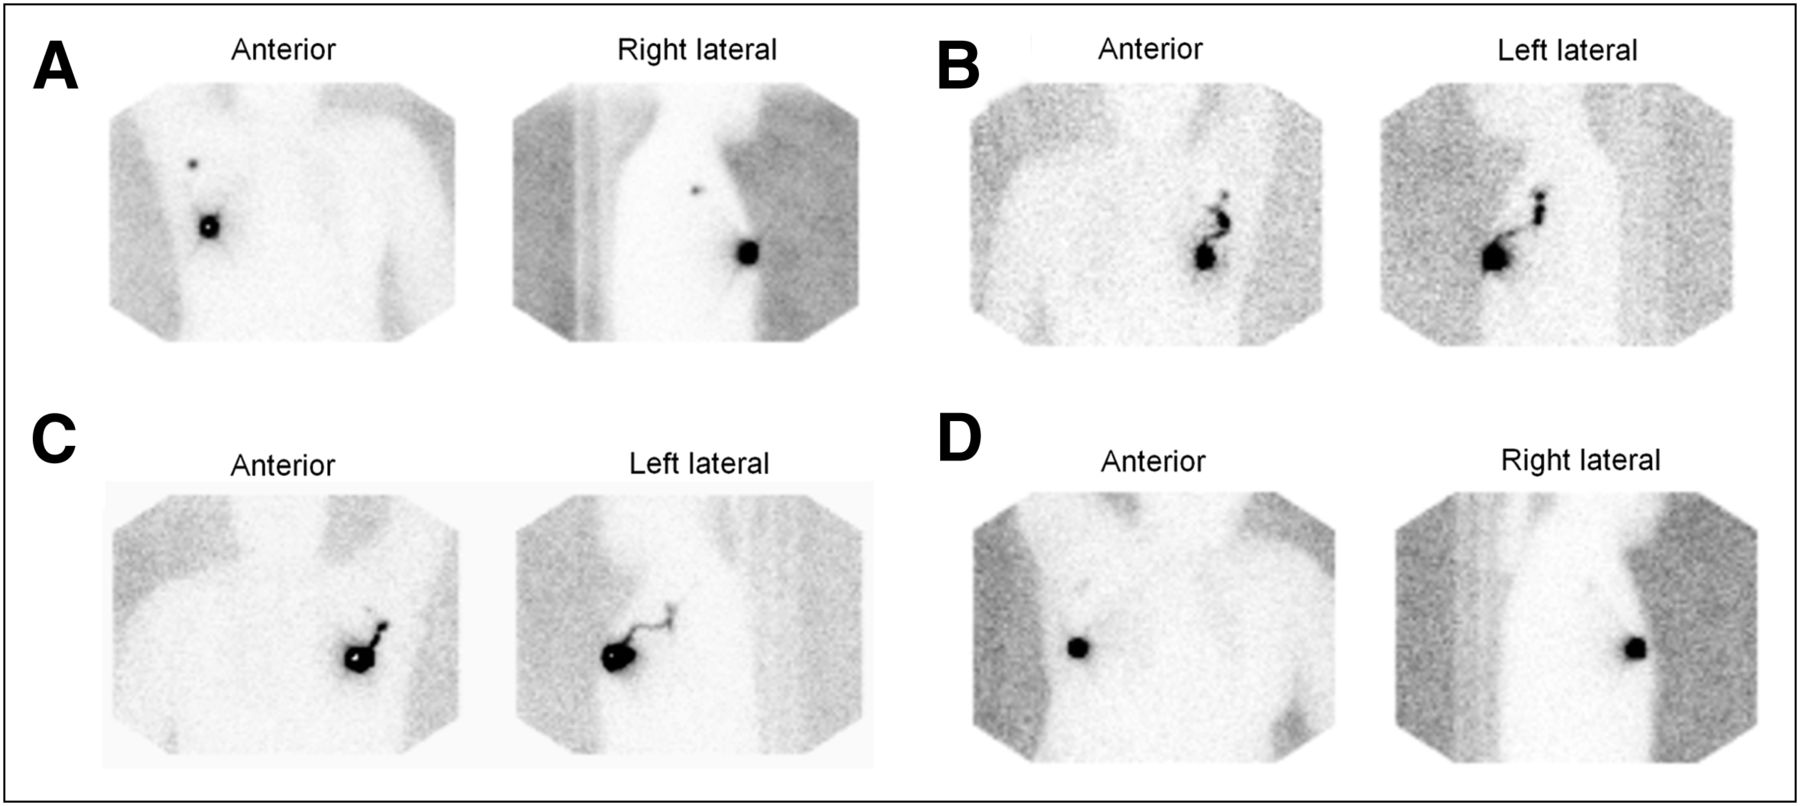
The sentinel lymphoscintigraphic images of the 301 sentinel-positive and 200 sentinel-negative patients were pooled and interpreted by 2 experienced nuclear medicine physicians masked to axillary LN status. In consideration of previous studies of the significance of SLS distribution, the SLS patterns were classified as focal, intermediate, serpentine, or no uptake on the basis of SLN visualization and lymphatic retention (Table 2; Fig. 1). Classifications that were discordant between the 2 nuclear medicine physicians were settled by consensus.
Visual Grading System for Pattern Classification of SLN

Visual grading system for SLS using 99mTc-HSA: grade 1 (focal) (A), grade 2 (intermediate) (B), grade 3 (serpentine) (C), and grade 4 (no uptake) (D).
Demonstration of Correlation Between Lymphoscintigraphic Findings and NSLN Status
The visual grading system developed in the previous section was applied to the 301 patients with SLN metastasis. The proportions of patients positive for NSLN metastasis among those with each grade were calculated and tested for statistical significance using the Pearson χ2 test. The trend of the proportions was tested using the Cochran–Armitage trend test implemented with R software (R Foundation for Statistical Computing; http://www.R-project.org/).
The same visual grading system was also applied to the auxiliary dataset of 200 patients negative for SLN metastasis. If the SLS pattern could predict NSLN metastasis, then the distribution of the SLS patterns in SLN-positive–NSLN-negative patients might be similar to that in the SLN-negative patients and dissimilar to that in the SLN-positive–NSLN-positive patients. The Pearson χ2 test was performed to compare the proportions of each of the visual grades among these 3 patient groups (SLN-negative, SLN-positive–NSLN-negative, and SLN-positive–NSLN-positive).
SLN Biopsy and Complete ALND
Patients came to the operating room about 1–3 h after the 99mTc-HSA injection. A handheld γ-probe (Navigator; United States Surgical Corp.) was used to assist in SLN detection. The probe was used before incision to identify the area of greatest activity in the axilla. During surgery, the probe was used to confirm the location of the SLN and guide dissection. An SLN was defined as any radioactive node with a 10:1 ex vivo γ-probe ratio of SLN to nonsentinel LN. After excision of the SLN, the axilla was examined with the probe to confirm that no radioactive nodes remained. When SLNs were not clearly identified by SLS or the γ-probe, 1 mL of blue dye (indigo carmine) was injected subdermally into the periareolar area within the tumor-bearing breast quadrant or peritumorally before the start of surgery. The removed SLNs were sent to the pathology department for histologic examination. When an SLN was determined to be positive for metastasis, complete ALND to level II or III was performed.
Histopathologic Evaluation
All SLNs were measured, sliced perpendicular to the long axis into 2-mm-thick serial sections, entirely embedded, and frozen. Sections were taken from 2 levels of each block and stained with hematoxylin and eosin (H&E) for frozen-section diagnosis. After the frozen-section diagnosis was made, all remaining SLN tissue was thawed, fixed in 10% buffered formalin, and entirely embedded in paraffin blocks. One 4-μm-thick section from each block was stained with H&E for routine histologic examination. Other sections of SLNs in which no metastasis was identified on H&E-stained slides were examined by immunohistochemical staining with monoclonal antihuman cytokeratin (clone AE1/AE3, 1:500; Dako). When ALND was performed, all NSLNs were dissected from the fresh fibrofatty ALND specimens and embedded in paraffin blocks, and H&E-stained slides were prepared. The breast specimens were routinely processed for pathologic examination.
Construction of Model for Predicting NSLN Metastasis
The collected data included the sentinel lymphoscintigraphic pattern and the following clinical and pathologic data: patient age (y), number of negative SLNs, number of positive SLNs, size of LN metastasis (≤2, 2–10, 10–20, and >20 mm), perinodal extension (present vs. absent), primary tumor size (mm), multifocality (yes or no), histologic grade (I, II, or III), lymphovascular invasion (present vs. absent), and estrogen receptor status (positive vs. negative). Nuclear grade is generally not assessed in our hospital. However, because nuclear grade is highly correlated with histologic grade (3), and substitution of nuclear grade with histologic grade does not affect the performance of the MSKCC model (11), we used histologic grade instead of nuclear grade in the MSKCC model.
Multivariate logistic regression was performed to construct a model for predicting NSLN metastasis. Initially, all of the aforementioned 11 variables were used as covariates. Then, covariates yielding high P values (P > 0.20) were excluded from the model. The remaining covariates were used to construct the final model (National Cancer Center [NCC] model). The Hosmer and Lemeshow test was used to assess the model calibration. A nomogram for visual application of this model was drawn using the Design library (F.E. Harrell Jr.; R package version 2.0-9) and the R software program (R Foundation for Statistical Computing).
Validation of NCC Model Performance and Comparison with That of MSKCC Model
Bootstrap resampling was used for internal validation of the NCC model. Bootstrap resampling using 1,000 replications was performed using MATLAB software (version 7.4; The MathWorks, Inc.). ROC curve analysis was used to evaluate model performance. The mean AUC and 95% bootstrap confidence interval (bias-corrected and accelerated) were calculated. The same 1,000-bootstrap-resampled patient datasets were subjected to probability calculation using the MSKCC nomogram. The mean AUC and 95% bootstrap confidence interval (bias-corrected and accelerated) were calculated.
For model comparison, the mean AUC of the NCC model was compared with that of the MSKCC model using the bootstrap method. Mean ROC curves of the NCC and the MSKCC models were drawn using threshold averaging. The mean false-negative rates (FNRs) of these 2 models were calculated for the 0.05, 0.1, and 0.15 cutoff probabilities to identify the low-risk group in which complete ALND might be avoidable.
One of the unique features of the MSKCC model is the method-of-detection (immunohistochemistry, serial H&E, and routine H&E) covariate, which can be regarded as a surrogate marker for the size of the LN metastasis. This is a limitation of the model, because the method of detection is not a standardized norm and therefore differs from hospital to hospital. However, the predictive accuracy of the MSKCC model can be improved by substituting the LN size category variable (isolated tumor cells, micrometastasis, and macrometastasis) for the method-of-detection variable (12). The NCC model was compared with this improved MSKCC model.
Statistical Analysis
All of the statistical analyses were performed using SPSS software (version 18.0; SPSS Inc.) unless stated otherwise. The Pearson χ2 test was used to compare proportions. The independent-samples t test was performed for comparisons between 2 means. The survival analysis was done using Kaplan–Meier analysis (log-rank test). A P value of less than 0.05 was considered statistically significant.
RESULTS
Association Between Visual Grade of SLS and Likelihood of NSLN Metastasis
Table 1 shows patient and tumor characteristics both in the 301 SLN-positive patients (main dataset) and in the 200 SLN-negative patients (auxiliary dataset). The mean ages (±SD) were 48.5 ± 9.5 y in the SLN-positive patients and 49.6 ± 10.6 y in the SLN-negative patients (P = 0.183). In the main dataset, 142 patients (47%) were positive for NSLN metastasis.
Table 3 shows the number of patients and the incidence of NSLN metastasis positivity for each visual grade of SLS. The test for trend showed a significant increase in the rate of NSLN metastasis as the visual grade increased (P < 0.001).
Visual Grade of SLS and Likelihood of NSLN Metastasis
The distribution of the visual grades in the 159 SLN-positive–NSLN-negative patients was more similar to that in the 200 SLN-negative patients than to that in the 142 SLN-positive–NSLN-positive patients (Table 4). This distribution is consistent with the SLS pattern acting as an indicator of NSLN metastasis, because with this pattern of SLS distribution the SLN-positive–NSLN-negative patient group would be expected to cluster more closely with the SLN-negative group than with the SLN-positive–NSLN-positive group.
Distributions of SLS Visual Grades in 3 Patient Groups with Different Axillary LN Statuses
As an auxiliary analysis for demonstration of the significance of SLS findings, we performed a survival analysis of the 301 sentinel-positive patients. We excluded 6 patients because of the follow-up loss immediately after the operation. Among the remaining 295 patients included in the analysis, there were 2 (3%; SLS grade 1 [focal, n = 73]), 5 (4%; SLS grade 2 [intermediate, n = 126]), 5 (7%; SLS grade 3 [serpentine, n = 75]), and 0 (0%; SLS grade 4 [no uptake, n = 21]) with tumor recurrence during the follow-up period. Kaplan–Meier curves for recurrence-free survival show a slight trend toward poorer survival in patients with nonfocal grades (i.e., grades 2, 3, and 4) than focal grade, although this trend is insufficient to show statistical significance (P = 0.566) (Fig. 2).
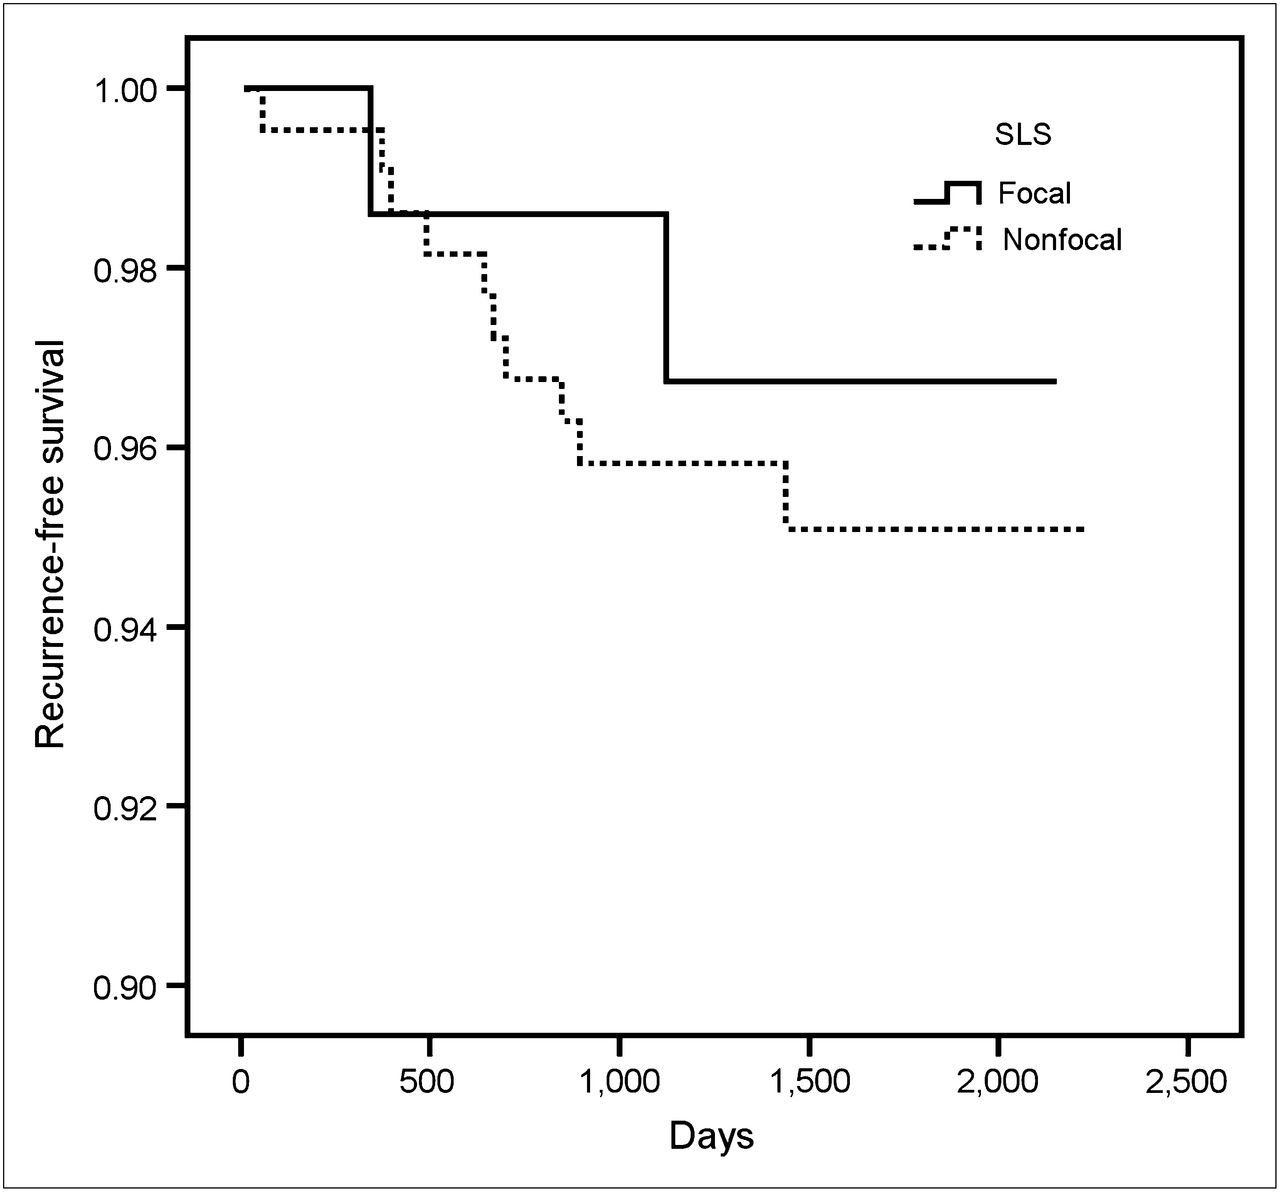
Kaplan–Meier curves for recurrence-free survival by SLS visual grades in 301 sentinel-positive patients.
Construction of Model for Predicting NSLN Metastasis and Comparison of Model Performance
Table 5 shows the results of the multivariate logistic regression analysis using all 11 of the initial covariates. After covariates with high P values (P > 0.20) were excluded, 6 variables (sentinel lymphoscintigraphic pattern, number of negative SLNs, number of positive SLNs, size of LN metastasis, perinodal extension, and size of primary breast tumor) were included in the construction of the final model (Table 6). The Hosmer and Lemeshow test yielded a P value of 0.879, indicating that the model was well-calibrated. Figure 3 shows the nomogram constructed to facilitate the application of the model.
Results of Multivariate Logistic Regression Using All 11 Covariates
Final Multivariate Logistic Regression Model for Predicting NSLN Metastasis
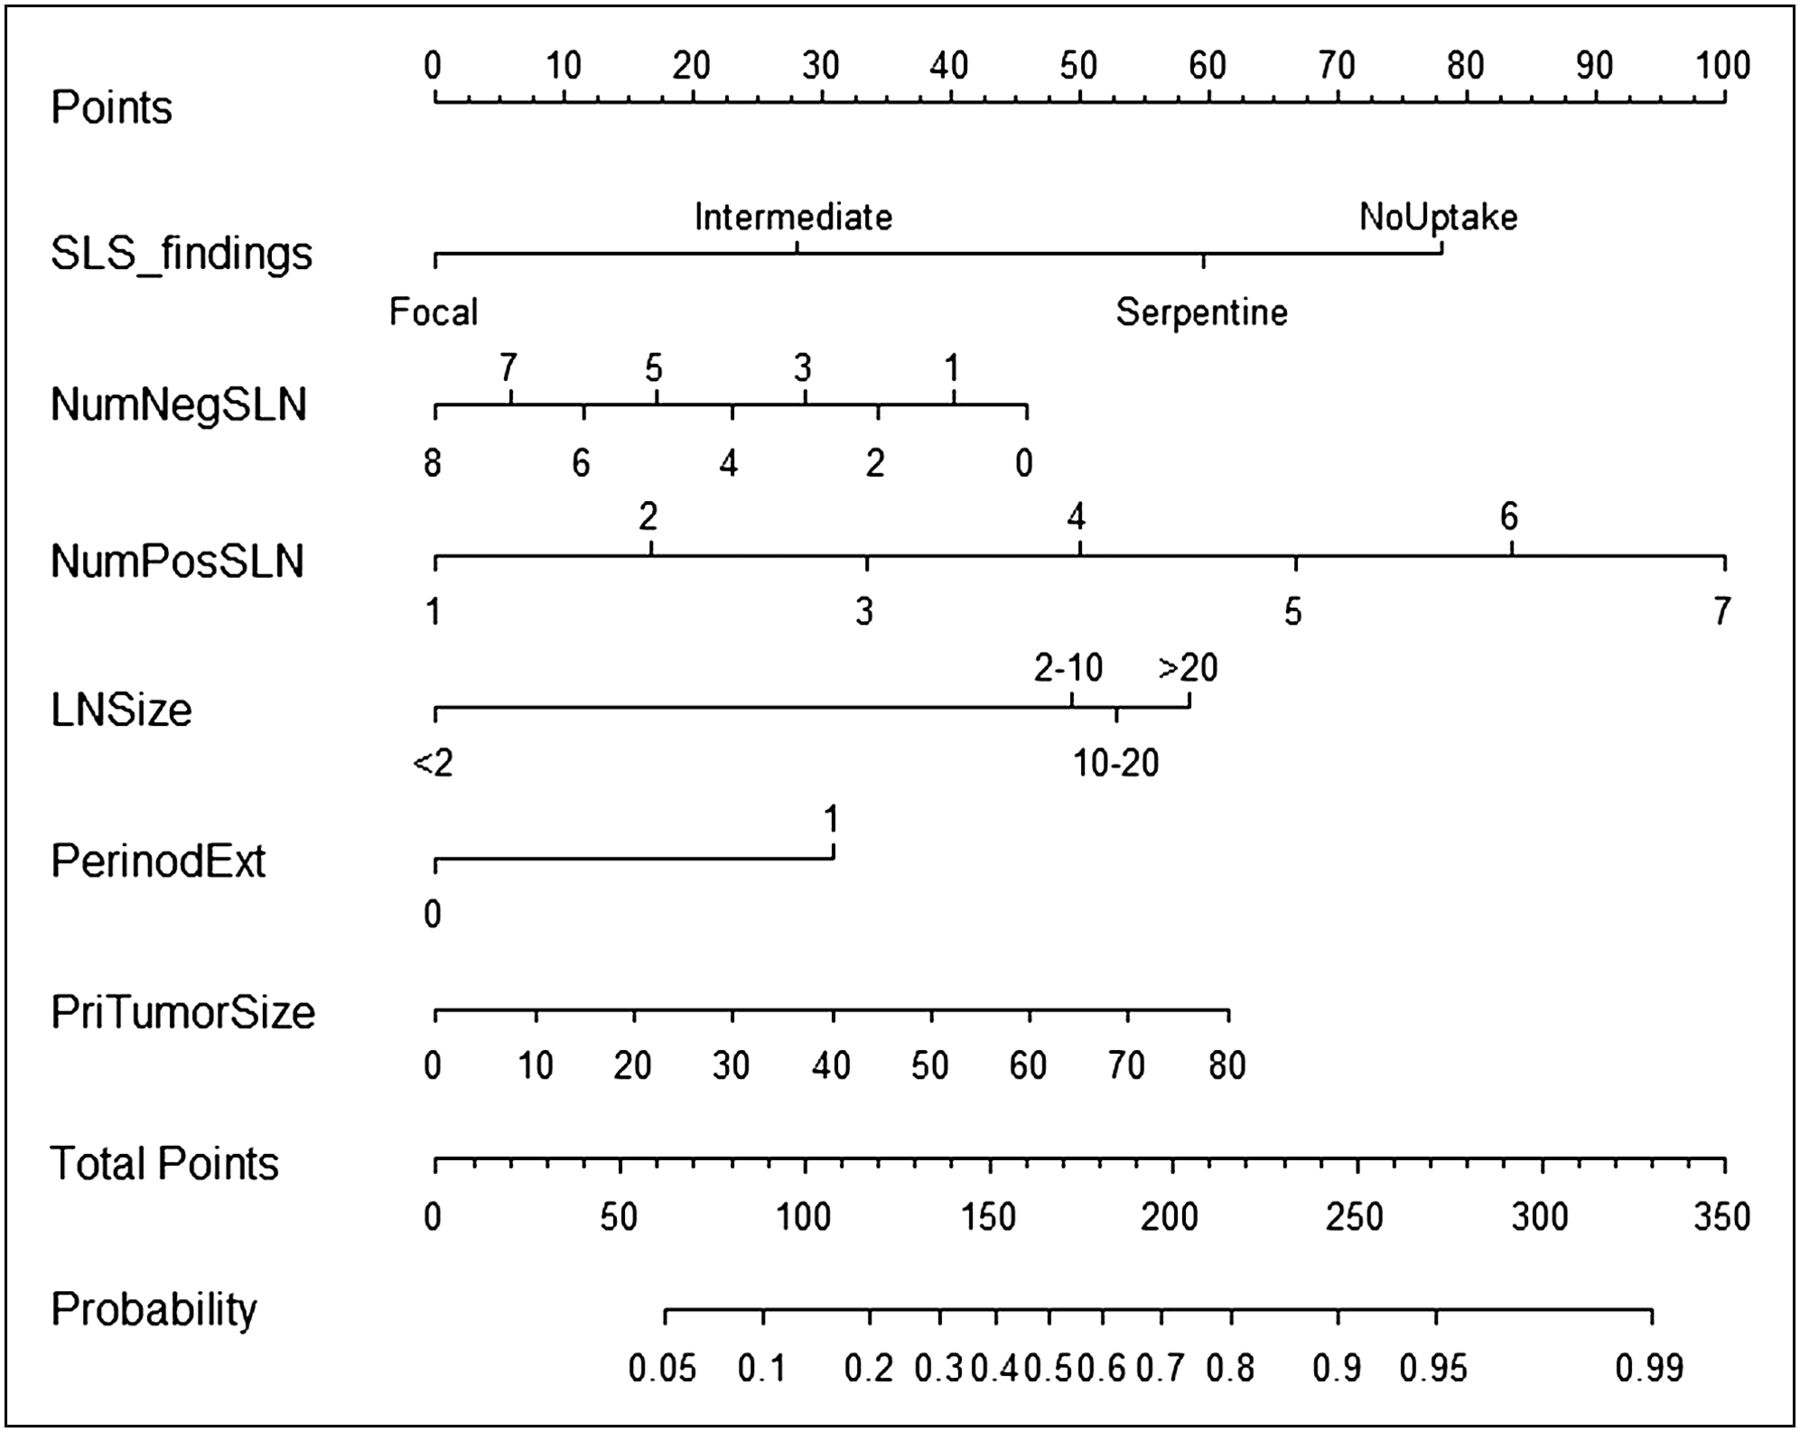
NCC nomogram for predicting NSLN metastasis. Vertical line is drawn for each of 6 variables (from row 2 to row 7), and point at intersection of vertical line with row 1 is read. Six points from 6 variables are summed, and sum point is located on total points row. Second vertical line is drawn downward from total points row to probability row. Probability at intersection is predicted probability of NSLN metastasis using NCC model. LNSize = size of LN metastasis (mm); NumNegSLN = number of negative SLNs; NumPosSLN = number of positive SLNs; PerinodExt = perinodal extension (0, absent; 1, present); PriTumorSize = primary tumor size (mm); Probability = predicted probability of NSLN metastasis.
Bootstrap resampling of the 301 SLN-positive patients was performed for internal validation of the NCC model. The mean AUC of the 1,000 bootstrap samples was 0.812 (95% confidence interval, 0.766–0.858).
The application of the MSKCC model to the same bootstrap samples yielded a mean AUC of 0.728 (95% confidence interval, 0.672–0.784). The mean AUC of the NCC model was significantly larger than that of the MSKCC model (P < 0.001). Mean ROC curves were drawn for both models (Fig. 4). Table 7 lists the FNRs calculated for both models for low predicted probabilities.
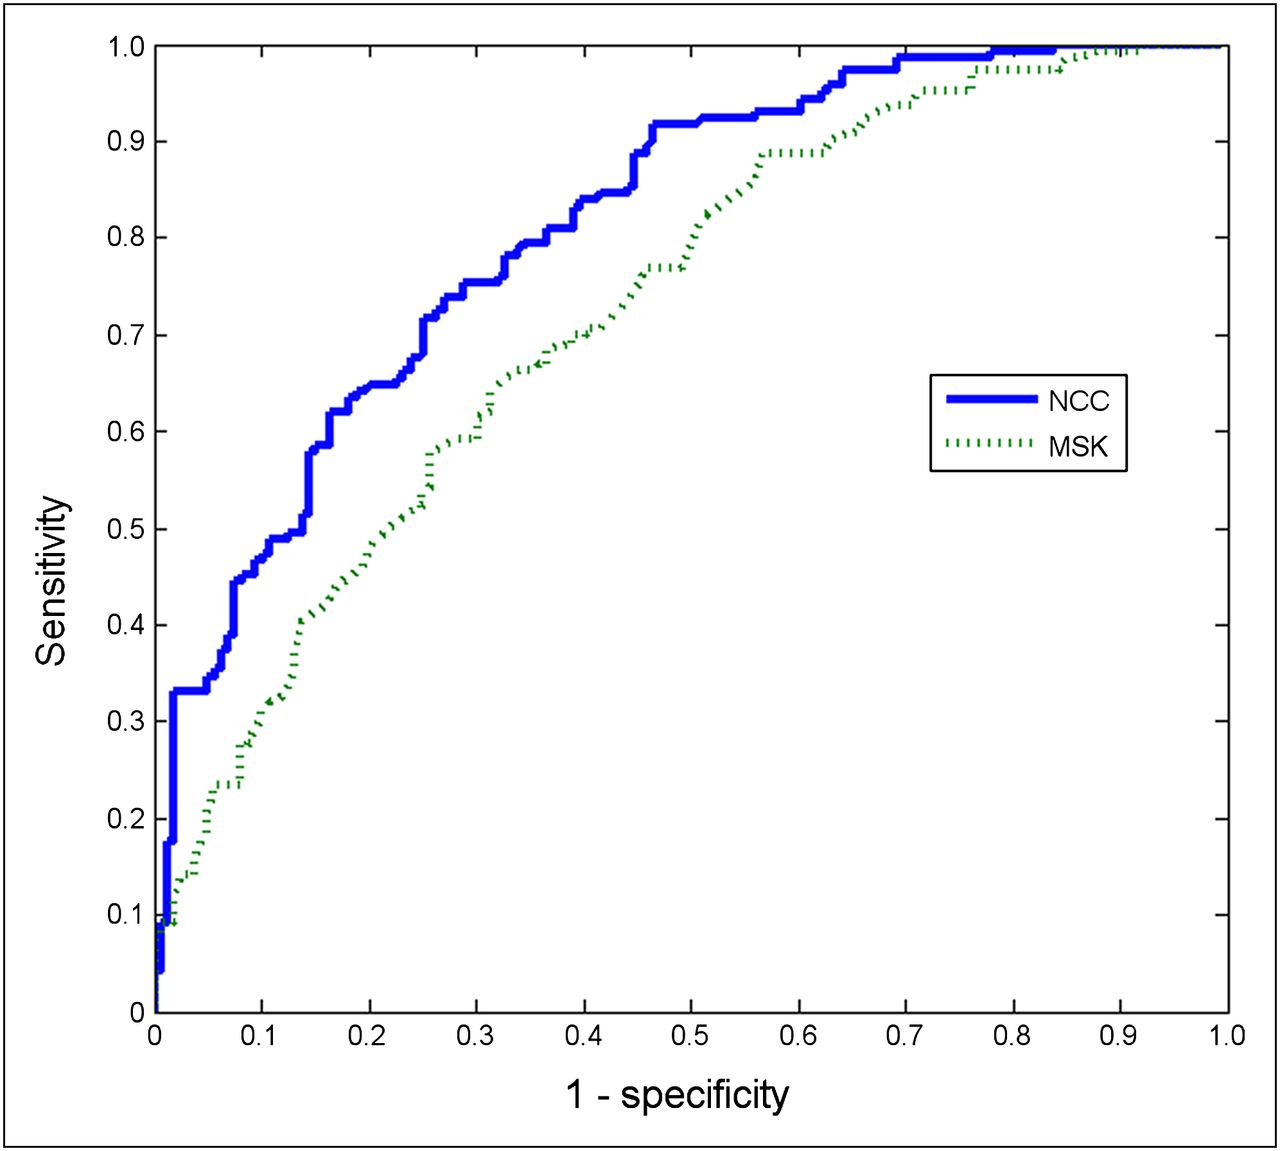
Mean ROC curves of NCC and MSKCC models from 1,000 bootstrap samples. MSK = Memorial Sloan-Kettering.
FNRs in Patients with Low Predicted Probabilities of Metastasis-Positive NSLNs
DISCUSSION
The most unique feature of the NCC model is its use of SLS imaging findings to predict NSLN metastasis. To the best of our knowledge, no model for predicting NSLN metastasis has included a covariate other than histopathologic parameters. We found that the 99mTc-HSA SLS findings can be graded according to the flow and retention pattern and that this grading system has implications for NSLN status.
Because SLS is a procedure for identifying SLNs rather than for detecting SLN metastasis, there have been a limited number of studies of SLS as a tool for assessing axillary LN status. However, indirect effects of tumor infiltration can manifest as SLS findings. A few previous studies reported a correlation between decreased SLN uptake and increased risk of axillary involvement (13–15). A reasonable explanation for this phenomenon would be that the lymphatics become progressively infiltrated with tumor cells, blocking the passage of radiotracers (13). Despite this finding, SLS generally possesses limited utility for assessing axillary involvement because small metastases would scarcely affect lymphatic flow and SLN uptake. In this study, we demonstrated that SLS findings help discriminate between NSLN-positive patients and NSLN-negative patients rather than between axillary–LN-positive patients and axillary–LN-negative patients. SLS findings in SLN-positive–NSLN-negative patients were more similar to those in SLN-negative patients than to those in SLN-positive–NSLN-positive patients (Table 4).
This phenomenon could be explained in several ways. One explanation would be that the upstream lymphatic retention pattern arises as the axillary tumor burden increases. The grading system (Table 2) reflects the degree of impairment of lymphatic transport. As the grade increases, the radioactivity of the upstream lymphatic vessels increases while that of the SLNs decreases. This might be because the lymphatic flow becomes more sluggish as the tumor obstructs the lymphatic channel, increasing mean transit time through upstream lymphatic vessels and decreasing tracer delivery to SLNs. A grade 1 (focal) SLS pattern indicates fast lymphatic transport and good SLN uptake, suggesting minimal hindrance of lymphatic flow by infiltrating tumor cells in the SLNs (unless normal lymphatic drainage is disturbed by inadequate injection or previous excisional biopsy (16)). On the other hand, a grade 3 (serpentine) pattern suggests that lymphatic flow is significantly hindered by LN metastasis. As the disease progresses, the grade 3 pattern changes to a grade 4 (no uptake), indicating complete blockage of the lymphatic channels by tumor cells. A higher-grade pattern is thus related to a greater lymphatic tumor burden, and this may be related to an increased likelihood of NSLN metastasis.
Another explanation would be related to the fact that SLNs are defined by radiotracers. The theoretic definition of an SLN is the axillary LN or LNs to which breast cancer would first metastasize. However, this definition is not practical. In clinical practice, the SLN is operationally defined by radiocolloids or blue dyes. The operational definition of an SLN is the LN or LNs that accumulate radiotracers (or blue dyes) injected into the tumor basin. In the early phase of LN metastasis in which the metastatic tumor does not distort the lymphatic flow, these 2 definitions would generate the same result. However, several studies have suggested that cancerous involvement of the lymphatic system may influence the drainage pattern (13,17,18), raising the possibility that the operationally defined SLNs might change over time. An axillary LN that harbors tumor emboli in the early phase of metastasis would be an SLN both theoretically and operationally, but as the tumor grows and impedes afferent lymphatic flow, the radiotracer delivery to this LN decreases, and the LN might show no tracer uptake in the later stages of the disease. If that were the case, the LN would be operationally defined as an NSLN, despite the fact that it was initially an SLN. The SLS pattern of upstream retention and decreased LN uptake would imply some hindrance of lymphatic drainage. This hindrance could be associated with the presence of a metastasis-positive NSLN that was initially an SLN.
When survival analysis was performed according to the SLS findings, patients with focal grade showed a slight trend toward better survival than did those with nonfocal grades, although statistically not significant. Because of the excellent prognosis of the patients included in the study (only 12 recurrences of 295 cases), more patients or a longer follow-up period may be required to derive statistically valid conclusions.
A noteworthy point of the SLS procedure is that we used 99mTc-HSA, the particle size of which (2–3 nm) is among the smallest of those of the radiocolloids available for clinical practice. The biokinetics of radiocolloids depend strongly on their particle sizes (19). Radiocolloids with large particle sizes, such as 99mTc-tin colloid (50–600 nm) and 99mTc-sulfur colloid (100–400 nm), migrate through the lymphatic channels much more slowly than does 99mTc-HSA (20). Small or large particle size per se is neither an advantage nor a disadvantage, because small particle size may cause mapping beyond true SLNs while large particle size may cause nonvisualization of SLNs if the wait time is insufficient (16). However, the grading system developed in this study is applicable primarily to SLS using 99mTc-HSA because, in our experience, SLS using radiocolloids with large particle sizes invariably shows a focal uptake pattern on delayed images, invalidating the grading system. The median transit time of 99mTc-HSA to SLN is 5 min. Therefore, in our hospital, the SLS imaging protocol for 99mTc-HSA is the acquisition of anterior images for 5 min immediately after injection followed by the acquisition of lateral images for another 5 min. Because of the rapid transport of the radiopharmaceutical, the flow through the lymphatic vessels was visualized by SLS and could be used for grading.
Using this visual grading of the SLS pattern as a covariate, we developed a model for predicting NSLN metastasis and compared its performance with that of the MSKCC model. Because this was a retrospective study, we could not prepare a prospective group as an independent dataset for the validation of the NCC model. Instead, we performed an internal validation procedure using a bootstrap method. The same bootstrap samples were used to evaluate the performance of the MSKCC model for model comparison. The bootstrap resampling method is reported to produce stable and unbiased estimates of true model performance in logistic regression analysis (21). The mean AUC of the NCC model was 0.812, which was significantly larger than the AUC of 0.728 (P < 0.001) of the MSKCC model.
We modified the MSKCC model in 2 ways. As described elsewhere (3,4,6,12), the method of detection variable of the MSKCC model is a shortcoming that limits interhospital applicability. When applying the MSKCC model to our patient dataset, we substituted the LN size category variable for the method of detection. This substitution has been reported to enhance the performance of the MSKCC model (12). The other modification was the use of histologic grade instead of nuclear grade. This substitution has been reported not to affect model performance (11).
Calibration is a measure of how accurately the predicted probabilities reflect the observed frequencies. The Hosmer and Lemeshow test suggested that the NCC model is well calibrated. FNR in the low-predicted-probability subgroup is another important measure (10). The basic intent of the model for predicting NSLN metastasis is to avoid complete ALND in SLN-positive patients with a low risk of additional NSLN metastasis. Therefore, the proportion of patients classified as at low risk for NSLN metastasis and the accuracy of the classification are important measures of the model performance. For the predicted probability of 0.10 or less, 8% of patients were classified as low risk by the NCC model. In contrast, 1% of patients were so classified by the MSKCC model (Table 7). The FNR was 0% for both models. For the predicted probability of 0.15 or less, the patient proportions of the NCC and the MSKCC models were 15.8% and 5.2%, respectively. The FNRs of the NCC and the MSKCC models were both 2.3%. This result is somewhat different from that of a previous study in which the patient proportion in the 0.10 or less probability group predicted by the MSKCC model was up to 35.8% (10). This difference may be because the proportion of patients included in the low-predicted-probability subgroup is influenced by the patient population and by the model characteristics.
There are a few limitations of this study. The size of LN metastasis variable used in the NCC model does not distinguish between SLN metastasis and NSLN metastasis. Considering the purpose of the model (i.e., the prediction of NSLN status), it would be appropriate for the size of LN metastasis variable to mean the size of the SLN metastasis. However, although the pathology reports for most patients did not specify whether the reported size of LN metastasis came from SLN or NSLN, the sizes of the SLNs were reported in most cases. SLNs are the first LNs in which the metastatic tumor starts to grow. Therefore, the largest LN metastasis can be expected to be found in the SLN in most cases. This consideration might mitigate the limitation.
Another limitation is that no independent dataset could be provided for validation of the established model in this retrospective study. The validity of the NCC model should be externally tested on many independent datasets to obtain sound proof of its accuracy.
CONCLUSION
SLS can aid in predicting NSLN metastasis in patients with breast cancer. Our prediction model using lymphoscintigraphic and histopathologic parameters performed better than established prediction models. Our model might be useful for planning surgical treatment of breast cancer.
DISCLOSURE STATEMENT
The costs of publication of this article were defrayed in part by the payment of page charges. Therefore, and solely to indicate this fact, this article is hereby marked “advertisement” in accordance with 18 USC section 1734.
Acknowledgments
This research was supported by the Bio and Medical Technology Development Program of the National Research Foundation (NRF) funded by the Korean government (MEST) (2012-0005987). No other potential conflict of interest relevant to this article was reported.
Footnotes
↵* Contributed equally to this work.
Published online Sep. 5, 2012.
- © 2012 by the Society of Nuclear Medicine and Molecular Imaging, Inc.
REFERENCES
- Received for publication March 26, 2012.
- Accepted for publication June 22, 2012.


Jump to section
Related Articles
Cited By...
- No citing articles found.