


Abstract
The purpose of this study was to evaluate the relevance for the prediction of clinical benefit of first-line treatment with erlotinib using different quantitative parameters for PET with both 18F-FDG and 3′-deoxy-3′-18F-fluorothymidine (18F-FLT) in patients with advanced non–small cell lung cancer. Methods: Data were used from a prospective trial involving patients with untreated stage IV non–small cell lung cancer. 18F-FDG PET and 18F-FLT PET were performed before and 1 (early) and 6 (late) weeks after erlotinib treatment. Several quantitative standardized uptake values (SUVs) using different definitions of volumes of interest with varying isocontours (maximum SUV [SUVmax], 2-dimensional peak SUV [SUV2Dpeak], 3-dimensional [3D] peak SUV [SUV3Dpeak], 3D isocontour at 50% of the maximum pixel value [SUV50], 3D isocontour at 50% adapted for background [SUVA50], 3D isocontour at 41% of the maximum pixel value adapted for background [SUVA41], 3D isocontour at 70% of the maximum pixel value [SUV70], 3D isocontour at 70% adapted for background [SUVA70], and relative SUV threshold level [SUVRTL]) and metabolically active volume measurements were obtained in the hottest single tumor lesion and in the sum of up to 5 lesions per scan in 30 patients. Metabolic response was defined as a minimum reduction of 30% in each of the different SUVs and as a minimum reduction of 45% in metabolically active volume. Progression-free survival (PFS) was compared between patients with and without metabolic response measured with each of the different parameters, using Kaplan–Meier statistics and a log-rank test. Results: Patients with a metabolic response on early 18F-FDG PET and 18F-FLT PET in the hottest single tumor lesion as well as in the sum of up to 5 lesions per scan had a significantly longer PFS, regardless of the method used to calculate SUV. However, the highest significance was obtained for SUVmax, SUV50, SUVA50, and SUVA41. Patients with a metabolic response measured by SUVmax and SUV3Dpeak on late 18F-FDG PET in the hottest single tumor lesion had a significantly longer PFS. Furthermore, Kaplan–Meier analyses showed a strong association between PFS and response seen by metabolically active volume, measured either in early 18F-FLT or in late 18F-FDG. Conclusion: Early 18F-FDG PET and 18F-FLT PET can predict PFS regardless of the method used for SUV calculation. However, SUVmax, SUV50, SUVA50, and SUVA41 measured with 18F-FDG might be the best robust SUV to use for early response prediction. Metabolically active volume measurement in early 18F-FLT PET and late 18F-FDG PET may have an additional predictive value in monitoring response in patients with advanced non–small cell lung cancer treated with erlotinib.
Lung cancer is the most common malignancy (1). Despite all advances in the diagnosis and treatment of non–small cell lung cancer, the prognosis for patients remains poor (2). Most patients present with advanced stage IV disease (3), and overall survival has improved little over the past decades.
In contrast, modern treatment methods with molecularly targeted agents have shown promising results in the treatment of advanced non–small cell lung cancer patients: significantly improved overall survival has been observed in patients independent of their genetic profile when patients are treated with the epidermal growth factor receptor inhibitor erlotinib (4). Because only a few patients show any clinical benefit from erlotinib therapy, identification of the subgroup most likely to respond is a matter of pressing clinical importance to avoid ineffective treatment.
18F-FDG PET has proven capable of predicting response to therapy with molecularly targeted agents (5–9). Preclinical models have shown the power of 3′-deoxy-3′-18F-fluorothymidine (18F-FLT) PET to monitor early effects of the tyrosine kinase inhibitor erlotinib (10), and clinical studies have suggested that 18F-FLT might predict response to both chemotherapy and molecularly targeted drugs (11,12).
There is growing awareness that when using PET for response prediction, accurate quantitative analysis of the results is crucial. However, there is ongoing debate as to which standardized uptake values (SUVs) to measure and which values might be of relevance for best prognostic differentiation. Several parameters and criteria have been tested and proposed (13).
Here, we present the investigation of several quantitative parameters for analysis of 18F-FDG PET and 18F-FLT PET, first after 1 wk and again after 6 wk of first-line erlotinib therapy, using the hottest single lesion and the sum of up to 5 other lesions for early response prediction in unselected patients with advanced non–small cell lung cancer. The aim of this study was to confirm and extend our recently published findings regarding the therapy response assessment with a single quantitative parameter for analysis of 18F-FDG PET and 18F-FLT PET (8).
MATERIALS AND METHODS
Patients
Between September 2007 and September 2009, patients with advanced-stage non–small cell lung cancer were recruited into the trial at the University Hospital of Cologne (8). Inclusion criteria were at least 1 measurable target lesion, age over 18 y, Eastern Cooperative Oncology Group performance status of 0–2, serum creatinine less than 1.7 mg/dL, no decompensated liver failure, no sign of hyperthyroidism, normal blood glucose levels, and no prior systemic treatment. Written informed consent was obtained from all patients, and the trial was approved by the local ethics committee, the responsible Federal Institute for Drugs and Medical Devices (BfArM), the responsible federal state authorities of North Rhine-Westphalia, and the Federal Office for Radiation Protection (BfS) (clinical trials, NCT00568841). To investigate the study objectives mentioned, previously published datasets were included in the current analysis (8).
Treatment
Erlotinib was administered as first-line therapy at a dose of 150 mg once daily for 6 wk or until documented progression. Doses were reduced in accordance with the manufacturer's recommendations in the case of adverse events, and treatment was discontinued on development of grade IV toxicity. Two patients temporarily interrupted treatment for more than 2 wk because of adverse reactions. During the treatment pause, the tumor recurred, but new response was observed in 1 patient when treatment was continued at a reduced dose. One patient underwent additional radiotherapy of the target lesion.
Image Acquisition
18F-FDG PET and 18F-FLT PET scans were performed within 10 d before therapy and at 1 and 6 wk after the start of erlotinib therapy. 18F-FLT and 18F-FDG were synthesized as previously described (14,15). PET images were obtained using an ECAT EXACT 47 (Siemens) after the patient had fasted for 6 h. The time between tracer injection and acquisition of data was 59 ± 14 and 58 ± 15 min for 18F-FDG and 18F-FLT, respectively. On average, 365 ± 30 MBq of 18F-FDG and 305 ± 89 MBq of 18F-FLT were injected. The minimal time between time from injection to imaging was 36 min, and the maximal time was 96 min. For a single patient, scanning differed by less than 15 min in all cases. The attenuation-corrected scan trajectory covered 90 cm (6 bed positions: 5-min emission, 3-min transmission). All scans were corrected for decay, dead time, scatter, and randoms and reconstructed by ordered-subset expectation maximization. The same scanner, same protocol for acquisition, and same software for reconstruction were used for all patients analyzed (ordered-subset expectation maximization using 4 iterations and 16 subsets; zoom, 1; image matrix size, 128 × 128; and gaussian postsmoothing of 5 mm in full width at half maximum). The final image spatial resolution was approximately 7 mm in full width at half maximum near the center of the field of view, using these settings.
Image Analysis
As proposed by the PET Response Criteria in Solid Tumors (PERCIST) 1.0 guideline (16), measurements were performed in the hottest single lesion and additionally in the sum of up to 5 measurable target lesions. These were analyzed with no more than 2 lesions per organ, selecting the lesions with the highest maximum SUV (SUVmax). The target lesions in 18F-FDG PET and 18F-FLT PET did not have to be identical, but wherever possible, lesions were selected that were suitable for analysis with both tracers and for Response Evaluation Criteria in Solid Tumors (RECIST) (17) measurements. In accordance with the PERCIST 1.0 guideline (16), the 2-dimensional (2D) peak SUV (SUV2Dpeak) of the hottest baseline single tumor lesion in 18F-FDG PET was at least 1.5-fold greater than the mean baseline liver SUV plus 2 SDs in all patients. In contrast, for 18F-FLT PET analyses the use of liver as background control was not possible, because, in general, 18F-FLT SUVs in liver were higher than SUVs in tumor lesions (12,18).
The tumor volume of interest (VOI) for SUV calculation was defined using a 3-dimensional (3D) region-growing algorithm, implemented with software developed in-house at the VU University Medical Center (19,20) that makes use of the 3D search algorithm in the IDL software package (version 6.2; Research Systems Inc.). First, SUVmax normalized to body weight was determined for each lesion, using the voxel with the maximum uptake on reconstructed PET images without additional rebinning, resampling, or smoothing. The SUV2Dpeak was determined using a 1.2-cm-diameter, fixed-size circular region of interest defined in the axial plane, automatically centered on the tumor area with maximum uptake. The 3D SUV peak (SUV3Dpeak) was determined using a 1.2-cm-diameter spheric VOI automatically centered on the tumor area with maximum uptake. In contrast to previously published data (8), 2D and 3D peak VOIs were defined fully automatically without any manual correction. In addition, the following SUVs were obtained: the 3D isocontour at 41% of the maximum pixel value adapted for background (SUVA41), 3D isocontour at 50% of the maximum pixel value (SUV50), 3D isocontour at 50% adapted for background (SUVA50), 3D isocontour at 70% of the maximum pixel value (SUV70), and 3D isocontour at 70% adapted for background (SUVA70). The background-adapted VOI was generated by first generating a 3D VOI using the threshold of 70% of maximum pixel value. This first VOI roughly indicates the boundary of the metabolic volume of the primary tumor. Next, voxels located 2 cm from this initially estimated tumor boundary are used to estimate the average local background value. However, voxels with SUVs greater than 3 are excluded to avoid inclusion of tumor voxels in the background estimation. A background-adapted threshold value is then obtained by taking, for example, 50% of the maximum tumor pixel value plus the average background value. For example, this means that the final SUVA50 threshold will be 1.4 if background equals 1 and tumor SUVmax equals 1.8. Higher background values will thus automatically shift the threshold to higher values. This adapted background threshold value is then used in a final region-growing step, using the location of the maximum tumor pixel value as a starting point, to generate the final VOI (21). The relative SUV threshold level (SUVRTL) was calculated where possible, as described elsewhere (22). The metabolic tumor volume was also estimated on the basis of the SUV50 isocontour (VOL50). The product of VOL50 and SUV50 was calculated for both 18F-FDG and 18F-FLT scans and named total lesion glycolysis (TLG) (23) and total lesion proliferation (TLP). Data for the SUV2Dpeak, using a 1.2-cm-diameter, fixed-size circle manually set on the tumor area with the highest uptake and the SUVmax derived by commercially available software, have already been shown (8).
Response Assessment Based on PET
Metabolic response was defined according to the PERCIST guidelines (16): a reduction in 18F-FDG or 18F-FLT uptake of 30% or greater was defined as a metabolic response for all SUVs; for VOL50, TLG, and TLP, a metabolic response was defined as a reduction of uptake of 45% or greater for both 18F-FDG and 18F-FLT. Receiver-operating-characteristic analyses were performed to make sure that cutoff values applied were acceptable for determination of metabolic response. For each patient and each scan, the SUV of the lesion with the highest SUVmax at baseline was compared with the SUV of the lesion with the highest SUVmax on the later PET scans performed after 1 and 6 wk (single hottest SUV). The determination of the single hottest lesion was independent of the previous scan. Additionally, for each patient and every scan, up to 5 lesions with the highest SUVmax were summed for all identified lesions (sum SUV) at baseline and compared with the sum SUV on the later PET scans after 1 and 6 wk.
Statistical Analysis
The objective was to compare different SUVs and metabolic tumor volume measurement to assess their ability to predict progression-free survival (PFS) under ongoing therapy with erlotinib. PFS was defined as the time between start of medication and death or progression under ongoing medication. The analysis of PFS was performed using Kaplan–Meier estimates and log-rank tests with SPSS statistical software (version 17.0; SPSS).
RESULTS
Patient Characteristics
Forty patients were enrolled in the trial. All patients underwent baseline 18F-FLT PET and 18F-FDG PET. Three patients did not have early follow-up PET scans 1 wk after treatment because of rapid clinical deterioration leading to death. Raw datasets for new reconstruction were missing at the time of the additional analysis in 7 patients for 18F-FDG PET and in 8 patients for 18F-FLT PET. One patient missed the 18F-FLT PET scan after 1 wk. Consequently, 30 patients with early 18F-FDG PET and 28 patients with early 18F-FLT PET were included in the current analysis. Patient characteristics are shown in Table 1. An additional 8 patients missed 18F-FDG PET and 18F-FLT PET after 6 wk, 6 of whom had shown early progression before day 42.
Characteristics of Study Cohort
Early 18F-FDG PET Response and PFS
Early 18F-FDG PET response was measurable in all 30 cases. SUV70 and SUVA70 became equal to the single hottest value (SUVmax) in 2 and 4 patients, respectively. The calculation of SUVRTL was possible in 23 patients.
A significantly better PFS was observed for metabolically responding patients assessed with SUVmax, SUV2Dpeak, SUV3Dpeak, SUV50, SUVA50, SUVA41, and SUVA70 (Figs. 1 and 2; Table 2) when the single hottest lesion for measurement of metabolic response was used. Similarly, for the sum of up to 5 lesions, a significant difference in PFS was observed when using SUVmax, SUV3Dpeak, SUV50, SUVA50, SUVA41, SUV70, and SUVA70 (Fig. 1; Supplemental Fig. 1 [supplemental materials are available online only at http://jnm.snmjournals.org]; Table 2). SUV3Dpeak and SUVmax showed a significant differentiation of the prediction of PFS for the single hottest lesion and the sum of up to 5 lesions, and none of the other quantitative parameters was superior to these.

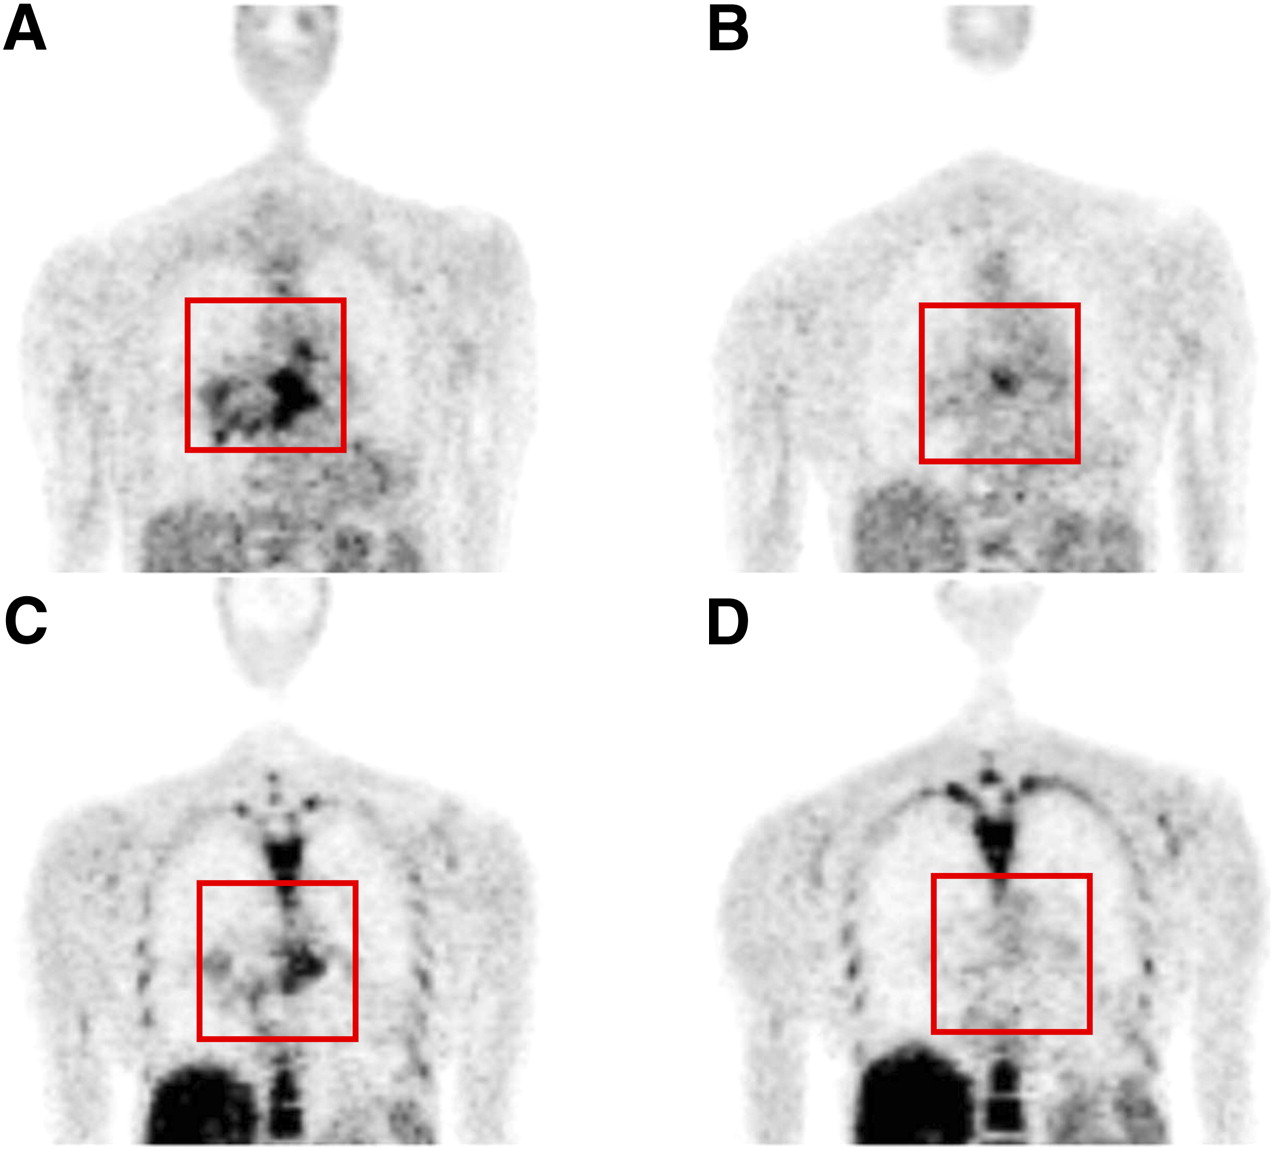
18F-FDG PET (A) and 18F-FLT PET (C) before start of treatment, and 18F-FDG PET (B) and 18F-FLT PET (D) after 1 wk of treatment with erlotinib.

Single hottest SUV on early 18F-FDG PET (week 1). PFS is shown for metabolically responding and nonresponding patients using single SUVs. Best differentiation was observed using SUVmax, SUV50, SUVA50, SUVA41, and SUVA70. SUV3Dpeak was not superior to these values.
Significant Differentiation of Prediction of PFS Using Different Quantitative Measurements for Metabolic Response After 1 Week of Treatment
Early 18F-FLT PET Response and PFS
Early 18F-FLT PET could be evaluated in all 28 cases. SUVA70 became equal to SUVmax in 6 patients. The calculation of SUVRTL was possible in 6 patients only.
A significantly better PFS was observed for metabolically responding patients assessed with SUV50, SUVA50, SUVA41, and TLP (Fig. 1; Supplemental Fig. 2; Table 2) when the single hottest lesion measured was used. Taking the sum of up to 5 lesions produced a significant difference in PFS using the sum of SUVmax, SUV50, SUVA50, SUVA41, VOL50, and TLP (Fig. 1; Supplemental Fig. 3; Table 2). SUV2Dpeak and SUV3Dpeak did not show a predictive differentiation; however, they were drawn automatically and may contain high uptake in adjacent tissues such as bone marrow or liver.
Late 18F-FDG Response and PFS
Late 18F-FDG PET response was measured in all 22 datasets available. SUV70 and SUVA70 were identical to SUVmax in 2 and 6 cases, respectively. The estimation of SUVRTL was possible in 11 patients.
The metabolic response measured in the hottest single lesion revealed significant results for SUVmax, SUV3Dpeak, SUVA70, and TLG. The Kaplan–Meier curves for PFS of SUVmax and SUVA70 were identical, as were the values themselves. No significant difference could be observed using SUV50, SUVA50, SUVA41, SUV70, VOL50, and SUVRTL. SUV2Dpeak, SUV70, SUVA70, and TLG discriminated significantly between responders and nonresponders, even though values were borderline, when the sum of up to 5 lesions was taken (Supplemental Figs. 4 and 5). Again, SUV2Dpeak and SUV3Dpeak failed to show superiority over other methods’ values.
Late 18F-FLT Response and PFS
SUVmax, SUV2Dpeak, SUV3Dpeak, SUV50, SUVA50, SUVA41, VOL50, and TLP were measurable in all 22 cases. The calculation of SUV70 and SUVA70 was equal to SUVmax in 1 and 7 patients, respectively. SUVRTL could be measured in 5 patients only.
With 18F-FLT PET, neither the single hottest lesion nor the sum of up to 5 lesions was able to indicate a significantly longer PFS for patients showing a metabolic response at the time of scanning (Supplemental Figs. 6 and 7).
DISCUSSION
The following findings emerge from the analysis of up to 10 quantitative values, each obtained from three 18F-FDG PET and three 18F-FLT PET scans of up to 5 lesions in a total of 30 patients: (i) the results of 18F-FDG PET have a higher predictive value than those of 18F-FLT PET for a population treated with erlotinib with a low prevalence of epidermal growth factor receptor mutations; (ii) SUVmax, SUV50, SUVA50, and SUVA41 are good and consistent predictive markers under the reconstruction settings given. How other parameters will help in the future in conjunction with higher resolution PET scans remains to be seen; (iii) early PET is better than late PET for response prediction.
Several methods are currently used for the quantification of PET: SUVmax using the voxel with maximum uptake; SUV2Dpeak using a 1.2-cm-diameter region of interest centered on the tumor area with maximum uptake; SUV3Dpeak using a 1.2-cm-diameter VOI centered on the tumor area with maximum uptake; several isocontour VOIs—adapted for background (SUVA41, SUVA50, and SUVA70) or without background adaption (SUV50 and SUV70); SUVRTL; VOL50; and the product of VOL50 and SUV50 named TLG and TLP.
SUVmax is in growing use and is the de facto standard. However, its use should be recommended with caution, even though stem cell biology suggests that the most critical part of a tumor is the most aggressive one and not the entire tumor (16). Here, changes in SUVmax in early 18F-FDG PET in the hottest single tumor lesion and in the sum of up to 5 lesions and in early 18F-FLT PET in the hottest single tumor lesion were predictive for PFS. Intuitively, other parameters seem more attractive because they use more information than that included in the single hottest voxel (Table 2) (24). In fact, early response prediction using SUV50, SUVA50, and SUVA41 after 1 wk of treatment showed significant results using either 18F-FDG or 18F-FLT as the tracer. Using different VOI definitions for SUV calculation is therefore a promising approach in early 18F-FDG PET for the hottest single lesion and the sum of up to 5 SUVs and should be performed to evaluate response assessment in PET. Hence, SUVmax, SUV50, SUVA50, and SUVA41 brought equally good results, whereas no values appeared superior to SUVmax for early response assessment. SUV70 and SUVA70 calculations became equal to the single hottest value (SUVmax) under erlotinib treatment in metabolically responding patients. In other words, in the present patient population these measurements did not provide additional information over SUVmax.
In late 18F-FDG PET, the single hottest SUVmax demonstrated the highest predictive power. Therefore, it could remain the most frequently used diagnostic parameter, its ease of use and reproducibility making it attractive for early and late response assessment.
Quantification measurements may be compromised when the VOI around the tumor area with the highest uptake is automatically generated, because this may include other organs with a much higher or lower physiologic uptake. The incidental inclusion of liver or bone marrow, for instance, with the high physiologic uptake of either into the VOI of the target lesions, limits the value of 18F-FLT PET. Manual corrections also appear necessary to exclude intrusion of nontumor structures or organs in certain cases of 18F-FDG PET. However, manual definition is associated with a higher degree of observer variability and is not applicable for SUV2Dpeak and SUV3Dpeak, for which, by definition, 1.2-cm-diameter regions of interest or VOIs are centered on the tumor area with maximum uptake. Because of its fixed size, SUV2Dpeak and SUV3Dpeak may contain nontumor tissue or tumor areas with low uptake, possibly contributing to the lower discriminative value of SUV2Dpeak and SUV3Dpeak in the early PET scans, as compared with SUVmax. For the same reasons, it was technically impossible to calculate SUVRTL in several cases, possibly detracting from its informative value.
Effective treatment with cytostatic agents does not necessarily result in fast and early tumor size reduction. Thus, no response can be expected, based on RECIST, after treatment of just a few weeks (25). In fact, the volume-adapted parameter VOL50 was not found to be helpful for early response evaluation with 18F-FDG and 18F-FLT. In contrast, TLG and TLP include not only the tumor volume VOL50 but also its proliferation activity SUV50. We observed a significantly higher PFS in patients with early metabolic response measured by TLP in the single hottest lesion and the sum of up to 5 lesions. TLG showed accurate discrimination not for early but for late response assessment for the single hottest lesion and for the sum of up to 5 lesions.
Except for single hottest SUVmax, single hottest SUV3Dpeak, and TLG in late 18F-FDG PET after 6 wk, no other values showed significant discrimination between responders and nonresponders. This might be because there was no late PET scan available in 6 patients who had already displayed progressive disease before day 48. That the single hottest value in 18F-FDG PET still had a predictive impact underlines the theory that the most aggressive part of a tumor with the highest 18F-FDG uptake is the most critical one.
In our patient population, 18F-FDG appeared to have a higher predictive value than 18F-FLT. This may be due to the rare prevalence of epidermal growth factor receptor mutations. In patients with a higher probability of mutations, measuring response to targeted therapy using 18F-FLT has been more promising (11). In those patients (Asian, nonsmoking, adenocarcinoma), the role of 18F-FLT might be gaining importance.
Interestingly, in our patients, prolonged PFS was observed not only in the total group of patients with epidermal growth factor receptor mutations but also in patients without detected mutation and an early 18F-FDG response. Therefore, a proportion of patients who benefit from erlotinib treatment without detectable genetic mutations might be identified by early 18F-FDG PET (8). Similar results were obtained by Mileshkin et al. (9), for whom best results were obtained for 18F-FDG PET after 2 wk of erlotinib treatment in pretreated lung cancer patients.
Finally, when functional imaging is used to identify patients who might profit from a certain therapy, the assessment should be made at the earliest stage possible to avoid futile use of medication and possible toxicity. For this reason, we favor imaging with 18F-FDG PET as promptly as possible.
CONCLUSION
On the basis of the findings of this study in advanced non–small cell lung cancer patients treated first-line with erlotinib, early response monitoring using 18F-FDG PET and 18F-FLT PET and different SUV quantification methods appears to be an excellent starting point from which to predict the response of patients to modern molecular targeted therapies. SUVmax, SUV50, SUVA50, and SUVA41 in 18F-FDG PET led to the best, robust predictive differentiation of patients’ response early after 1 wk of treatment. Metabolically active volume measurement in early 18F-FLT PET and late 18F-FDG PET might have additional predictive value in monitoring response. How quantitative measurements of different parameters in PET assessment might be of further benefit to patients will emerge in future trials.
DISCLOSURE STATEMENT
The costs of publication of this article were defrayed in part by the payment of page charges. Therefore, and solely to indicate this fact, this article is hereby marked “advertisement” in accordance with 18 USC section 1734.
Acknowledgments
We thank Anja Ritter, Nicole Laufs, Mechthild Pues, and René Chudzicki for their technical support in PET acquisition and reconstructions. This work was supported by funding to the Center for Integrated Oncology Cologne Bonn from German Cancer Aid as part of the Program for the Development of Interdisciplinary Oncology Centers of Excellence and by the German Federal Ministry of Science and Education (BMBF) as part of the National Genome Research Network program (NGFNplus, grant 01GS08100). In addition, this work was partly supported by the German Federal Ministry of Research and Education (BMBF grant 01KN0706). Erlotinib was supplied by Roche. No other potential conflict of interest relevant to this article was reported.
Footnotes
Published online Nov. 7, 2011.
- © 2011 by Society of Nuclear Medicine
REFERENCES
- Received for publication June 14, 2011.
- Accepted for publication August 30, 2011.


Jump to section
Related Articles
Cited By...
- Prognostic value of early response assessment using (18F)FDG-PET in patients with advanced non-small cell lung cancer treated with tyrosine-kinase inhibitors
- Assessment of Tumor Size Reduction Improves Outcome Prediction of Positron Emission Tomography/Computed Tomography After Chemotherapy in Advanced-Stage Hodgkin Lymphoma
- Sepantronium Bromide (YM155) Enhances Response of Human B-Cell Non-Hodgkin Lymphoma to Rituximab