


Article Figures & Data
Figures
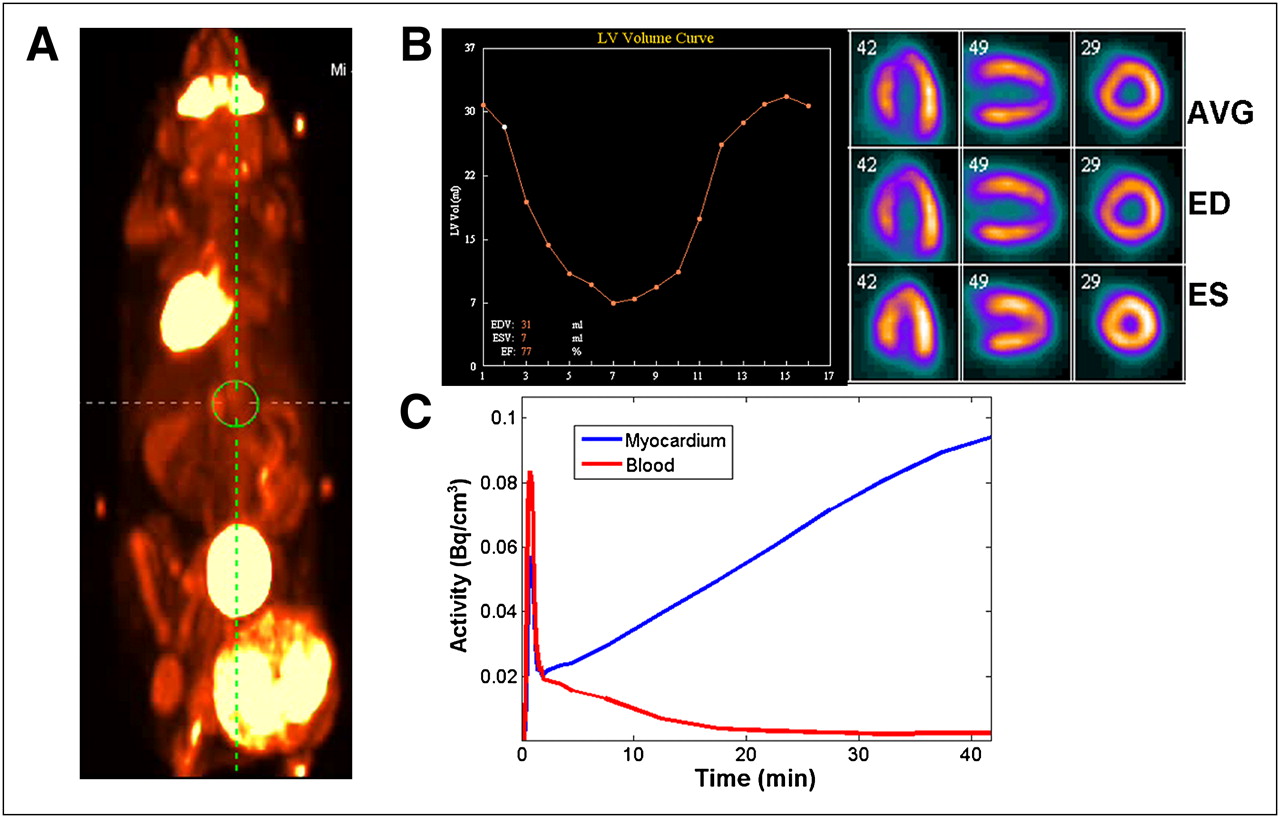
- FIGURE 1.
Small-animal PET images of 18F-FDG distribution in 25-g mouse. Whole-body (A), cardiac ECG gated (B), and cardiac dynamic (C) distributions can be obtained simultaneously with list-mode imaging. AVG = average; ED = end-diastole; EDV = end-diastolic volume; EF = ejection fraction; ES = end-systole; ESV = end-systolic volume; LV = left ventricular; Vol = volume. Whole-body image and cardiac dynamic data were from Inveon dedicated PET system (Siemens AG). ECG gated images from LabPET (Advanced Molecular Imaging) were provided courtesy of Roger Lecomte, Université de Sherbrooke.
- FIGURE 2.
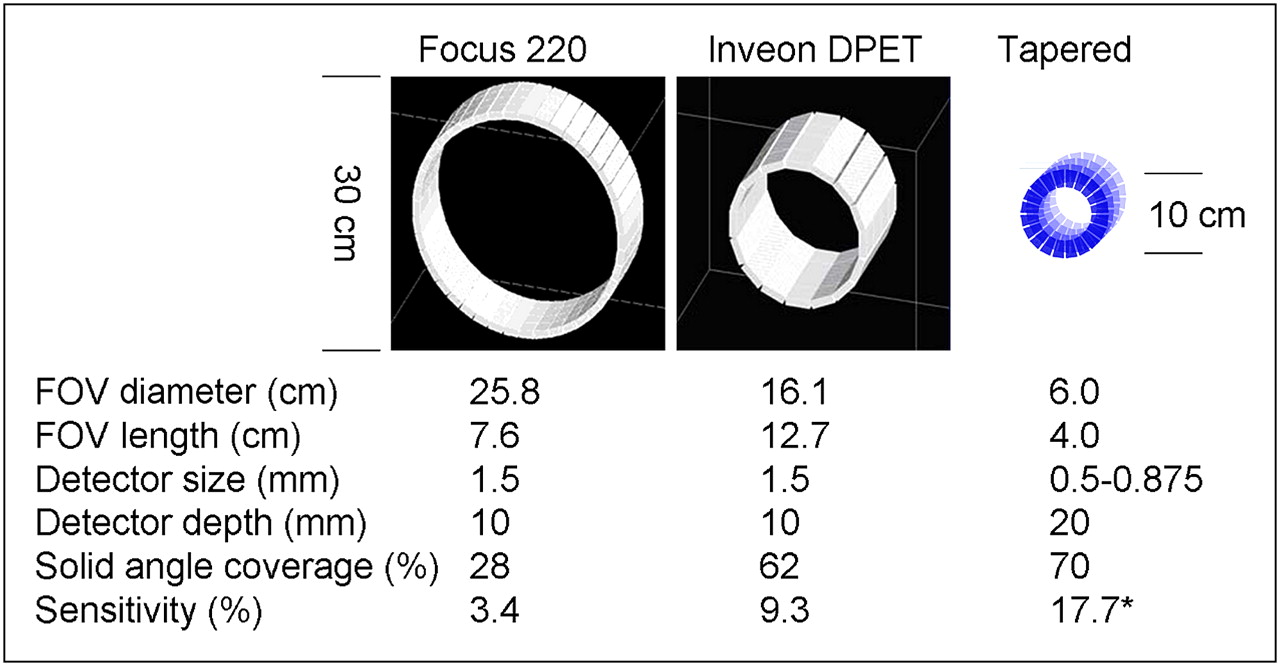
Evolution of small-animal PET scanners for mouse imaging. Sensitivity is increased with solid-angle coverage and detector depth. *Value was based on simulation. FOV = field of view. Tapered detector design was provided courtesy of Sara St. James and Simon Cherry, University of California, Davis. (Focus 220 and Inveon dedicated PET [DPET] images reprinted with permission of (12).)
- FIGURE 3.
(A) Detector PSF and positron-range (β+) modeling can be included in system matrix used for iterative image reconstruction. LOR = line of response (Modified with permission of (8).) (B) Relative to that obtained with filtered backprojection (FBP), improved image resolution was achieved by use of maximum a posteriori (MAP) reconstruction with PSF and positron-range modeling (MAPR). (C and D) With MAPR, renal cortex can be resolved clearly in mouse kidney (C), with validation of improved accuracy against ex vivo biodistribution (BioD) values (D). %ID/g = percentage injected dose per gram. 61Cu-PTSM mouse images from Focus small-animal PET (Siemens AG) were provided courtesy of Richard Laforest, Washington University.
- FIGURE 4.
(A) Parametric images of regional myocardial glucose uptake (rMGU) influx rate constant (Ki) in mouse after PSF reconstruction. (Simulated image reprinted with permission of (13).) (B) Input function and time-basis functions (tissue response) for fully 4-dimensional (4D) image reconstruction can be derived directly from PET raw data. (Reprinted with permission of (22).) (C) Recovery of temporal resolution (early 10-s frame) with 4D vs. conventional 3D reconstruction of 18F-FDG brain images from High Resolution Research Tomograph (Siemens AG). Images were provided courtesy of Andrew J. Reader, Montreal Neurologic Institute.
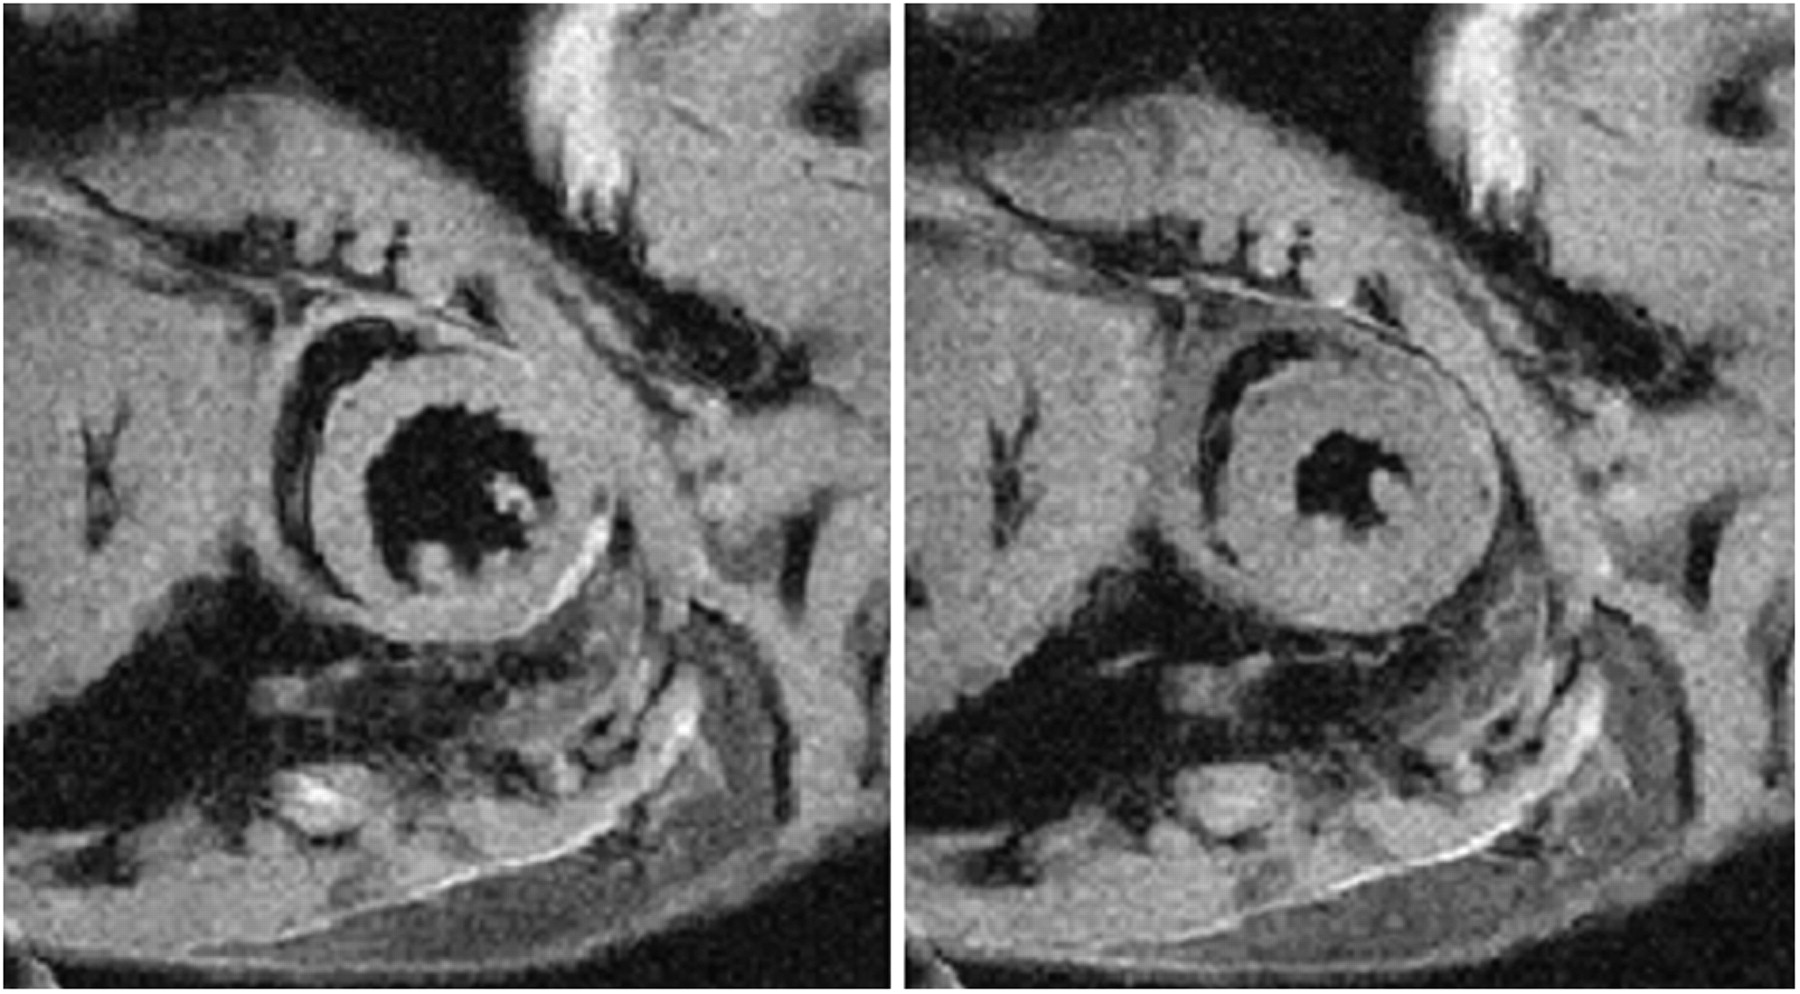
- FIGURE 5.
End-diastolic (left) and end-systolic (right) midventricular short-axis MR images of mouse heart, taken from cine dataset with 16 frames across cardiac cycle. Spatial resolution was 0.15 × 0.15 × 0.5 mm3, and temporal resolution was 6 ms. Images were acquired with 7-T MRI system, and total scan time was approximately 5 min.
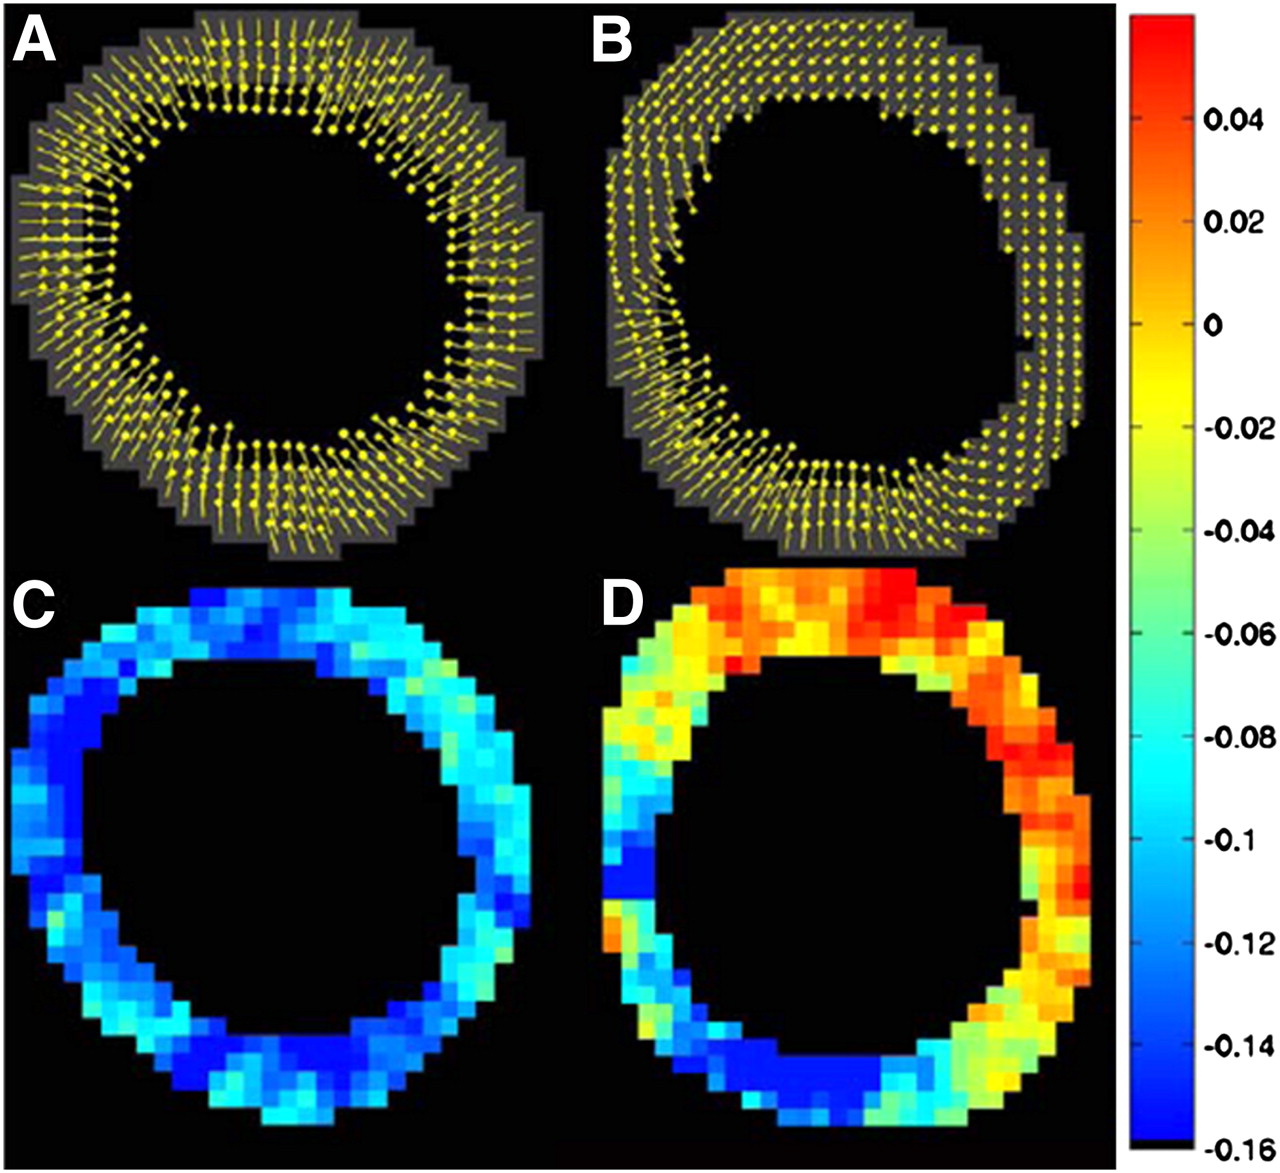
- FIGURE 6.
End-systolic short-axis cine DENSE-acquired displacement (A and B) and circumferential shortening (C and D) maps of normal (A and C) and 7-d postinfarction (B and D) mouse heart. Region of infarction (11:00–5:00) has markedly reduced displacement (B) and shortening (yellow–orange) (D).
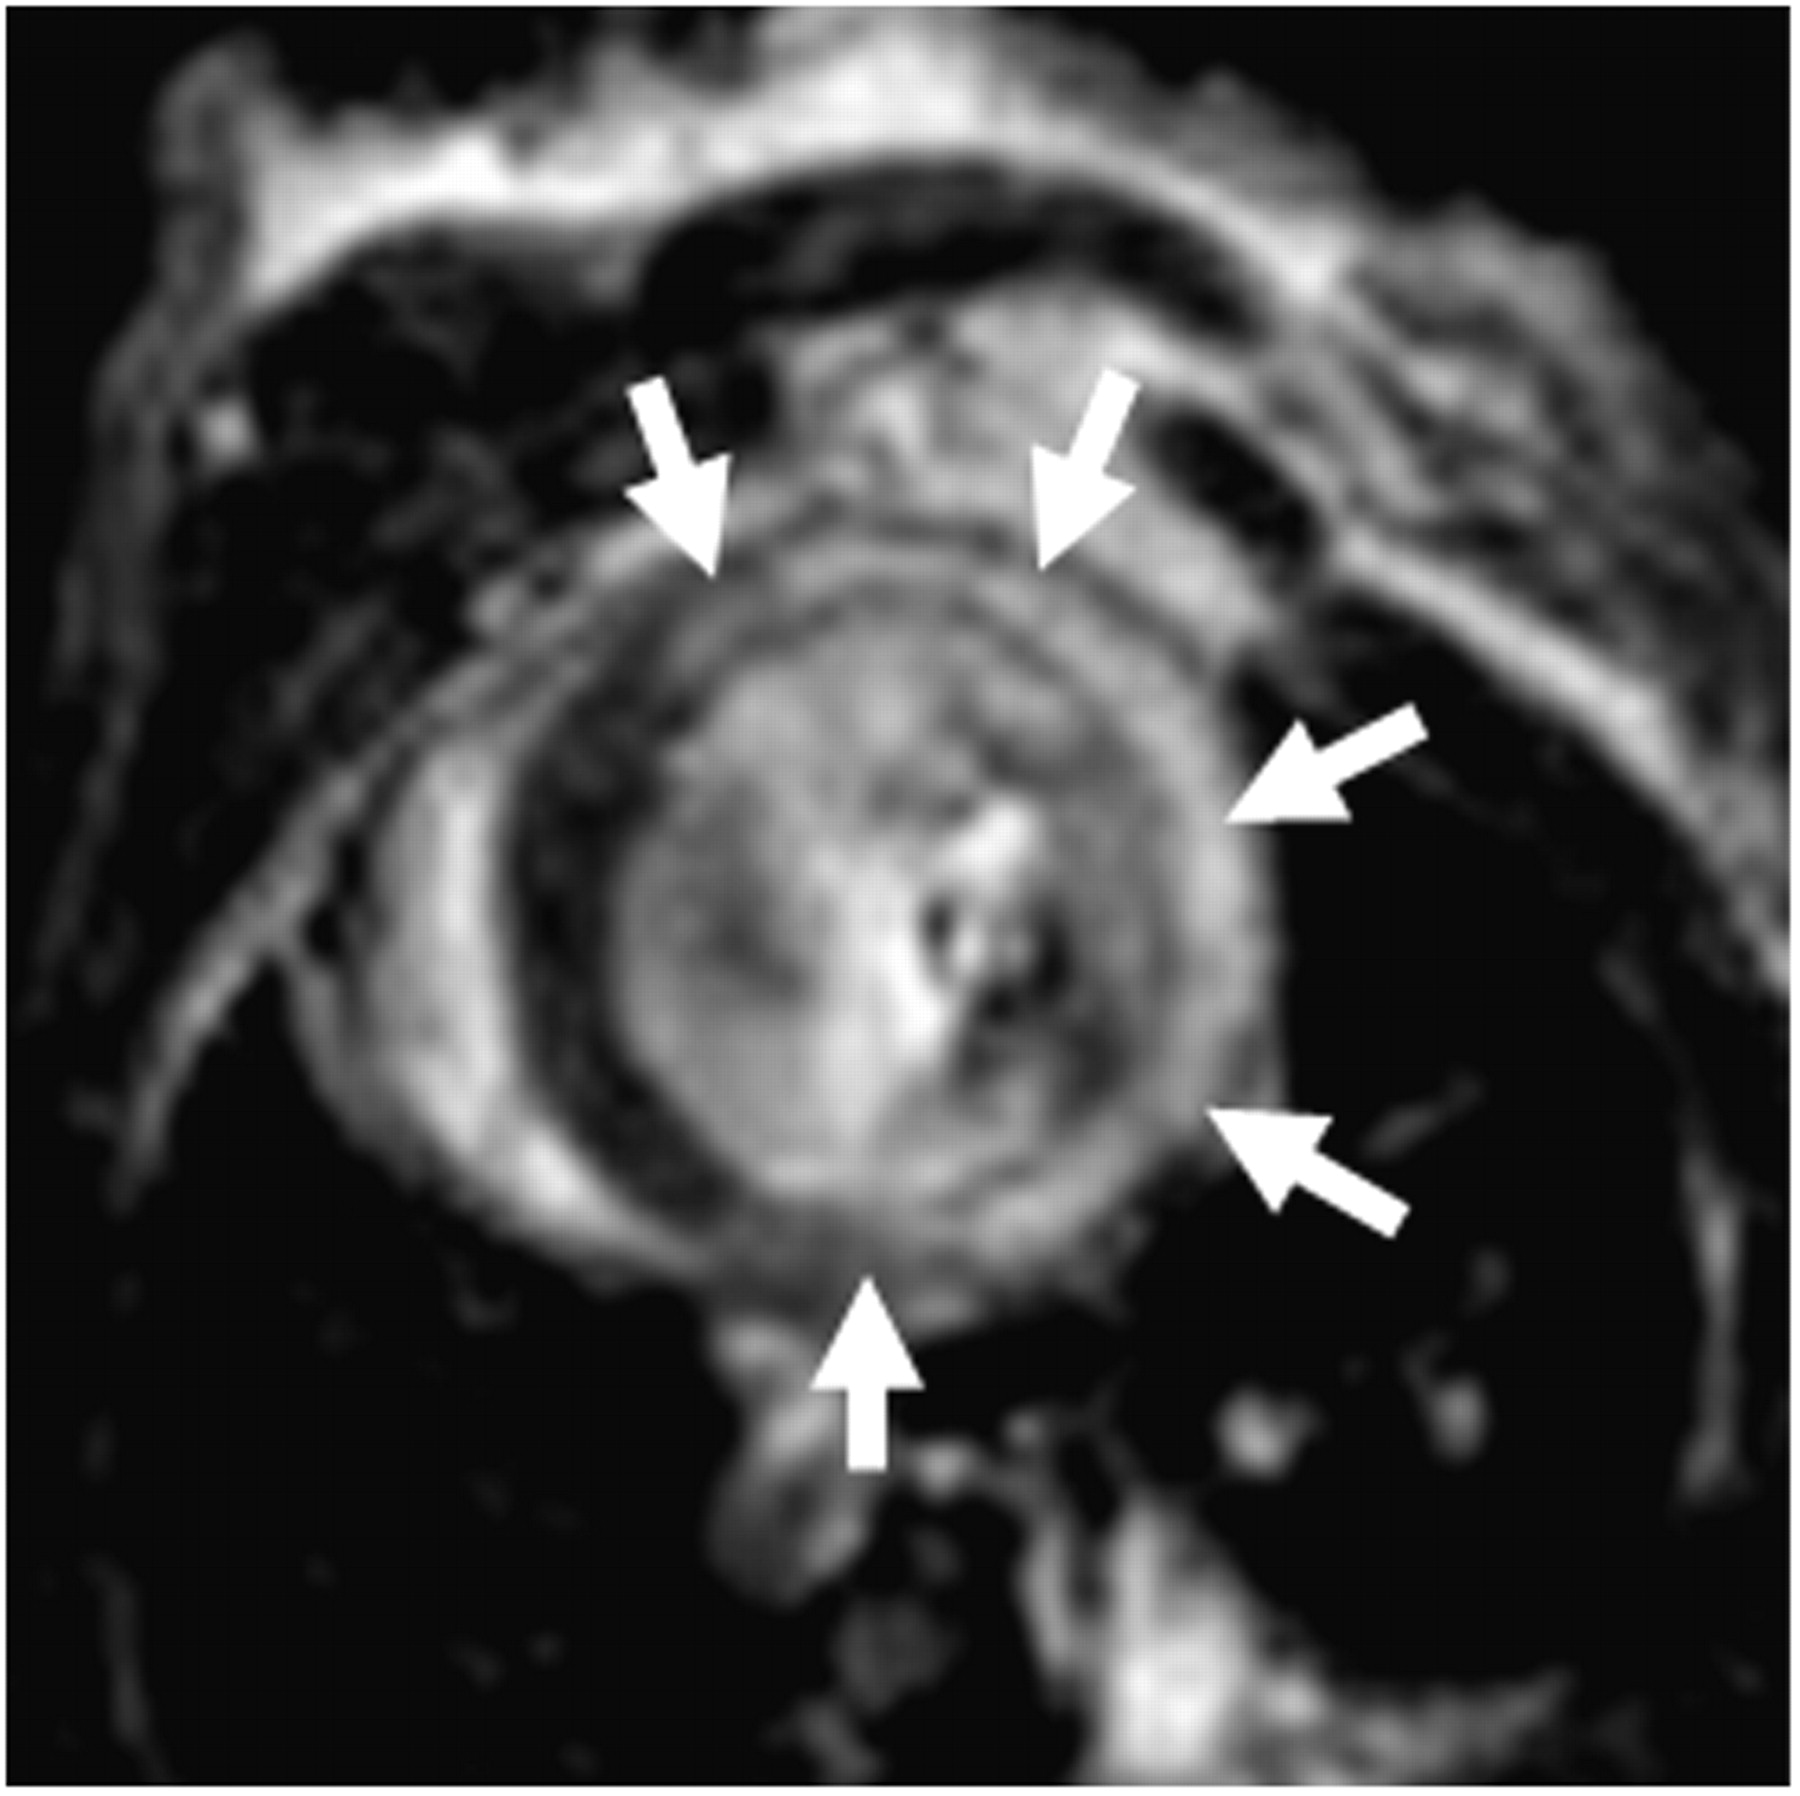
- FIGURE 7.
Gadolinium-enhanced inversion-recovery T1-weighted MR image of mouse heart 1 d after induction of experimental myocardial infarction. Hyperintense region delineates infarcted tissue (arrows). Such images can be used to define infarcted, adjacent, and remote zones. Also, multislice datasets that cover entire left ventricle can accurately assess infarct size.
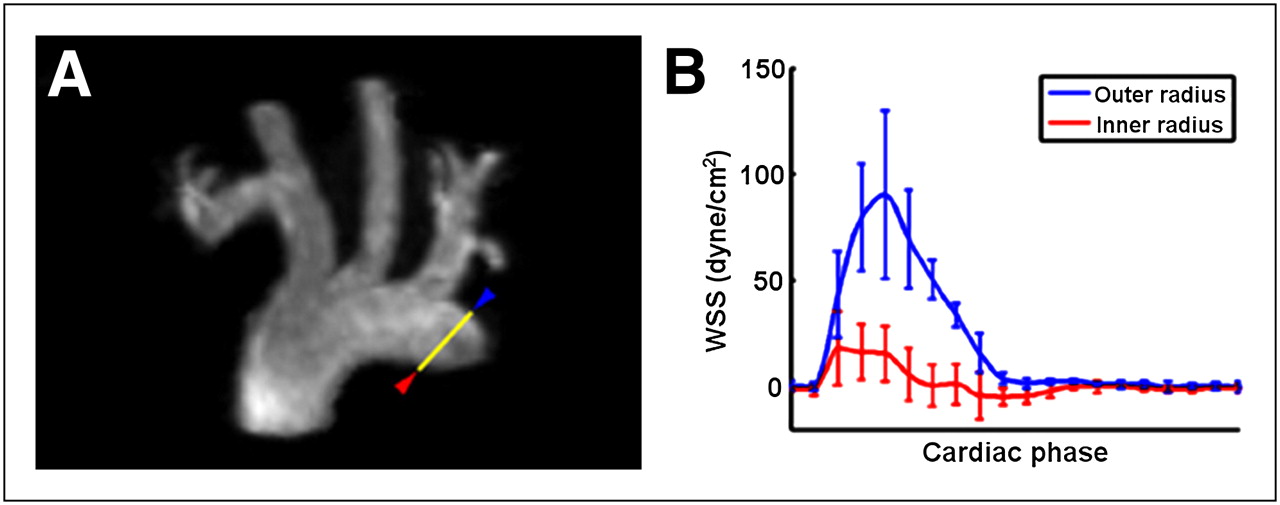
- FIGURE 8.
(A) 3D MRA maximum-intensity projection of aortic arch. Yellow line represents measurement plane for phase-contrast imaging, red arrowhead indicates inner radius of aortic arch, and blue arrowhead indicates outer radius. (B) Wall shear stress (WSS) as function of cardiac phase for inner and outer radii for 5 mice.
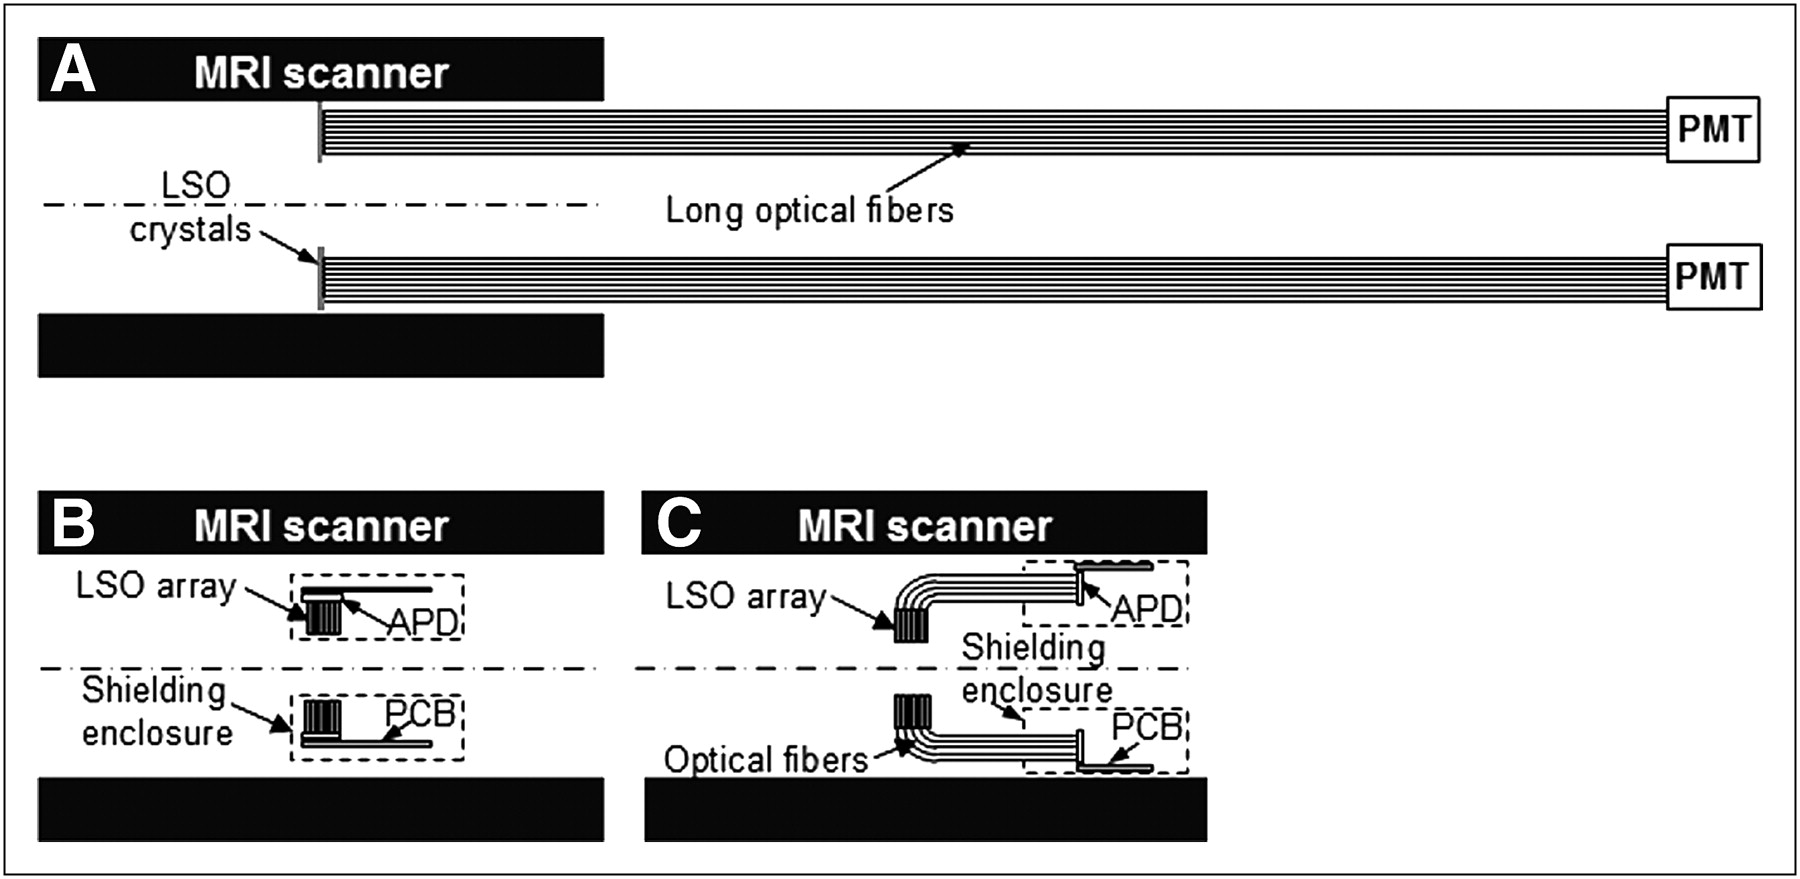
- FIGURE 9.
Different approaches to combined PET/MRI. (A) Long optical fibers used to couple scintillators to PMTs residing outside magnet. (B) APDs coupled directly to scintillator elements. (C) Scintillators coupled through short optical fibers to APDs. In all cases, scintillators are centered axially in MRI field of view. LSO = lutetium oxyorthosilicate; PCB = printed circuit board.
- FIGURE 10.
(A) Fibrin-targeted contrast agent (EP-2104R) consisting of 11-amino-acid peptide functionalized with 2 GdDOTA-like moieties at both C and N termini of peptide. (B) Bright-spot thrombus MRI with fibrin-targeted contrast agent in rat stroke model. Clot in internal carotid and middle cerebral arteries was visualized (arrows). Image was provided courtesy of Peter Carvavan, A.A. Martinos Center for Biomedical Imaging, Massachusetts General Hospital.
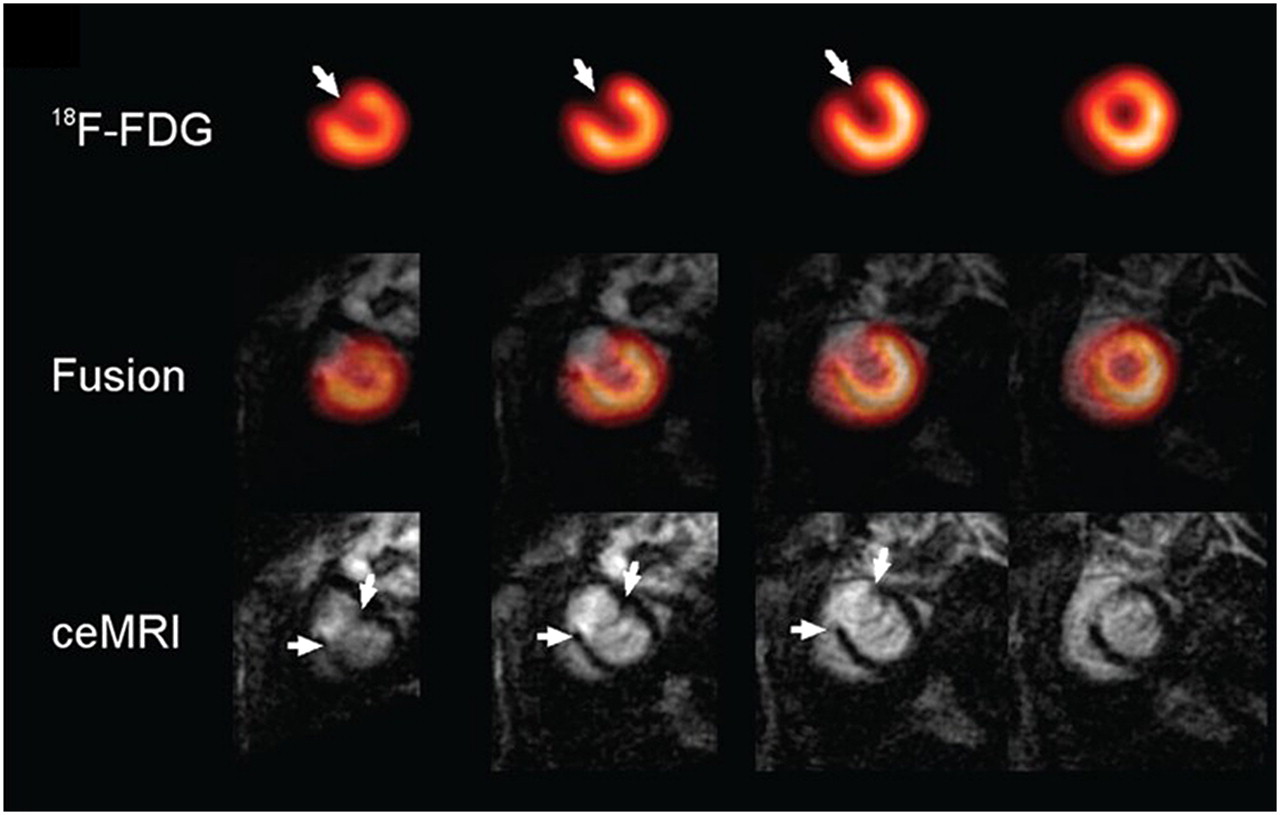
- FIGURE 11.
Sequentially acquired PET and MRI data in myocardial infarction rat model. Decreased 18F-FDG uptake area in anterior wall correlates with hyperenhancing region demonstrated by contrast-enhanced MRI (ceMRI) study (arrows). Short-axis images are shown from apex (left) to base (right). (Reprinted from (96).)
- FIGURE 12.
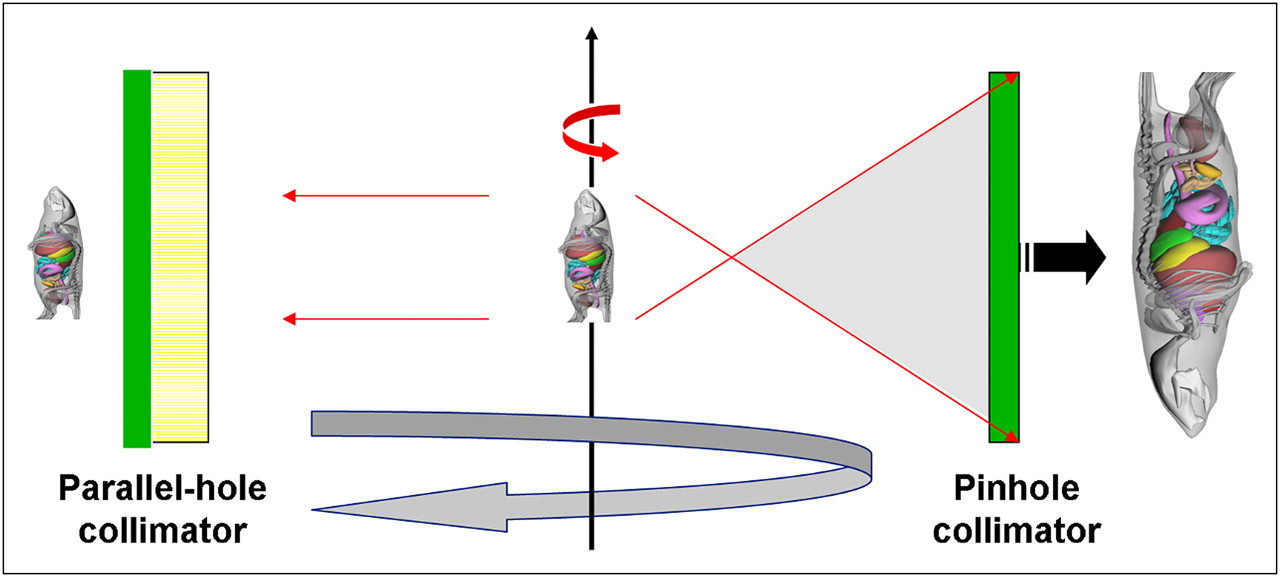
Comparison of imaging geometries of conventional parallel-hole collimator and pinhole collimator in preclinical imaging of small animals. Through magnification of small object at short distance onto large detector area, pinhole collimation geometry offers substantial increase in detection efficiency over that offered by parallel-hole collimation geometry, and spatial resolution is determined by size of pinhole aperture.
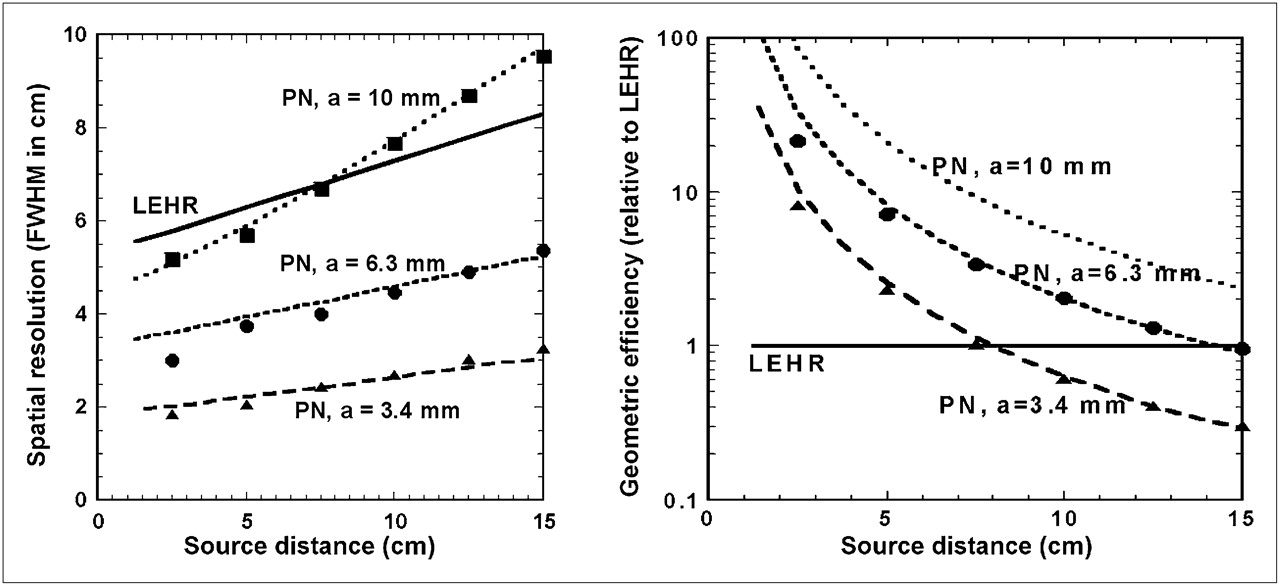
- FIGURE 13.
(Left) Comparison of spatial resolution of typical low-energy, high-resolution (LEHR), parallel-hole collimator with that of 3 pinhole (PN) collimators with different pinhole apertures as function of source distance. a = aperture size; FWHM = full width at half maximum. (Right) Comparison of geometric efficiency of same collimators as function of source distance. Graphs show advantages of pinhole collimation over parallel-hole collimation for imaging of small animals at short distance.
- FIGURE 14.
Multipinhole collimation geometry, in which projections of common field of view (indicated by circle defined by intersects of 3 projections) share same detector area without overlap. Increased number of projections provides increased geometric detection efficiency. However, geometry detection efficiency from each pinhole aperture is lower than that of single-pinhole collimation, in which entire detector area can be used with high magnification.
- FIGURE 15.
Transaxial images at end-diastole from gated myocardial perfusion micro-SPECT study of rat. Animal was injected with approximately 185 MBq of 99mTc-sestamibi and imaged by use of dual-detector Gamma Medica-Ideas XSPECT system in which each detector was fitted with single-pinhole collimator with 1-mm-diameter aperture. Total acquisition time was 20 min, and reconstructed images were postprocessed by use of Butterworth filter with cutoff frequency of 0.1 cycle per voxel and order of 8. Images indicate ability of micro-SPECT system to clearly delineate myocardium showing normal perfusion.
- FIGURE 16.
(Row A) Sample transaxial reconstructed images from gated myocardial perfusion micro-SPECT study of rat from Figure 15 by 3D pinhole filtered backprojection image reconstruction method and postprocessing with Butterworth filter with order of 8 and, from left to right, cutoff frequencies of 0.5, 0.15 and 0.1 cycles per voxel respectively. (Row B) Images from same transaxial slice as in row A by iterative 3D OSEM pinhole image reconstruction method without any correction and, from left to right, at 2, 5, 8, and 11 iterations, and postprocessing with Butterworth filter with order of 8 and cutoff frequency of 0.1 cycle per voxel. (Row C) Image from same transaxial slice as in row A by iterative 3D OSEM pinhole image reconstruction method with correction of geometric response of pinhole collimator at 2, 5, 8, and 11 iterations. Images demonstrate effectiveness of corrective pinhole image reconstruction methods in improving reconstructed image quality in terms of improved image resolution without noise amplification. (Reprinted with permission of (61).)
- FIGURE 17.
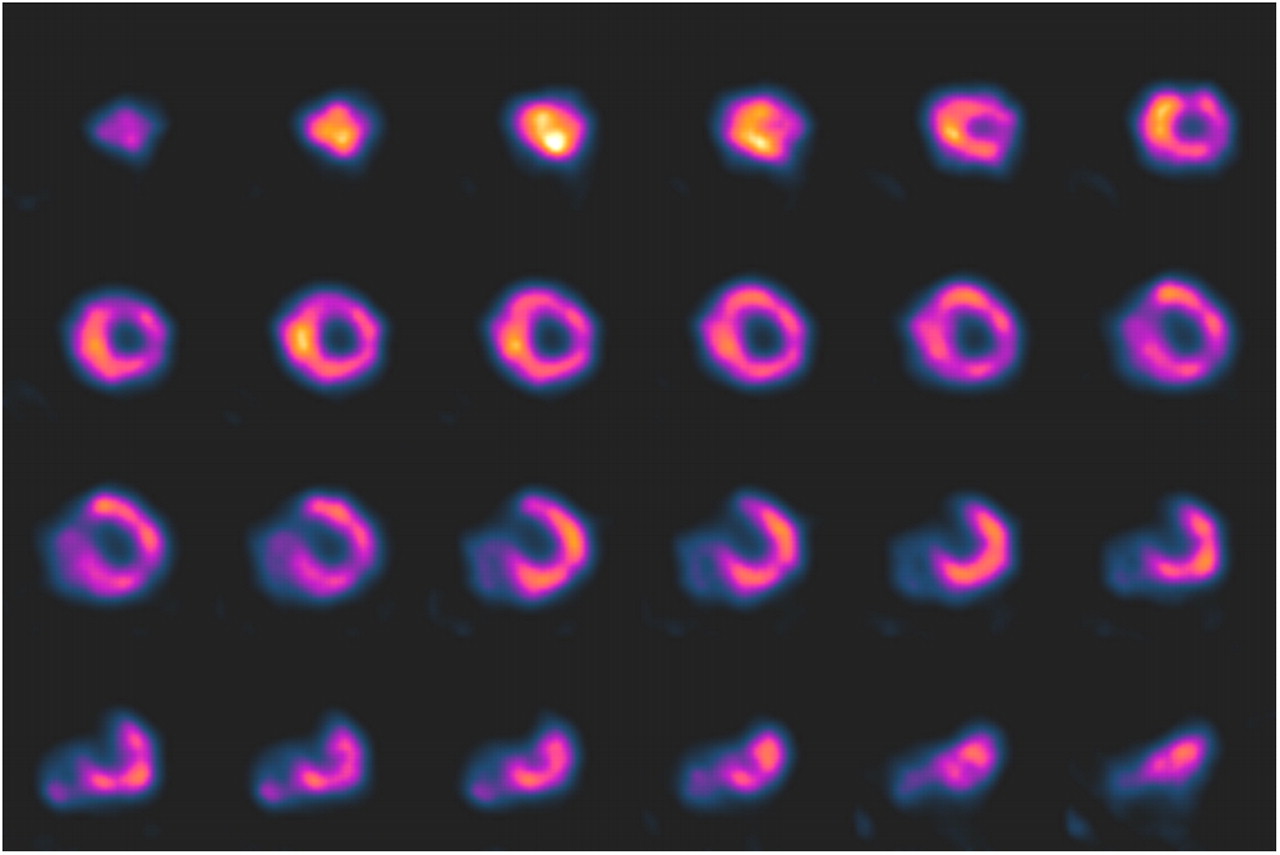
Sample ultrahigh-resolution 99mTc-tetrofosmin SPECT images of mouse heart in end-diastole (left) and end-systole (right) showing myocardial perfusion in fine detail, such as in papillary muscles and right ventricular wall. Male C57BL/6 mouse (30 g) was injected intravenously with 190 MBq of 99mTc-tetrofosmin and anesthetized with ketamine–medetomidine–atropine. At 45 min after injection, mouse was imaged for 1 h by use of U-SPECT-II system with 0.6-mm-diameter pinhole inserts. During image acquisition, electrocardiogram trigger signal was acquired (using BioVet from m2m Imaging Inc.) and incorporated into list-mode data. Sixteen-gate reconstruction was performed. Image data were provided courtesy of Freek J. Beekman, currently at Delft University of Technology and MILabs. (Reprinted with permission of (68).)
- FIGURE 18.
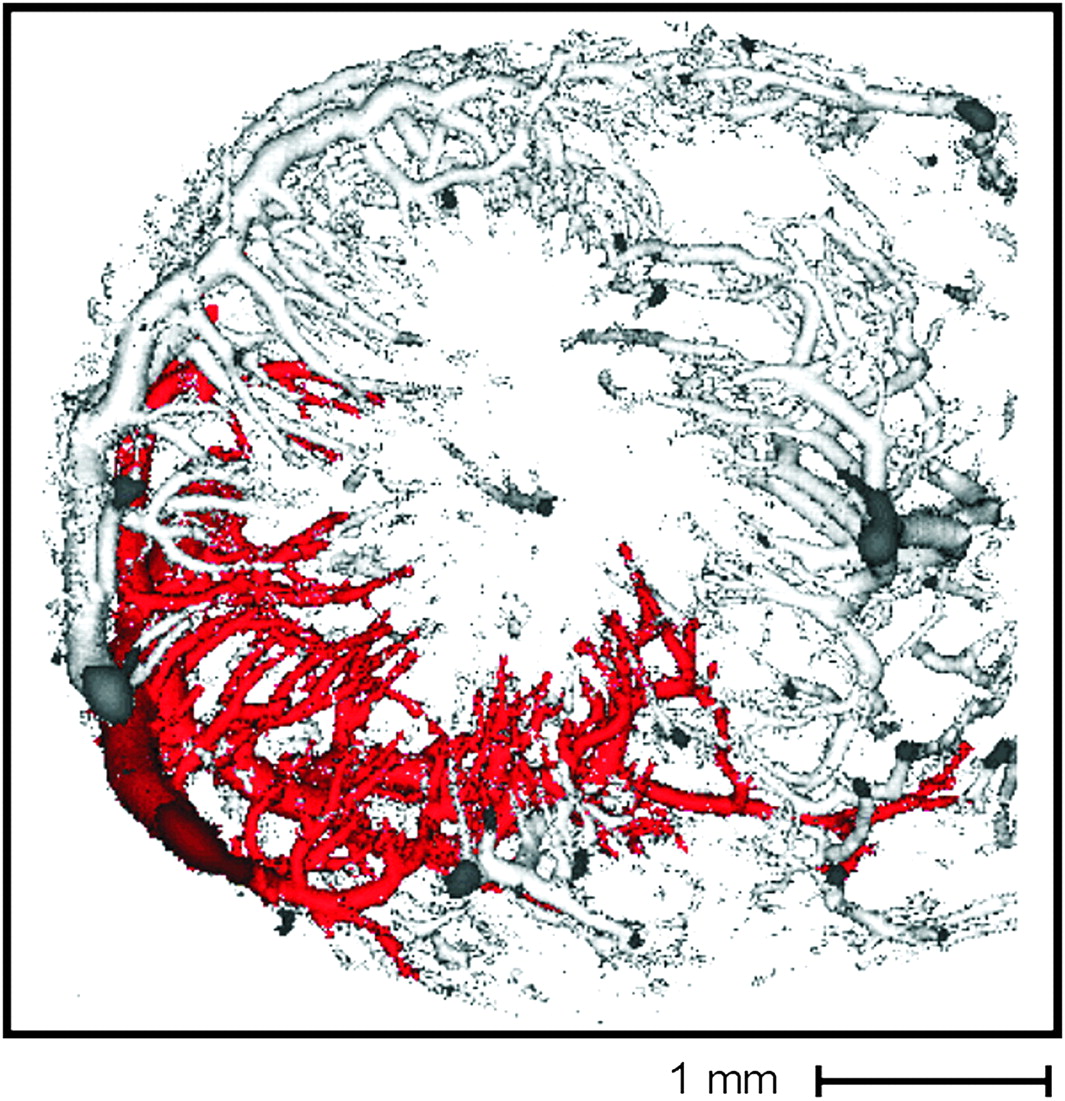
Volume-rendered display of 3D micro-CT image of coronary arteries of mouse heart wall. Single arterial tree is highlighted in red. Image was provided courtesy of Ghassan S. Kassab, Indiana University Purdue University.
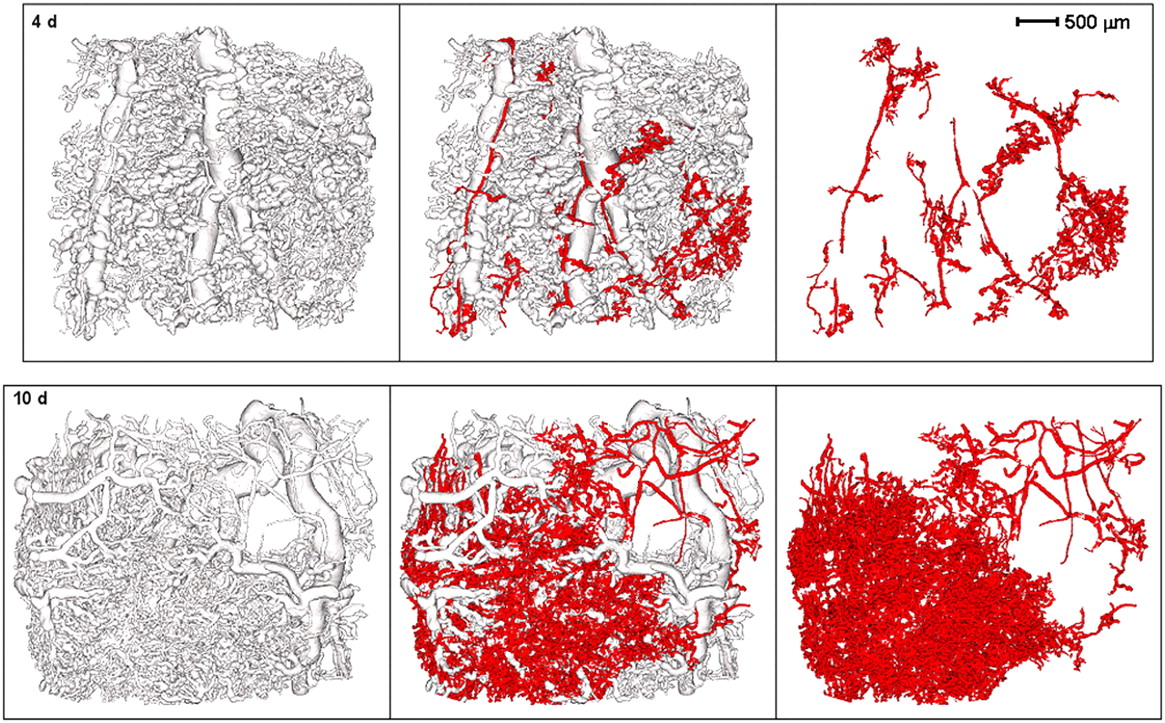
- FIGURE 19.
Volume-rendered displays of contrast agent–filled microvasculature in mouse ear. (Top) Vessels at 4 d after local injection of vascular endothelial growth factor. Red vessels were all smaller than 60 μm in diameter. (Bottom) Mouse ear 10 d after local injection of vascular endothelial growth factor. Note large increase in highlighted small vessels. Images were provided courtesy of Dr. Janice A. Nagy, Beth Israel Deaconess Medical Center.
- FIGURE 20.
(Left) Micro-CT image of transverse section through mouse lower thorax and upper abdomen. Contrast agent filled major blood vessels and stomach. Blood vessels contained iodine-based contrast agent, and stomach contained barium-based contrast agent. (Right) Color coding showing locations of barium and iodine contrast agents. Multienergy x-rays allowed discrimination of iodine, barium, and normal tissues (green). (Reprinted with permission of (97).)
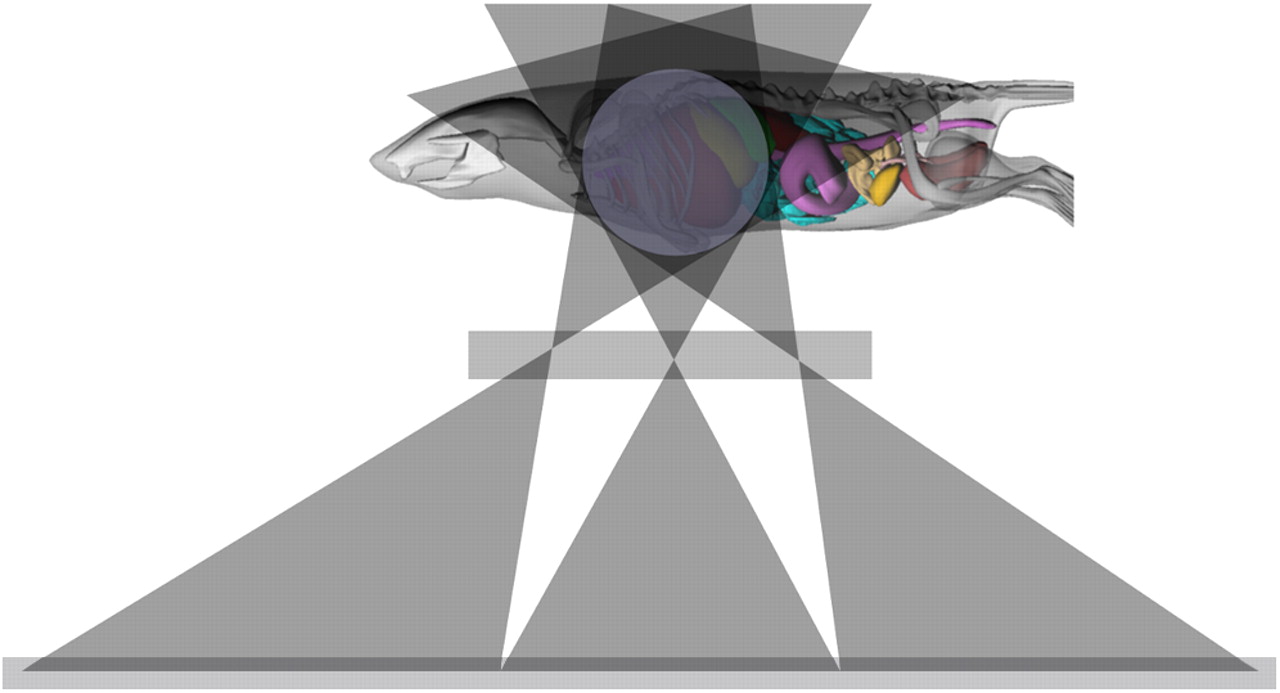
- FIGURE 21.
(Left) CT image of test phantom used to evaluate coherent x-ray scatter image contrast of various polymers. (Middle) Same tomographic slice generated from coherent scatter of 17.5-keV x-ray beam at 12.2° from illuminating beam. (Right) Same tomographic slice generated from coherent scatter at 22 keV and 7.3°. Note removal of contrast of polymers with illuminating energy. Coherent scatter images were blurred in top-to-bottom direction because phantom was scanned at 300-μm increments in that direction, whereas regular CT scan was isotropic at 20-μm voxel resolution.


Jump to section
Related Articles
Cited By...
- Ex vivo high-resolution nano-computed tomography imaging reveals spatial architecture of the adult male mouse lower urogenital tract
- Critical Review--Recent Progress in NIR Fluorophores Emitting over 1000 nm for Bioimaging
- An Integrated Quad-Modality Molecular Imaging System for Small Animals
- A View on Imaging in Drug Research and Development for Respiratory Diseases