


Among the many applications of PET to neuroimaging research, the determination of the percentage of receptors occupied by an exogenously administered drug stands out for the immediate and practical information that can be derived from one or a small number of studies (1). Knowledge of the dose–occupancy relationship, derived in vivo in humans, informs the calculation of drug doses, introducing a rational, quantitative approach to what otherwise might be a trial-and-error process. This information can be used, for example, to choose doses for clinical trials that lead to occupancy See page 1021
within an established therapeutic window—a range of occupancies that are efficacious while minimizing side effects—or to establish such a range when it has not previously been characterized (2,3). The approach has been especially useful for examining drugs that block central nervous system targets of interest for psychiatry such as the serotonin transporter (4–8) and dopamine D2 receptor (9–14) and has been used to characterize drug occupancy at many other target molecules as well.
The usual requirement to perform an occupancy study is the availability of a reversibly binding PET or SPECT radioligand with known specificity for the target, for which some variant of the binding potential (15)—a quantity proportional to the product of the receptor concentration and affinity of the radioligand for the receptor—can be derived from in vivo imaging studies. In this case, because of the assumption of a purely competitive interaction between the drug and tracer, occupancy can be estimated from the percentage change in the binding potential before and after drug administration. Several properties are usually considered necessary in a radiotracer in order for a binding potential to be derived. The radioligand needs to be synthesized with high enough specific activity to ensure tracer dose conditions—that is, that the radioligand itself needs to occupy a small fraction of receptors during the scan (typically taken to be 5% or less). The radiolabeled metabolites of the tracer need to not cross the blood–brain barrier. A reference tissue needs to exist within the brain (a tissue with background activity similar to that of the target tissue but negligible levels of the target molecule so that the nondisplaceable component of the radioligand activity in the target tissue can be estimated). Finally, the overall pharmacokinetics of the ligand need to be such that it reaches peak uptake and enters a washout phase of decreasing activity in the target tissue within a feasible imaging time (16). Satisfaction of this last requirement is limited by a combination of the decay rate of the radioisotope and endurance of the subjects being imaged; a 11C-labeled ligand may be reversible but enter the washout phase only after the radioisotope has decayed to the point at which the counting rate is not high enough for reliable quantification. To reach the washout phase, even a ligand labeled with 18F may still require more hours of scanning than patients can be expected to endure.
As this lengthy list suggests, these are demanding requirements, and research radiochemists can test hundreds of compounds over a course of years before arriving at a candidate that satisfies all the conditions. On the other hand, the intricacies of neurochemistry and neuropathology continue to be elucidated in greater detail, leading to the identification of many new molecular targets and, in turn, to new compounds from drug developers. The result can be a clash of time lines, in which there is a need for occupancy studies in the absence of an ideal imaging agent. In this setting, pharmacokinetic imaging scientists might opt to use a radioligand lacking in one or several of the desired properties, resorting either to adapting the assumptions or to using methods of analysis that are more sophisticated than usual to accommodate the limitations of the ligand. The latter approach is the one taken by Ashworth et al. in their treatment of 11C-GSK189254, a radioligand for the histamine H3 receptor, reported in this issue of The Journal of Nuclear Medicine (17). These authors used PET with 11C-GSK189254 in human volunteers both to characterize the imaging properties of the radioligand and to compute the dose–occupancy relationship of unlabeled GSK189254 binding to H3 receptors by comparing scans from before and after oral administration of the compound.
There is active interest in developing drugs targeted to the H3 receptor (18); to date, only a few brain-penetrant PET tracers have been reported (19–21), and all of them are in the early phase of development. In the course of examining 11C-GSK189254 in human subjects, Ashworth et al. (17) observed that the ligand did not reach a washout phase in brain regions where it exhibits high binding, a reference tissue does not exist, and the radioligand is so potent that it is difficult to achieve tracer dose conditions—that is, that 11C-GSK189254 does not satisfy most of the conditions mentioned here. These authors have addressed each of the observations in turn by drawing on various tools from the modeling arsenal, obtaining robust pharmacokinetic parameter estimates, even in the presence of these several limitations. Two of these techniques deserve further comment here.
THE QUESTION OF REVERSIBILITY
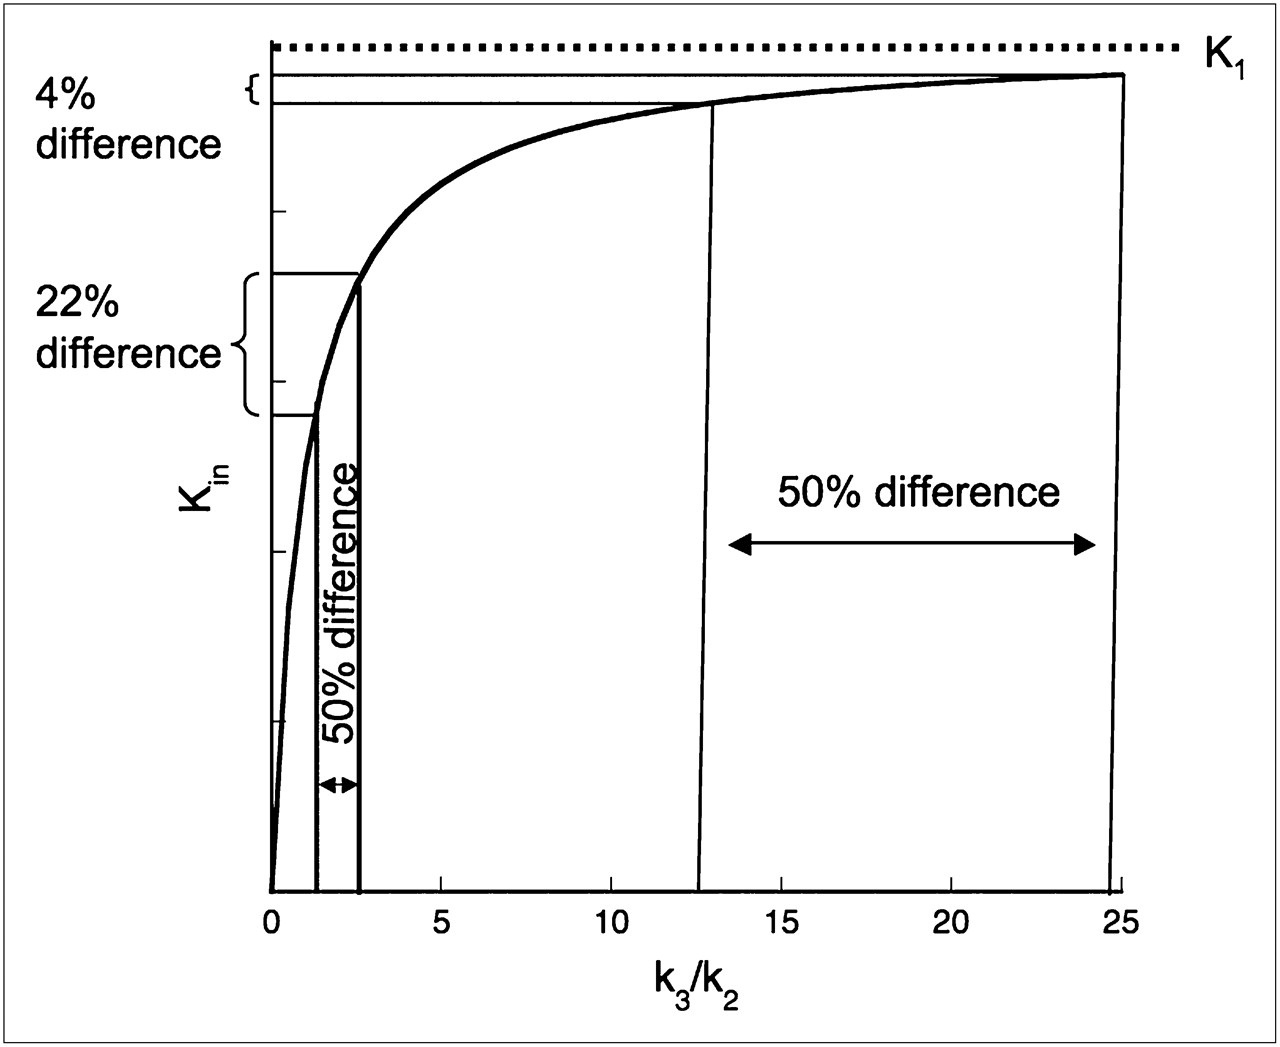
When an ostensibly reversible radioligand does not exhibit reversibility over the time course of the scanning session, one might be tempted to use an irreversible trapping model for the analysis, setting the dissociation constant koff (equivalent to k4 in compartment-model terminology) to zero and reporting the steady-state uptake rate Kin (22) as an outcome measure. However, examination of the derivation of this parameter in terms of the individual rate constants shows that this strategy may lead to results that are difficult to interpret when the process being modeled is reversible binding to receptors and the quantity of interest is receptor availability. The formula is Kin = K1k3/(k2 + k3), where K1 and k2 are the delivery and efflux rate constants of the radioligand into and out of the brain, respectively, and k3—the only receptor-related constant—is proportional to the regional receptor concentration Bmax. For fixed constant values of K1 and k2, Kin is a rectangular hyperbola with respect to k3 (Fig. 1). Kin is not proportional to Bmax and will saturate, approaching the constant value K1 when k3 becomes large relative to k2 (Fig. 1). In a different context, such as metabolic process modeling, the 2 terms K1/(k2 + k3) and k3 are interpreted differently from how they are for receptor binding. The first term is indicative of the rate at which the radioligand is made available to the trapping process, and k3 is the rate constant for conversion to the trapped form. Their product is the overall rate of metabolic trapping, irrespective of the contribution of the individual factors. In the setting of receptor binding, the interpretation is less clear. For large k3/k2, differences in Kin across regions having different Bmax or within regions across experimental conditions will not reflect true k3 differences. In particular, percentage changes in Kin before and after drug administration may not accurately reflect receptor occupancy by the drug.

Steady-state uptake rate Kin as function of k3 when K1 and k2 are fixed at constant values. Receptor parameter k3 is expressed in k2 units. Graph demonstrates that 50% decrease of k3 from 2.5 to 1.25 k2 units results in 22% decrease in Kin, whereas 50% decrease from 25 to 12.5 k2 units leads to only 4% decrease in Kin.
As an alternative, one might consider estimating k3 directly, using, for example, nonlinear least squares to fit the data to the irreversible model and obtain the individual rate constants K1, k2, and k3. But individual rate constants tend to be less reliably estimated than macroparameters such as total distribution volume (VT) or Kin (23,24). Another alternative might be to estimate K1 and VND, the nondisplaceable distribution volume, separately and then extract k3 from Kin algebraically using the equivalence of VND and K1/k2. However, this estimation still requires the existence of a reference tissue, and reports dating from the early years of PET pharmacokinetic modeling of 18F-FDG uptake in the brain have suggested that estimation errors can be incurred when small, but nonzero k4 is fixed to zero in the data-fitting model (25,26).
Ashworth et al. (17) have taken a different approach to this problem by applying a reversible 2-tissue-compartment model to the data but constraining k4 (and K1/k2) to be the same across all brain regions, allowing the estimation procedures in the high-binding regions to benefit from those in low-binding regions (where there is more washout and off-rate estimates are more reliable). This approach allows measurement of VT (expressible in terms of the rate constants as K1/k2[1 + k3/k4]). VT is the equilibrium ratio between total radioligand concentration in a brain region and concentration in arterial plasma and is more conceptually in accord with the process being modeled than Kin measured with the irreversible trapping approach, albeit obtained in this case at the cost of a slightly more complicated fitting procedure than usual. VT is an affine function of Bmax—a line with the nonzero intercept VND. If VND can be determined, then binding potentials, either BPP or BPND, equal to K1k3/k2k4 or k3/k4, respectively, can be estimated as VT – VND or VT/VND − 1. There are 2 methods for directly measuring VND: either by measuring VT in all brain regions under complete receptor blockade conditions or by estimating VND as VT under baseline conditions in a reference tissue with negligible receptor concentration. The former is not usually feasible in human subjects because of safety concerns, and the latter—unfortunately in this case—was not available either, leading to the need for another approach to estimate occupancy.
ABSENCE OF REFERENCE TISSUE
For 11C-GSK189254, awareness of the lack of a reference region came about with the observation that in the cerebellum (the brain region with lowest VT and the best candidate as a reference tissue), 11C-GSK189254 showed dose-dependent decreases in VT in response to unlabeled oral doses of GSK189254 in pigs (19). These decreases indicated the presence of detectable specific binding. To address this issue, a graphical approach to occupancy estimation was used (27,28). This method was originally suggested by Lassen in 1992 (28) but has received little attention in the intervening years. The analysis requires only that regional distribution volumes, not binding potentials, be measured to estimate occupancy by comparisons before and after drug administration. The derivation of this occupancy estimation method follows directly from the representation of occupancy as the percentage change in binding potential, making use of the decomposition of VT as the sum of the VND and the binding potential with respect to the arterial plasma concentration of the radioligand, BPP:
If statistical error is ignored, and the only mechanism at work is binding competition between the radioligand and unlabeled compound, the final equation is identically true in each region. Assuming that occupancy is the same in all brain regions, plus the standard assumption that VND is the same across regions as well, occupancy and VND can then be estimated by application of linear regression to VT (baseline) – VT (drug condition) vs. VT (baseline). Ashworth et al. (17) apply this analysis to estimate both the oral dose and the plasma concentration of GSK189254—which itself is a potent H3 antagonist—required for 50% occupancy of the available receptor sites. However, the method could also be applied to heterologous binding with another drug.
CONCLUSION
Receptor-binding radioligands that lack one or several of the pharmacokinetic properties conducive to conventional quantification present challenges to kinetic modelers, forcing them to seek creative solutions to parameter estimation. Most modelers, if pressed on the question, would probably concede that a well-behaved radioligand that does not require special treatment is preferable to one that forces them to delve into their repertoire of corrective procedures. But sometimes, addressing the pharmacokinetic shortcomings of a tracer is unavoidable. Ashworth et al. (17) demonstrate a particularly noteworthy approach for one such case.
Footnotes
-
COPYRIGHT © 2010 by the Society of Nuclear Medicine, Inc.
References
- Received for publication February 19, 2010.
- Accepted for publication March 5, 2010.


Jump to section
Related Articles
Cited By...
- No citing articles found.