


Article Figures & Data
Figures
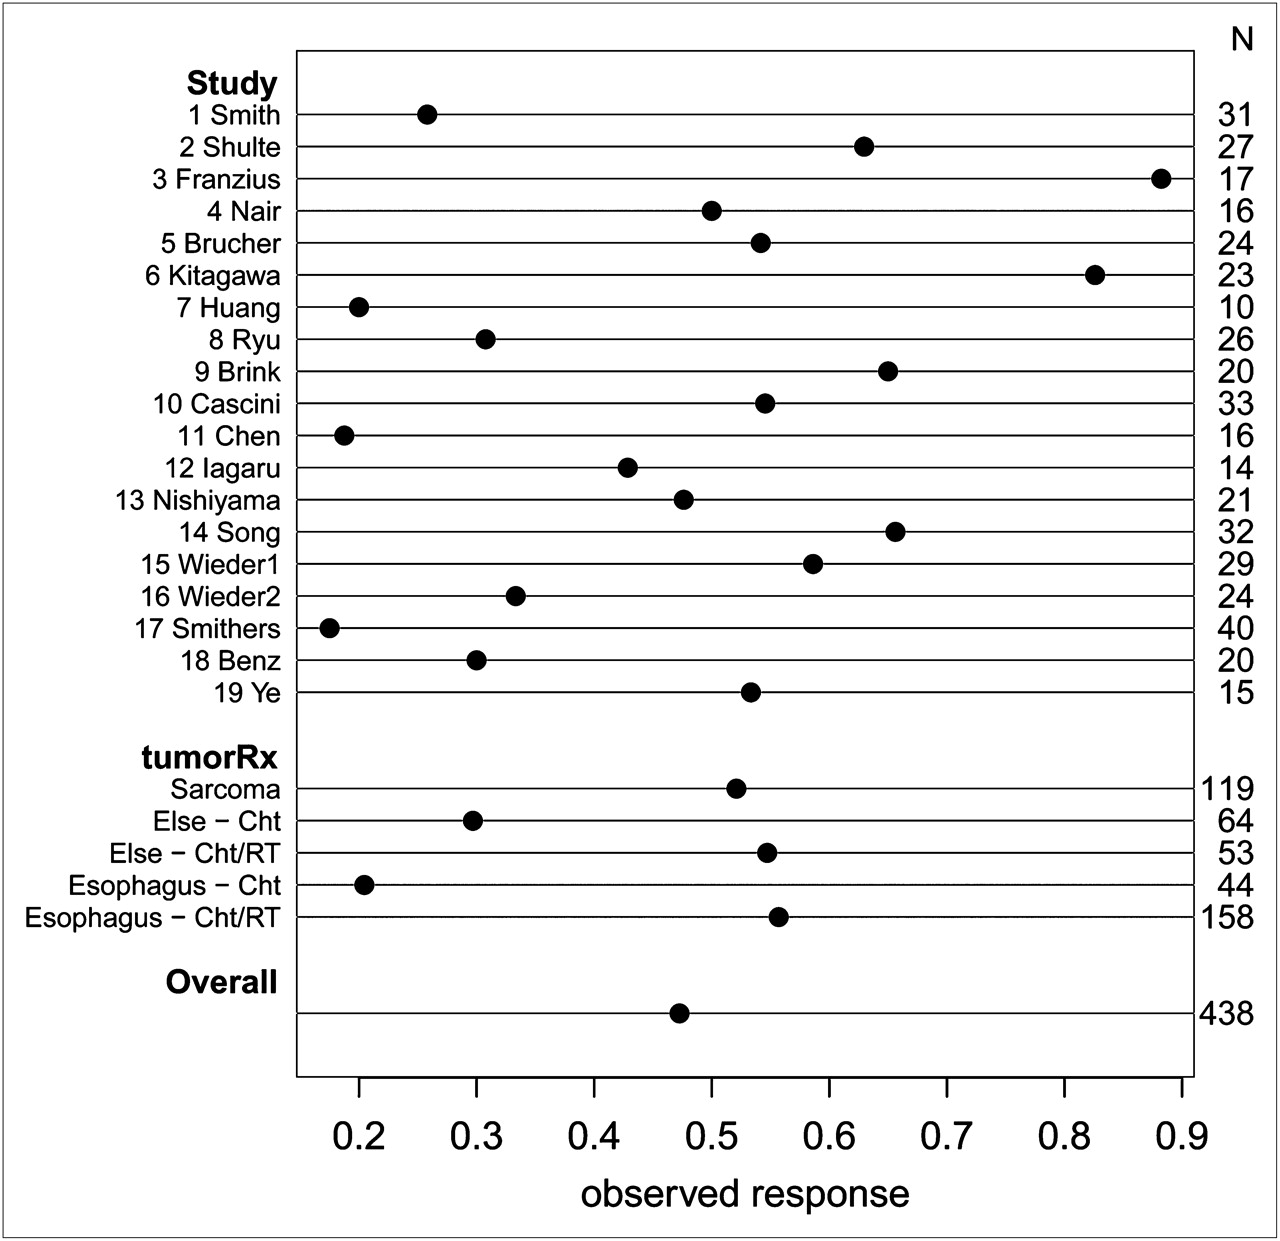
- FIGURE 1.
Overview of response rates in 19 eligible studies. TumorRx indicates combination of tumor type (sarcoma, esophagus, or other types) and therapy (chemotherapy [ChT] or chemoradiotherapy [ChT/RT]). Sarcoma was exclusively treated by chemoradiotherapy. Tumor-treatment combination mostly explains heterogeneity between studies with respect to factors explaining response.
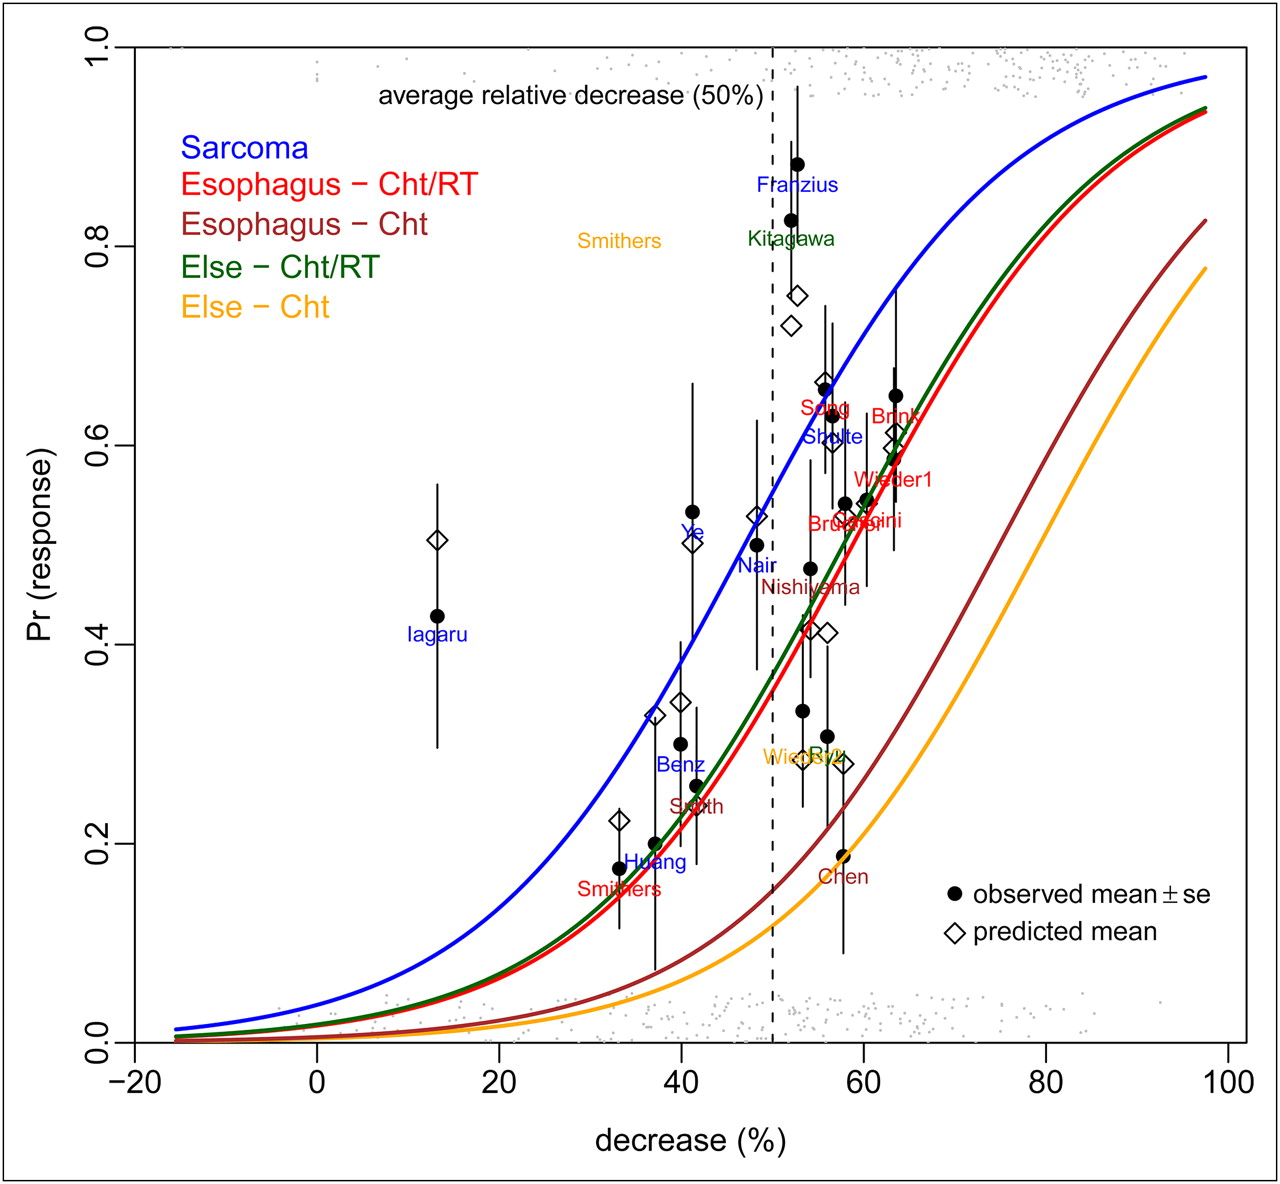
- FIGURE 2.
Logistic regression estimating histopathologic response rate (Pr [response]) as function of linear predictor of decrease in 18F-FDG uptake (decrease [%]), tumor type, and therapy (indicated by colored lines). Black circles indicate actual average histopathologic response rates per study, whereas open diamonds represent point estimates of response rate. Gray dots at bottom (no response) and top (response) show actual individual patient data. At mean level of baseline (for each tumor-therapy group), model suggests that 10% decrease in relative difference corresponds to 17% increase in pathologic response rate. Cht = chemotherapy; ChT/RT = chemoradiotherapy.
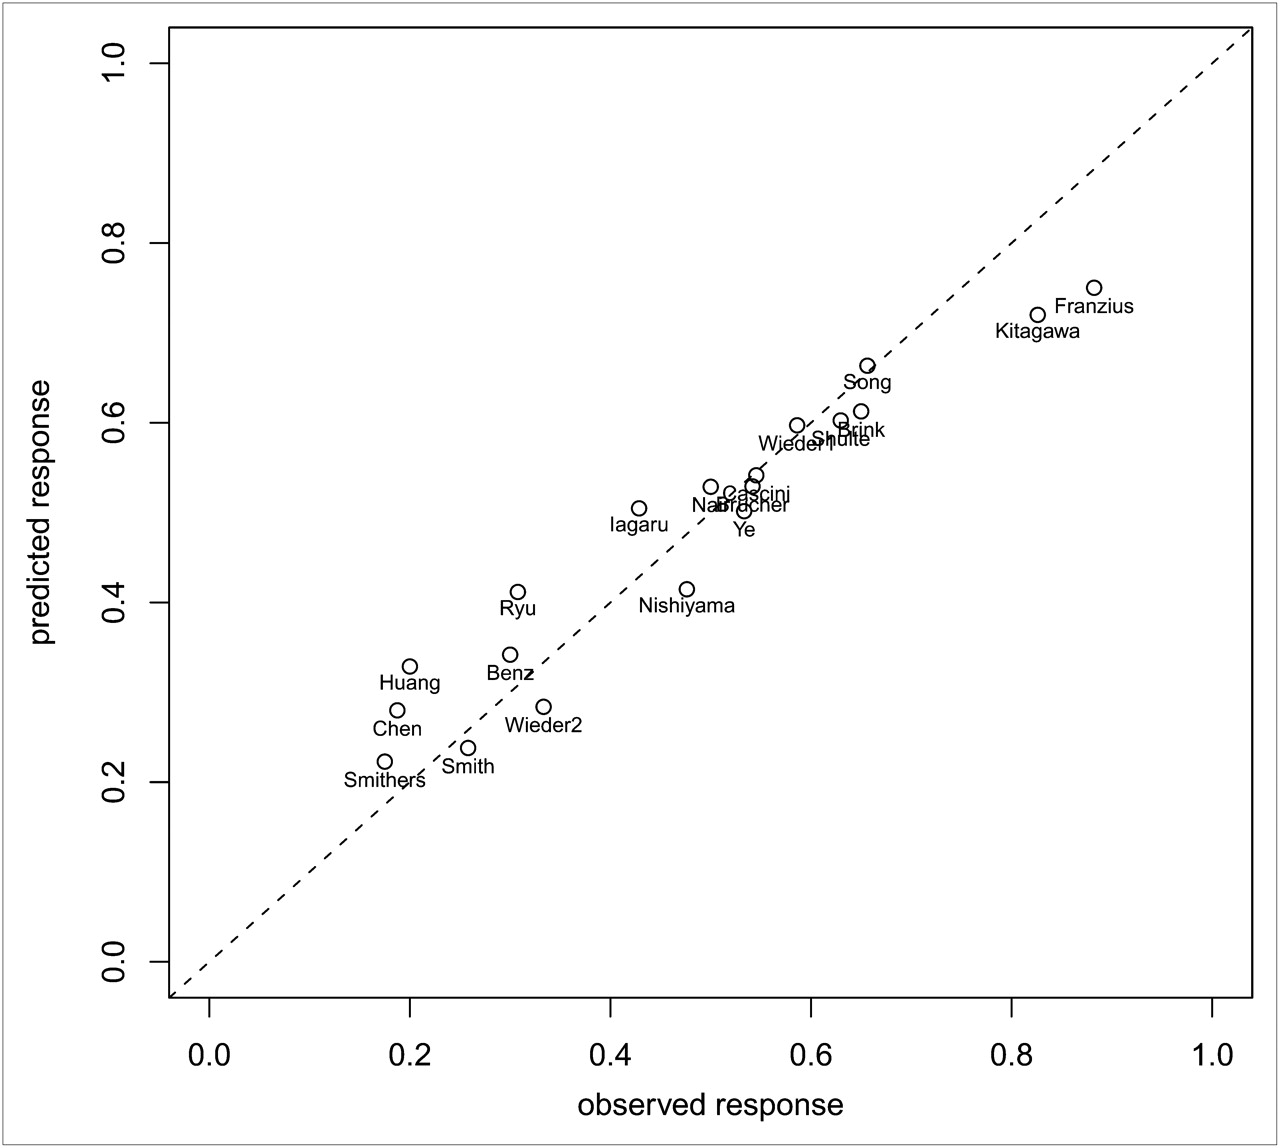
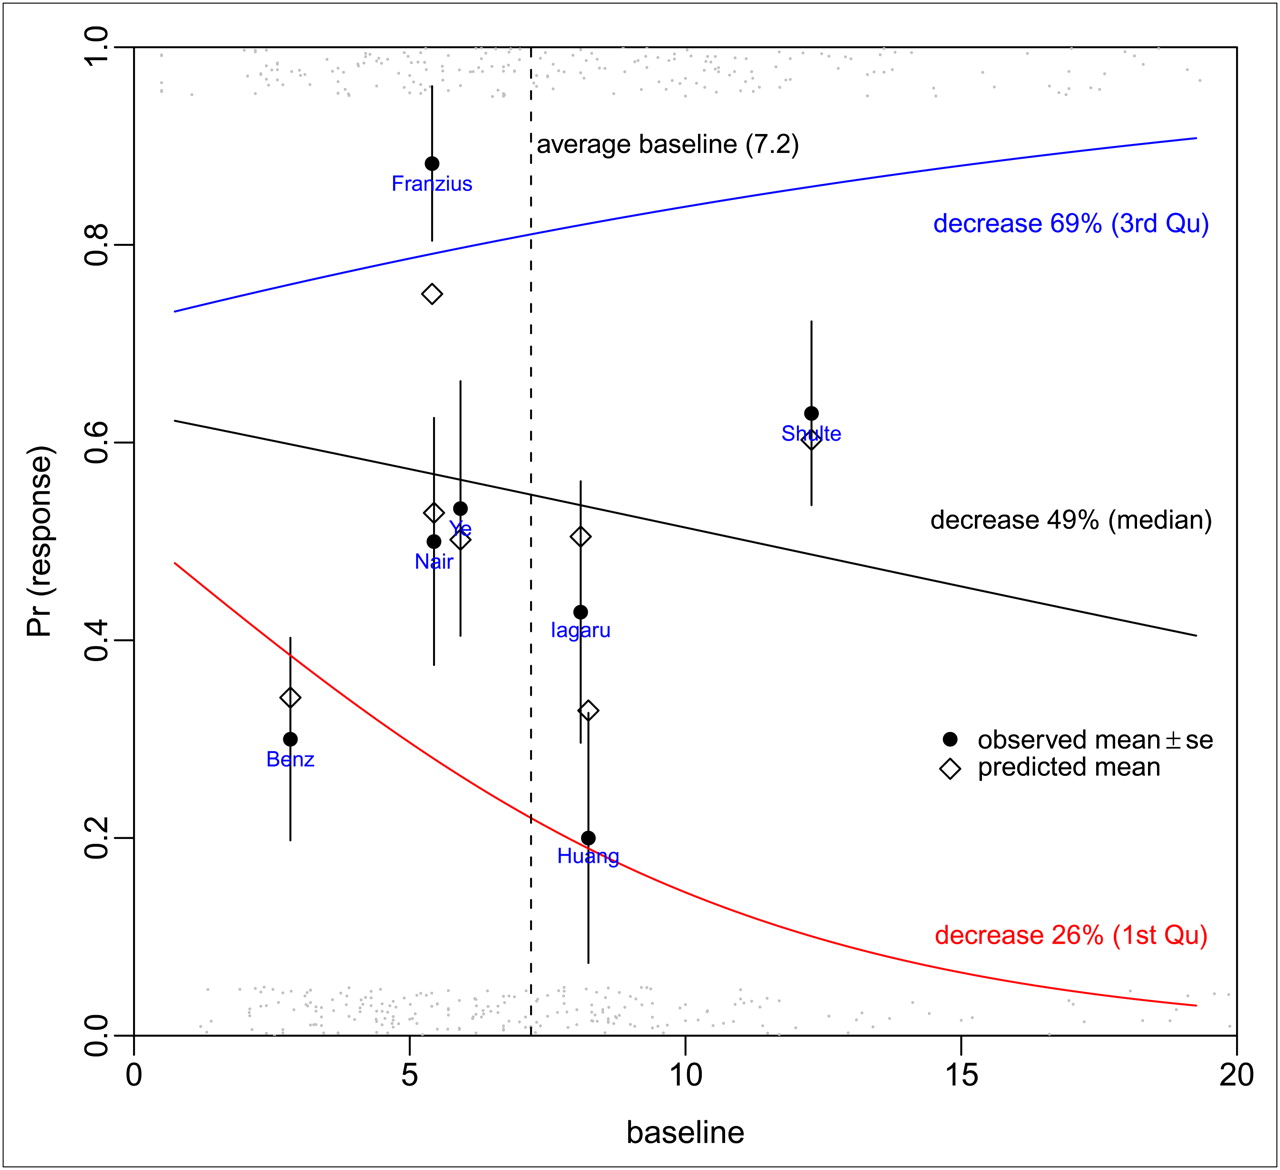
- FIGURE 3.
Predicted and observed response rate of all 19 studies based on multilevel model with change in 18F-FDG uptake, baseline 18F-FDG uptake, tumor type, and treatment.
- FIGURE 4.
Logistic regression estimating response rate (Pr [response]) as function of linear predictor of baseline 18F-FDG uptake at 3 different percentiles of relative decrease (25th, 50th, and 75th percentiles) in 18F-FDG uptake at end of treatment (indicated by colored lines). Black circles indicate actual average response rates, and open diamonds represent point estimates of response rate of studies in sarcoma. Gray dots at bottom (no response) and top (response) show actual individual patient data. Figure clearly shows interaction between level of decrease and baseline 18F-FDG uptake.


Tables
Total no. of patients in analysis Age (y) No. of lesions or patients included in meta-analysis Neoadjuvant therapy Study Design Mean Range Sex* Tumor type Type Amount of cycles Schulte et al. (5) Prospective 27 17 5–36 17 27 Osteogenic sarcoma Chemotherapy Franzius et al. (6) Retrospective 17 13 5–36 13 17 Osteosarcoma (n = 11) Chemotherapy 4–6 Ewing's sarcoma (n = 6) Chemoradiotherapy in 5 cases of Ewing's sarcoma Smith et al. (7) Prospective 30 49 31–72 0 31 Breast cancer Chemotherapy 8 Nair et al. (8) Unclear 16 17 15–29 8 15 Osteosarcoma Chemotherapy 3 Brücher et al. (9) Prospective 27 52.9 (±6.1) 37.8–61 23 24 Esophageal squamous cell carcinoma Chemoradiotherapy 12 continuous days Ryu et al. (10) Prospective 26 62 47–73 15 26 Non–small cell lung cancer Chemoradiotherapy 2 Kitagawa et al. (11) Prospective 23 63.8 47–85 18 23 Head and neck carcinoma Chemoradiotherapy 2 Brink et al. (12) Prospective 20 53.7 (±9.5) Not mentioned 17 20 Esophageal carcinoma Chemoradiotherapy 4 Chen et al. (13) Retrospective 15 44 32–56 0 16 Locally advanced breast cancer Chemotherapy Unclear Wieder et al. (14) Unclear, consecutive 38 60 (±6.8) Not mentioned 27 29 Esophageal squamous cell carcinoma Chemoradiotherapy 28 d Song et al. (15) Prospective 74 63 45–74 29 32 Locally advanced esophageal cancer Chemoradiotherapy 3 Cascini et al. (16) Prospective 33 58 29–74 20 33 Locally advanced rectal cancer Chemoradiotherapy 3 Huang et al. (17) Prospective 10 19 4–47 8 10 Primary osteosarcoma Chemotherapy Not mentioned Wieder et al. (18) Unclear 24 60 33–71 20 24 Adenocarcinoma of the esophagogastric junction Chemotherapy 2 Iagaru et al. (19) Retrospective 14 36 (±14) 18–56 8 14 Bone and soft-tissue sarcomas Chemotherapy Not mentioned Nishiyama et al. (20) Retrospective 21 54.5 29–80 0 21 Advanced gynecologic cancer Chemotherapy 3–6 Chemoradiotherapy 4 Benz et al. (21) Prospective 20 49 32–66 10 20 Soft-tissue sarcomas Chemotherapy (not mentioned) Chemoradiotherapy 14 Smithers et al. (22) Prospective 45 Not mentioned Not mentioned 40 Adenocarcinoma of the esophagus Chemotherapy 2 Chemoradiotherapy 2 Ye et al. (23) Prospective 15 17 7–31 15 15 Osteogenic sarcoma Chemotherapy 2 ↵* Amount of male patients.
Data in parentheses are SD.
- TABLE 2.
Definition of Response Differs According to Tumor Type: Histopathologic Evaluation System
Tumor type Evaluation system Definition of response Esophageal carcinomas Mandard system (24) No or only a few scattered residual tumor cells (regression scores 1 and 2) Bone tumors Salzer–Kuntschik system (25) Salzer–Kuntschik grades I–III: less than 10% residual vital tumor area (grade I, 0%; II, single vital areas; and III, <10%) Breast cancer (7) Previously described criteria (26,27) Macroscopic (absence of macroscopically visible tumor) or microscopic (histologic absence of invasive tumor cells) response Breast cancer (13) — No recognizable invasive tumor cells (ductal carcinoma in situ may be present) Head and neck cancer (11) — No viable residual tumor cells in any section Non–small cell lung cancer — Tissue negative for malignant cells Locally advanced rectal cancer — Complete regression or rare residual cancer cells Gynecologic cancer — No tumor (complete response) or residual microscopic disease only Study Scanner Scan mode 18F-FDG dose (MBq) Interval between 18F-FDG injection and PET (min) Interval between end induction therapy and posttreatment PET (d) Interval between posttreatment PET and surgery (d) Image reconstruction Schulte et al. (5) ECAT 931-08-12 Partial 120–300 45–60 12–18 Not mentioned Multiplicative iterative (29) Franzius et al. (6) ECAT EXACT 921/47 Whole body 3.7/kg 60 Not mentioned 3–28 (mean, 21) Filtered backprojection, Hanning filter, cutoff at Nyquist frequency Smith et al. (7) ECAT EXACT 31 Partial 185 0–60*, 60–70 Not mentioned Not mentioned Filtered backprojection, Hanning filter, cutoff at Nyquist frequency Nair et al. (8) ECAT EXACT 47 Whole body 370 45 14 Few days Whole-body format, Hanning filter, cutoff at cutoff frequency = 0.35 of Nyquist frequency Brücher et al. (9) ECAT 951/R Partial 250–270 40 21 <7 Filtered backprojection, Hanning filter, cutoff at 0.4 cycles/pixel ECAT EXACT† Ryu et al. (10) Scanditronix Partial 370 45 14 Not mentioned Filtered backprojection to in-plane resolution of 7 mm in full width at half maximum Kitagawa et al. (11) Advance Partial 244–488 40 >28 Not mentioned Not mentioned Brink et al. (12) ECAT EXACT 922 (+) Whole body 5/kg 90 Not mentioned Not mentioned Iterative, ordered-subset expectation maximization, segmented attenuation correction Chen et al. (13) Advance Partial 259–407 60 Not mentioned Not mentioned Corrections of data for random and scattered coincidences and attenuation; Hanning filter Wieder et al. (14) ECAT EXACT Partial 300–400 60 21–28 < 7 Iterative, ordered-subset expectation maximization (8 iterations, 4 subsets), postreconstruction smoothing with 4-mm Gaussian filter Song et al. (15) ECAT HR+ 2D Whole body 555 60 21–28 Just before Not mentioned Cascini et al. (16) ECAT EXACT 47 Whole body 300–385 60 Not mentioned Few days Iterative, ordered-subset expectation maximization (2 iterations, 16 subsets) Huang et al. (17) ECAT EXACT Partial 259–370 45 7 Not mentioned Not mentioned Wieder et al. (18) ECAT EXACT Partial 300–400 40 21–28 21–28 Iterative, ordered-subset expectation maximization (8 iterations, 4 subsets), and then smoothed in 3 dimensions using 4-mm Gaussian filter Iagaru et al. (19) ECAT EXACT 953A Whole body 550 45 7–36 (mean ± SD, 16 ± 9) Not mentioned Not mentioned Biograph LSO PET/CT‡ 60 Nishiyama et al. (20) ECAT EXACT HR+ Whole body 185–200 60 12 (range, 2–24) Not mentioned (32 [range, 19–40] between chemotherapy and surgery) Iterative, ordered-subset expectation maximization (2 iterations, 8 subsets) Benz et al. (21) Biograph Duo Whole body 7.77/kg 77 ± 8.7 Not mentioned Not mentioned Iterative, ordered-subset expectation maximization (2 iterations, 8 subsets), postreconstruction gaussian filter; final image resolution of 8.8 mm in full width at half maximum Smithers et al. (22) Philips Allegro GSO Whole body 210–427 45 24–32 Chemotherapy, 4 Iterative, 3-dimensional row-action maximum-likelihood algorithm Chemoradiotherapy, 4.5 Ye et al. (23) SHR-22000 Partial 370 60 4–14 (median, 8) 2–22 (median, 12) Hanning filter, cutoff at Nyquist frequency Study Parameter variable ROI technique Observer Schulte et al. (5) TBR ROIs were individually defined, expressing maximum tumor uptake, excluding areas of lower uptake within tumor. Identical configuration at contralateral extremity was used to obtain TBR. In each case ROIs > 2.6 cm2. 2, independent (blinded) Franzius et al. (6) T/NT Rectangular ROI was positioned around tumor activity in coronary slice with maximum tumor activity, with boundaries of ROI located just within apparent hypermetabolic zone. 2, in consensus (blinded) Smith et al. (7) Influx constant K, DURBSA ROIs were manually drawn around each lesion. Maximum pixel value of DUR or influx constant K within ROI was recorded. 2, in consensus (blinded) Nair et al. (8) TBR Identical ROIs were placed over tumor and contralateral normal limb. 3, independent (not mentioned whether blinded) Brücher et al. (9) SUVmean Circular ROI (1.5 cm in diameter) was manually placed in slice with maximum 18F-FDG uptake. SUVs were calculated using average activity values in ROI. Not mentioned Ryu et al. (10) SUVmean SUV of primary tumor was determined as mean value in 12-mm ROI positioned over area with highest activity within tumor as determined by visual analysis. 2, independent (blinded) Kitagawa et al. (11) SUVmean Round ROIs (5 mm in diameter) were placed over area of highest 18F-FDG uptake in tumor on static images. SUV = tissue radioactivity concentration (Bq/mL)/injected dose (Bq) per body weight (g). 3, independent (blinded) Brink et al. (12) SUVmean Average activity values were determined in intratumoral ROI placed on slice with maximum activity concentration. 2, independent (not mentioned whether blinded) Chen et al. (13) SUV Not mentioned. 1, not mentioned whether blinded Wieder et al. (14) SUVmean Circular ROIs (1.5 cm in diameter) were manually placed over all tumors at site of maximum 18F-FDG uptake on baseline scan. SUVs normalized to patient body weight were calculated from average activity values in ROI. Not mentioned Song et al. (15) SUVmax For semiquantitative analysis of increased 18F-FDG uptake lesion, maximum SUV based on body weight was calculated. 1 Cascini et al. (16) SUVmean Irregular ROIs were semiautomatically drawn manually on transaxial planes using region-growing method that included pixels above threshold value (between 20% and 50% of maximum pixel value). Table 1: SUVmean. 1, not mentioned whether blinded Huang et al. (17) SUVmean ROIs were hand-drawn over tumor for calculation of SUV. ROIs were drawn to follow contours of elevated 18F-FDG activity, as compared with normal tissue, contralateral to tumor site. Not mentioned Wieder et al. (18) SUVmean ROIs were manually placed over each primary tumor. Circular ROI of 1.5 cm (1.5 cm in diameter; 10 pixels) was placed on slice with maximum 18F-FDG uptake. SUVs were calculated using average activity values in ROI. Not mentioned Iagaru et al. (19) SUVmax ROIs were placed around regions of increased 18F-FDG uptake for SUVmax determination. Not mentioned Nishiyama et al. (20) SUVmax SUV was defined as tissue concentration of 18F-FDG (kBq/mL) in structure delineated by ROI divided by activity injected per gram of body weight (kBq/g). ROI was placed over entire primary tumor. SUVmax of primary tumor was used. 2, not mentioned whether independent or in consensus or whether blinded Benz et al. (21) SUVmax Manual delineation of ROI on consecutive axial slices of CT scan was used. SUVmax and SUVmean were calculated. 1, blinded Smithers et al. (22) SUVmax Maximum voxel activity in tumor was used for SUV quantification. 1, not mentioned whether blinded Ye et al. (23) SUVmax ROIs were individually defined for each patient on transverse sections of PET images. SUVmax was measured. 2, independent (blinded) TBR: tumor-to-background ratio; T/NT: tumor-to-nontumor ratio; DUR: dose uptake ratio; DURBSA = dose uptake ratio body surface area; SUVmax = maximum standardized uptake value; SUVmean = mean standardized uptake value.
Supplemental Data
Files in this Data Supplement:


