


Abstract
The aim of our study was to retrospectively evaluate whether maximum standardized uptake value (SUVmax), total lesion gylcolysis (TLG), or change therein using 18F-FDG PET/CT performed before and after initial chemotherapy were indicators of patient outcome. Methods: Thirty-one consecutive patients who underwent 18F-FDG PET/CT before and after chemotherapy, followed by tumor resection, were retrospectively reviewed. Univariate Cox regression was used to analyze for relationships between covariates of interest (SUVmax before and after chemotherapy, change in SUVmax, TLG before and after chemotherapy, change in TLG, and tumor necrosis) and progression-free and overall survival. Logistic regression was used to evaluate tumor necrosis. Results: High SUVmax before and after chemotherapy (P = 0.008 and P = 0.009, respectively) was associated with worse progression-free survival. The cut point for SUVmax before chemotherapy was greater than 15 g/mL* (P = 0.015), and after chemotherapy it was greater than 5 g/mL* (P = 0.006), as measured at our institution and using lean body mass. Increase in TLG after chemotherapy was associated with worse progression-free survival (P = 0.016). High SUVmax after chemotherapy was associated with poor overall survival (P = 0.035). The cut point was above the median of 3.3 g/mL* (P = 0.043). High TLG before chemotherapy was associated with poor overall survival (P = 0.021). Good overall and progression-free survival was associated with a tumor necrosis greater than 90% (P = 0.018 and 0.08, respectively). A tumor necrosis greater than 90% was most strongly associated with a decrease in SUVmax (P = 0.015). Conclusion: 18F-FDG PET/CT can be used as a prognostic indicator for progression-free survival, overall survival, and tumor necrosis in osteosarcoma.
Osteosarcoma is the most common primary malignancy of bone (1), with peak age of incidence ranging from 10 to 25 y (2). Initial tumor stage (histologic grade, size or extent of the primary tumor, and presence of metastases) (3,4) and tumor necrosis are the strongest known prognostic factors for survival (2,5). Prognostic indicators are used to modify therapy. Preoperatively, initial metastatic disease is an indication for chemotherapeutic regimens that are considerably more intensive than usual (6,7). Progression of the primary tumor on chemotherapy can be an indication for amputation rather than limb salvage (8,9). The primary tumor may be left in situ if metastases also progress on chemotherapy, sparing the patient a futile and morbid procedure. Suboptimal histologic response to neoadjuvant chemotherapy, defined as less than 90% tumor necrosis (10,11), can also be an indication for more intensive adjuvant (postoperative) regimens (9,12). The percentage of tumor necrosis can be determined only from the operative specimen after completion of neoadjuvant chemotherapy. Ongoing attempts have been made to discover reliable presurgical prognostic indicators (13,14). PET, which is reflective of the initial metabolic activity of the untreated tumor and also of the later, treated tumor, holds considerable potential. Imaging currently plays a major role in assessing response to chemotherapy and may include radiography or MRI or CT of the primary tumor (12) and a bone scan (15). A few studies have shown that evaluation with 18F-FDG PET is a predictor of outcome and of tumor necrosis (16–21).
The glucose analog 18F-FDG is the most commonly used radionuclide for oncologic applications of PET/CT because of the high metabolic rate of most malignancies. 18F-FDG uptake is an indicator of tumor metabolism that is usually measured semiquantitatively using standardized uptake value (SUV), identifying the highest metabolic activity within the tumor (SUVmax). Recently, a different method of evaluating tumor metabolism has become readily available: total lesion glycolysis (TLG), which is an assessment of global metabolic activity in all viable cells throughout the lesion above a minimum threshold (22). Unlike SUVmax, which reflects only the point of greatest metabolic activity within the tumor, it is hypothesized that TLG could better reflect tumor metabolic activity by taking into account the activity in the entire tumor.
Because prognostic indicators influence therapy, the purpose of our study was to assess whether TLG and SUVmax are predictive of tumor necrosis after neoadjuvant chemotherapy in patients with osteosarcoma and to evaluate the performance of both of these parameters in the prediction of progression-free and overall survival.
MATERIALS AND METHODS
Patient Selection and Tumor Types
Institutional review board approval was obtained, and the study was performed in compliance with the Health Insurance Portability and Accountability Act. Informed consent was waived by the institutional review board. Between January 1, 2002, and January 1, 2008, 34 consecutive patients with osteosarcoma were imaged with PET/CT before and after completion of initial chemotherapy. After neoadjuvant chemotherapy, all primary tumors were resected and adjuvant chemotherapy was administered. Three patients were excluded from the study because of the inability to retrieve data from the archive system (n = 2) or because of primary maxillofacial osteosarcoma (n = 1), which is less aggressive than osteosarcoma arising in other anatomic locations and thus is typically considered a separate disease entity (23).
Image Review and Tumor Analysis
Two radiologists, experienced in PET/CT interpretation, measured the SUVmax and TLG for 31 patients on prechemotherapeutic and postchemotherapeutic PET/CT examinations, using an Advantage workstation (GE Healthcare). PET, CT, and PET/CT fusion datasets were retrospectively reviewed. A volumetric region of interest was centered on the lesion. The tumor osteoid present in all lesions defined the margins of the tumor irrespective of decrease in 18F-FDG uptake after therapy. All tumors were greater than 3 cm. The SUV was defined as measured activity concentration (Bq/mL) multiplied by lean body mass (kg) divided by injected activity (Bq).
Lean body mass was calculated according to the following formulas: and
and TLG was determined using an Advantage workstation and was defined as (SUVavg) × (tumor volume), with a threshold of 45% SUVmax in the volume of interest. Change in SUVmax was defined as [(SUVmax1 − SUVmax2)/SUVmax1] × 100. Change in TLG was calculated as follows:
 tumor necrosis was determined by the method of Raymond et al. (10).
PET/CT
The initial PET/CT study was performed on chemotherapy-naïve patients before the start of therapy. A second PET/CT study was performed after the completion of chemotherapy and before tumor resection. Integrated PET/CT systems were used to acquire imaging data (Discovery ST, STe, or RX; GE Healthcare). Whole-body examinations were performed from the level of the vertex of the skull or orbits through the upper thighs or lower legs or toes, depending on the location of the primary tumor. PET/CT was performed in accordance with guidelines published by the National Cancer Institute (24). All patients had fasted for a minimum of 6 h, with a blood glucose level of 80–120 mg/dL (4.4–6.6 mmol/L), before intravenous administration of 18F-FDG (555–740 MBq [15–20 mCi]). An unenhanced CT scan was used for attenuation correction and diagnosis and included 3.75-mm axial slice placement, 140 kV, and 120 mA at a 13.5-mm table speed. Emission PET was performed in 2-dimensional mode, 60–90 min after 18F-FDG administration, at 3–5 min per bed station. Attenuation-corrected and non–attenuation-corrected datasets were reconstructed.
Statistical Analysis
A univariate Cox proportional hazards regression model was used to assess the association between progression-free survival, overall survival, and the following covariates of interest: SUVmax before chemotherapy, SUVmax after chemotherapy, change in SUVmax, TLG before chemotherapy, TLG after chemotherapy, change in TLG, tumor necrosis greater than or equal to 90%, and tumor necrosis less than 90%. The difference between pre- and postchemotherapeutic measurements was calculated as continuous variables and by percentage change. Cut-point analysis was performed for significant associations of SUVmax and TLG with overall survival and progression-free survival.
Computations were performed with Statistical Analysis Software (version 9; SAS Institute Inc.). Statistical significance was set at the 5% level. In some cases, Cox models could not be fit because of the lack of events in one or more categories. In these cases, a Fisher exact test was used to assess whether the proportion of events was the same between groups. Logistic regression models evaluated the relationships between tumor necrosis and the same covariates of interest. No adjustment was made for the multiplicity of testing.
Progression-free survival was defined as the number of days after the initiation of chemotherapy until disease recurrence or death (1 patient was lost to follow-up after tumor resection until notification of demise). Recurrence included pulmonary metastases (n = 13) or local recurrence (n = 1). Overall survival was defined as the number of days from the initiation of chemotherapy until death (n = 5). Patients who were alive and in whom disease did not recur were censored at the time of their last documented clinical communication (n = 12).
RESULTS
Patients and Tumors
A total of 31 patients were included in the study (19 men and 12 women; age range, 9–65 y; average, 27.5 y). Follow-up ranged from 152 to 1,623 d, with a median follow-up of 2.6 y.
Tumor locations were femur (n = 17), tibia (n = 4), pelvis (n = 4), humerus (n = 1), scapula (n = 1), clavicle (n = 1), manubrium (n = 1), fibula (n = 1), and maxilla (n = 1). The latter maxillary osteosarcoma was radiation-induced high-grade sarcoma and thus included in the study.
Histologic types of the tumors were high-grade conventional (n = 22), radiation-induced high grade (n = 3), telangiectatic (n = 3), dedifferentiated parosteal (n = 2), and small cell (n = 1) osteosarcomas. The largest dimension of the tumors ranged from 4.5 to 24.0 cm (average, 11.6 cm) after chemotherapy.
SUVmax and TLG
All data for “g/mL*” (SUVmax) and TLG were calculated using lean body mass (hence the asterisk in g/mL*). SUVmax before chemotherapy ranged from 3.2 to 36.1 g/mL* (average, 10.6 g/mL*). Note that the units of SUV are g/mL*. If it is assumed that a gram of tissue has a specific density of 1 (the equivalent of 1 mL), then the units would cancel (mL/mL). However, osteoid-containing tumors are denser than usual and not expected to have a specific density of 1; therefore, units have been retained in this study. SUVmax after chemotherapy ranged from 2.0 to 23.9 g/mL* (average, 4.75 g/mL*); change in SUVmax ranged from a decrease of 33.2 (−92.0%) to an increase of 1.2 g/mL* (27.3%); TLG before chemotherapy ranged from 16.2 to 1,046.5 g (average, 254.6 g); TLG after chemotherapy ranged from 11.3 to 1,219.1 g (average, 232.0 g); and change in TLG ranged from a decrease of 342.1 g (−98.1%) to an increase of 483.1 g (242.2%).
Progression-Free Survival
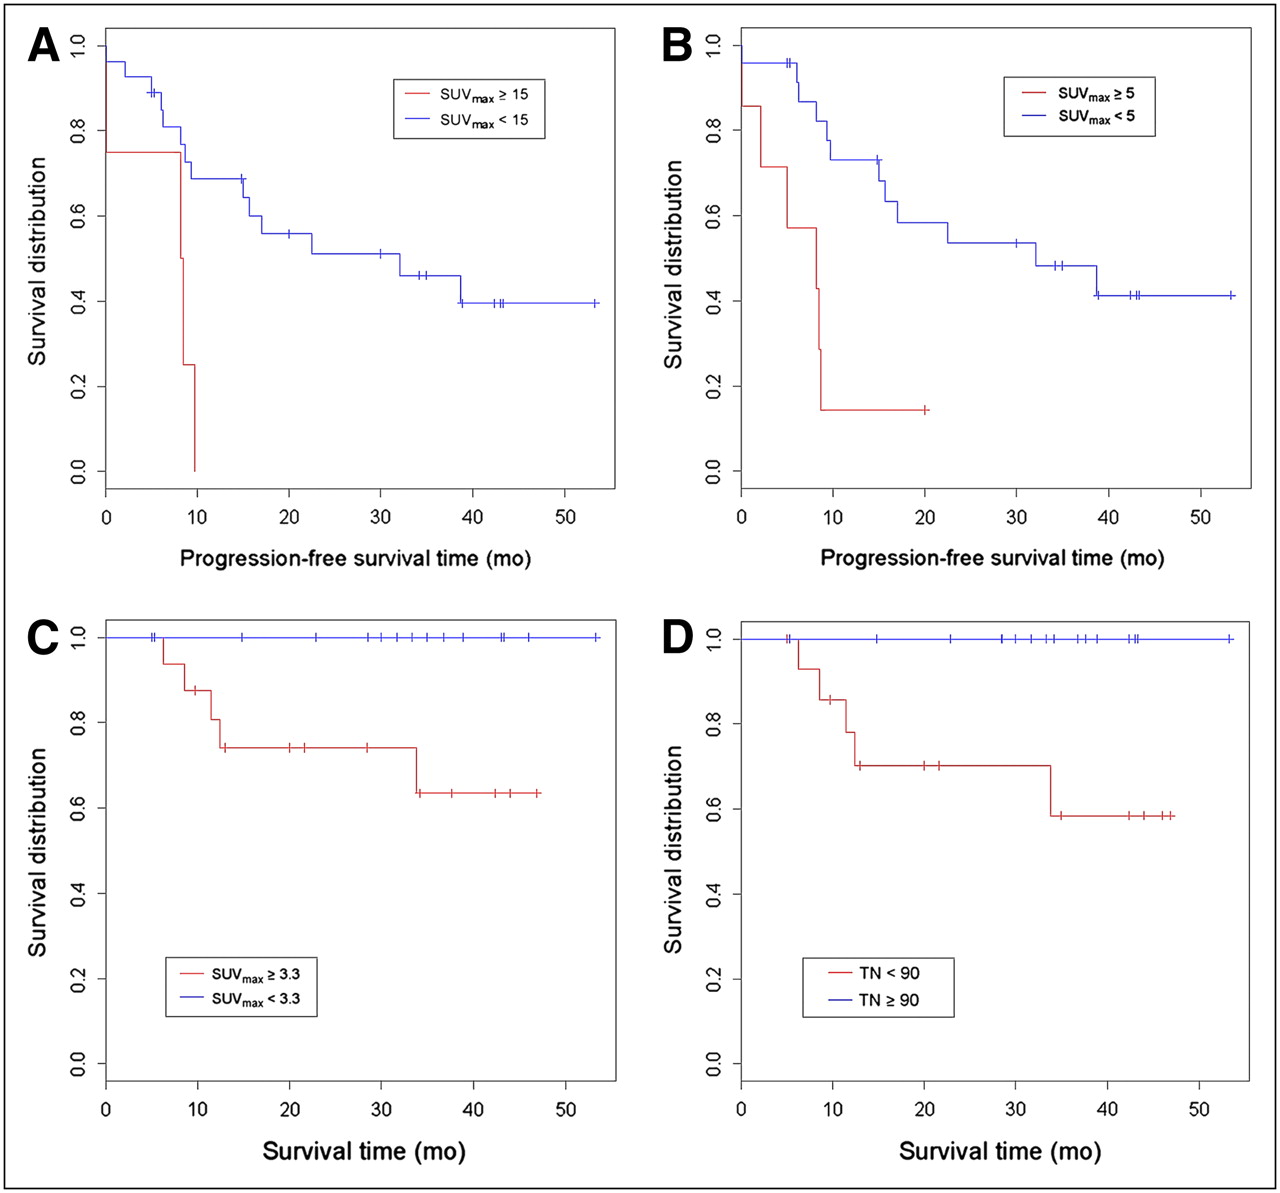
An association between SUVmax and progression-free survival was observed. Poor outcome was associated with higher values for both the prechemotherapeutic SUVmax (P = 0.008, hazard ratio [HR] = 1.081) and the postchemotherapeutic SUVmax (P = 0.009, HR = 1.112) (Table 1). According to cut-point analysis, a prechemotherapeutic SUVmax of less than or equal to 15 g/mL* (P = 0.015, HR = 4.514) was significantly associated with progression (Fig. 1A), with 15% (n = 4) of patients above the cut point. A postchemotherapeutic SUVmax measurement of greater than or equal to 5 g/mL* (P = 0.006, HR = 4.527) was significantly associated with progression (Fig. 1B), with 23% (n = 7) patients above the cut point. Although there was no evidence that TLG values on the pre- or the postchemotherapeutic examinations were associated with progression-free survival, an increase in TLG between the 2 examinations was associated with a shorter progression-free survival (P = 0.016, HR = 1.096).

(A) Kaplan–Meier graph of prechemotherapeutic SUVmax and progression-free survival with SUVmax above (red line) and below (blue line) cut point of 15 g (lean body mass). High SUVmax is associated with worse progression-free survival (estimated 25% at 8 mo above and 39.5% at 39 mo below cut point). Cut point of 15 (P = 0.015, HR = 4.514, CI = 1.335–15.26) will vary among different institutions. (B) Kaplan–Meier graph of postchemotherapeutic SUVmax and progression-free survival with SUVmax above (red line) and below (blue line) cut point of 5 g (lean body mass). High SUVmax is associated with worse progression-free survival (estimated 14.3% at 9 mo above and 41.3% at 39 mo below cut point). Cut point of 5 (P = 0.006, HR = 4.527, CI = 1.548–13.24) will vary among different institutions. (C) Kaplan–Meier graph of postchemotherapeutic SUVmax and overall survival with SUVmax above (red line) and below (blue line) median of 3.3 g (lean body mass). High SUVmax is associated with worse overall survival (estimated 63.5% at 34 mo for patients with values above median). No deaths occurred in patients with postchemotherapeutic SUVmax below median. Median of 3.3 (P = 0.043) will vary among different institutions. (D) Kaplan–Meier graph of tumor necrosis and overall survival. Estimated overall survival in patients with tumor necrosis less than 90% is 58.4% at 34 mo (red line). No deaths occurred in patients with tumor necrosis greater than or equal to 90% (blue line). Tumor necrosis greater than or equal to 90% correlated significantly with overall survival (P = 0.018). CI = confidence interval; TN = tumor necrosis.
Progression-Free Survival Estimated by Univariate Cox Regression
Overall Survival
High SUVmax on the postchemotherapeutic examination was associated with mortality (P = 0.035, HR = 1.125) (Table 2). Patients with an SUVmax greater or equal to the median of 3.3 g/mL* had a higher likelihood of dying (P = 0.043), with all (n = 5) deaths occurring in patients with values above the median SUVmax (Fig. 1C). SUVmax before chemotherapy was not associated with increased mortality. TLG on the prechemotherapeutic scan showed an association with mortality, with higher TLG associated with greater mortality (P = 0.021, HR = 1.003), but postchemotherapy TLG and change in TLG did not reach statistical significance.
Overall Survival Estimated by Univariate Cox Regression
Tumor Necrosis
Improved overall survival was associated with greater than 90% tumor necrosis (P = 0.018) (Table 2, Fig. 1D), and good progression-free survival was weakly associated with greater than 90% tumor necrosis (P = 0.08, HR = 0.426) (Table 1). A logistic-regression model was used to further investigate for associations between tumor necrosis, SUVmax, and TLG (Table 3). Greater than 90% tumor necrosis was associated with a decrease in SUVmax from the pre- to the postchemotherapeutic examinations (P = 0.015, odds ratio [OR] = 0.657), and a weak relationship was found with low SUVmax after chemotherapy (P = 0.09, OR = 0.684). Weak relationships were found with low prechemotherapeutic TLG (P = 0.05, OR = 0.994) and low postchemotherapeutic TLG (P = 0.06, OR = 0.997). No association was found with change in TLG or prechemotherapeutic SUVmax.
Greater than 90% Tumor Necrosis Estimated by Univariate Logistic Regression
DISCUSSION
Few published studies assess the utility of 18F-FDG PET in the evaluation of the response of osteosarcoma to neoadjuvant chemotherapy (16–21). Many of our findings, such as the association between tumor necrosis and outcome (2,4,9–11) and the association of worse survival with high metabolic activity in the chemotherapy-naïve tumor (17) and with high metabolic activity after chemotherapy (17), all confirm the conclusions of prior studies that 18F-FDG PET accurately reflects response of osteosarcoma to chemotherapy. Despite the small number of deaths and relatively short follow-up, our study results are similar to a recently published study with follow-up periods of more than 4 y that showed that survival is associated with SUVmax after chemotherapy (21).
All tumors included in this study were high grade because low-grade osteosarcomas do not require chemotherapy. Conventional high-grade osteosarcoma comprises the majority of osteosarcomas. A single-center, retrospective study of 648 consecutive osteosarcomas of all histologic subtypes and grades requiring chemotherapy (excluding radiation-induced, Paget disease, and Rothmund-Thompson–related osteosarcomas) demonstrated an overall survival of 68% (2). Telangiectatic, dedifferentiated parosteal, and small cell histologies are rare; therefore, large series are not available and follow-up is often limited. A recent study has found an overall survival rate for telangiectatic osteosarcoma to be 66.8% ± 11.9% and similar to other high-grade osteosarcomas treated at the same institution (25). Mortality has been found to range from 28% (26) to 50% (27) for dedifferentiated parosteal osteosarcoma. The prognosis of small cell osteosarcoma has been found comparable to or slightly worse than conventional high-grade intramedullary osteosarcoma when treated with modern therapy (28,29). There has been recent controversy in the literature regarding the prognosis of radiation-induced osteosarcoma of bone. Although a recent study suggested that prognosis was similar to that for conventional high-grade tumors (30), this result has been refuted by another study reporting a mean survival of only 23 mo (31). The majority of tumors included in our study have comparable prognoses to each other. Any bias introduced by including different histologic subtypes is thought to be minimal.
Our study has several advantages in comparison with previous studies. First, attenuation correction was not performed in most of the previous studies that evaluated the metabolic activity of osteosarcoma with 18F-FDG PET. Therefore, data were not presented in the form of SUVmax, which has become the most common method of communicating the results of PET/CT. Our images were attenuation-corrected and presented as SUV rather than as tumor-to-background ratios. Second, our examinations were performed on integrated PET/CT scanners rather than on PET-only scanners. PET/CT findings are known to be more accurate than PET-only findings in diagnosing parenchymal tumors as has recently been demonstrated in bone tumors (32). Third, the methodology used in the measurements of both the SUVmax and TLG is easy to perform and reproducible. Finally, we generated numeric values representing metabolic activity, which is necessary for clinical trials and helpful in routine clinical practice when following the response of patients undergoing treatment.
To our knowledge, our study is the first to meaningfully evaluate TLG in patients with osteosarcoma. Unlike SUV, which is a measurement of metabolic activity per body weight, TLG evaluates metabolic activity throughout the volume of the tumor (SUVavg multiplied by tumor volume) above a minimum threshold designed to exclude background activity. Prior methods of measuring TLG were prohibitively labor-intensive, as they required the manual drawing of numerous consecutive regions of interest throughout the entire tumor (33). With the help of manufacturer-provided software, all that is now necessary is to simply draw a volumetric region of interest around the tumor. TLG is an emerging indicator of metabolic activity that has recently been used to investigate other malignancies such as mesothelioma (34), rectal cancer (35), and breast cancer (36). Although SUVmax demonstrated a larger number of more strongly significant covariates, we showed that the change in TLG in patients from pre- to postchemotherapeutic examinations was a predictor of progression-free survival. Also, high TLG in the chemotherapy-naïve tumor was associated with poor overall survival in our series (Figs. 2 and 3).

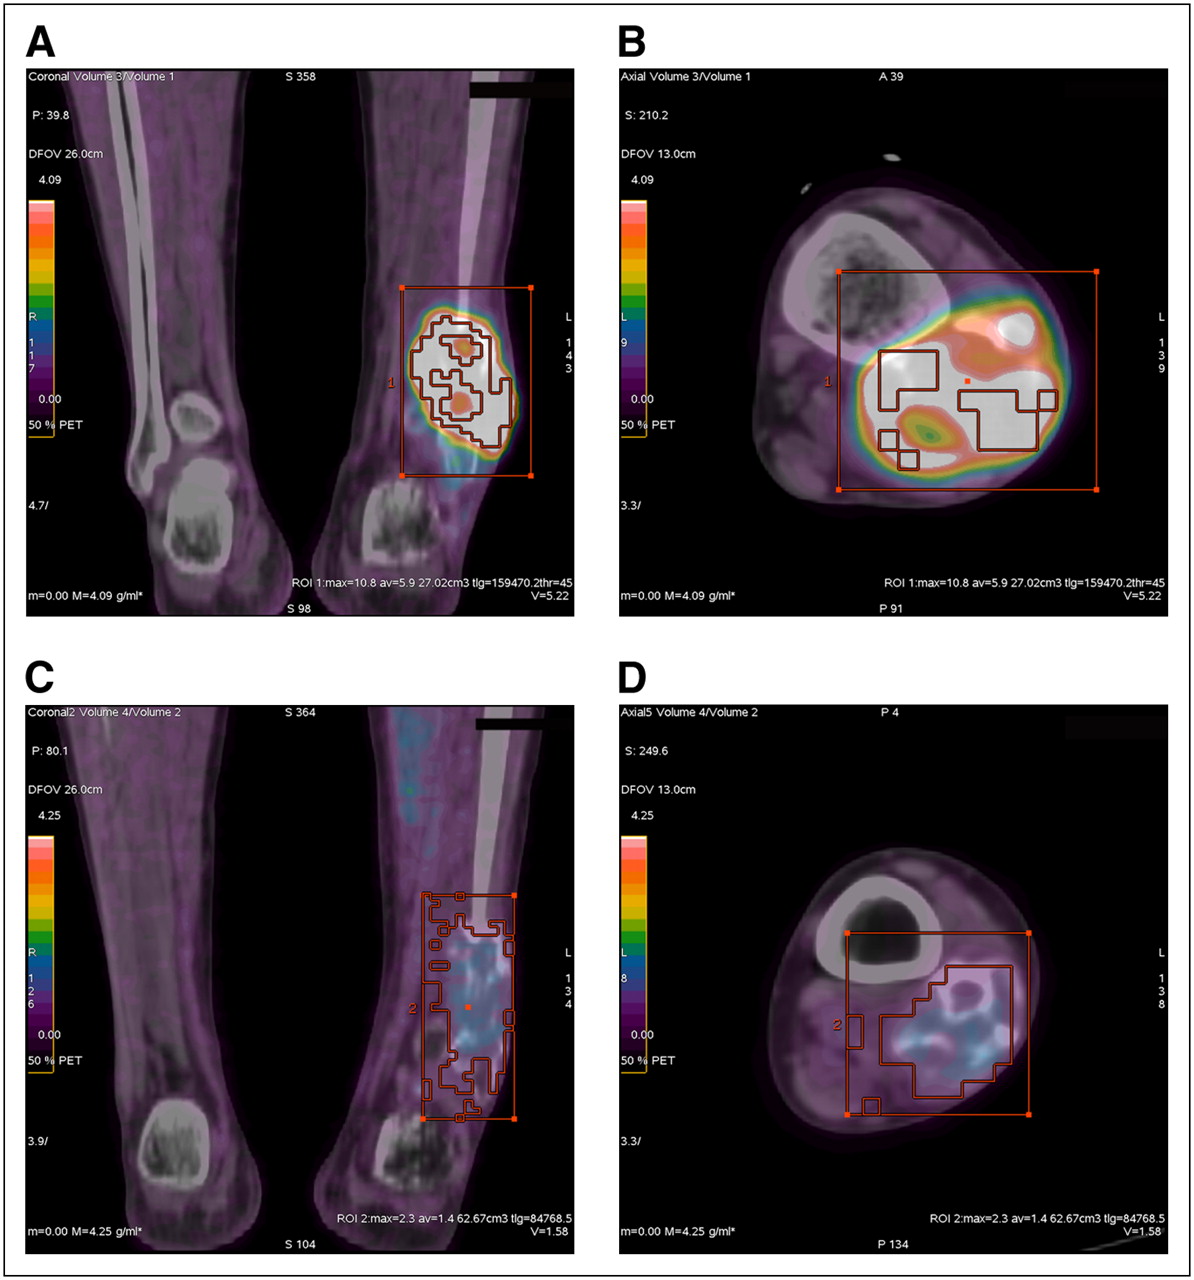
Fused 18F-FDG PET/CT images of 25-y-old man with high-grade conventional osteosarcoma of distal fibular metaphysis. Coronal (A) and axial (B) images of tumor before chemotherapy demonstrate SUVmax and TLG values of 10.8 g/mL* and 159.5 g, respectively. Coronal (C) and axial (D) images after completion of chemotherapy reveal marked reduction in SUVmax to 2.3 g/mL* and TLG to 85.8 g. As predicted by pre- and postchemotherapeutic PET/CT values, patient is alive, with no local recurrence or metastases 1,310 d (3.6 y) after completion of chemotherapy.

Fused 18F-FDG PET/CT images of 61-y-old man with high-grade conventional osteosarcoma of proximal tibial metaphysis. Coronal (A) and axial (B) images of tumor before chemotherapy demonstrate SUVmax and TLG values of 33.7 g/mL* and 895.1 g, respectively. Though area of 18F-FDG uptake has decreased on coronal (C) and axial (D) images after completion of chemotherapy, only mild reduction in SUVmax (23.9 g/mL*) and TLG (553.0 g) is seen. As predicted by pre- and postchemotherapeutic PET/CT values, pulmonary metastases developed 247 d after initiation of chemotherapy and patient succumbed to his disease 118 d later.
Our study has several limitations that are mainly due to the relatively small group size and short patient follow-up. However, our study is the largest series evaluating neoadjuvant chemotherapy for osteosarcoma by PET (16–21). Osteosarcoma typically recurs within 2–3 y of surgery (37). Therefore, a lengthier follow-up period is necessary for more complete assessment of survival. One may also question the accuracy of the method used for calculating TLG. The value of TLG is equal to the lesion volume multiplied by SUVavg above a threshold designed to exclude background activity. The volume of the lesion is often difficult to determine from PET scans because of limited resolution. The actual structural volume of a lesion is often smaller than the volume apparent on PET-only imaging. Several research groups have developed different approaches to determine lesion volumes from PET scans (33,38–44). These techniques range from visual inspection to more complicated approaches requiring predetermined look-up tables that relate SUV thresholds to tumor volumes for different tumor-to-background ratios. To date, there is no consensus on which approach is the most suitable for determining lesion volume on PET.
The method used in this study is also based on the concept of a fixed threshold of the SUVmax. Thresholding has been found to be effective (38,40,44) provided that the lesion was not affected by partial-volume effects and had a relatively high tumor-to-background ratio. This method is, again, well suited for evaluating osteosarcoma because most of the tumors are in the extremities, in which few adjacent structures are likely to volume-average or approach the level of 18F-FDG uptake exhibited by the tumor.
Volume measurement can be difficult on unenhanced CT. Osteosarcoma is ideally suited to the method of TLG calculation used by our workstation and in this study because tumor osteoid delineates the margins of the lesion, and volumes are easily drawn about the tumors before and after chemotherapy irrespective of low 18F-FDG uptake. Malignancies that do not elaborate matrix mineralization may be difficult to distinguish from surrounding soft tissue if 18F-FDG uptake is low. Therefore, it is recommended that intravenous contrast be used under such circumstances.
Additionally, a technical factor that should be considered while reviewing the cut-point values of our study is that there is the lack of uniformity in performing PET/CT among various facilities. Measurements at our institution may not reflect the absolute values obtained elsewhere. Scanning at our institution was performed following guidelines published by the National Cancer Institute (24), and our measurements were made in the form of lean body mass to avoid bias introduced by varying amounts of body fat among individual patients. The numeric value generated at an institution can be compared within the same institution.
CONCLUSION
Our study has shown that 18F-FDG PET/CT is a predictor of progression-free survival, overall survival, and tumor necrosis in osteosarcoma, whether SUVmax or TLG is used. Although the results suggest that SUVmax is a stronger indicator than is TLG, we are awaiting large prospective studies to more fully assess which of the 2 methods of measuring 18F-FDG uptake is the optimal predictor of survival.
Acknowledgments
We thank Nancy M. Swanston, CNMT, PET; Richelle D. Millican Campbell, CNMT, PET; and the entire PET team for demonstrating continued excellence in patient care and providing quality image acquisition and data transfer.
Footnotes
-
COPYRIGHT © 2009 by the Society of Nuclear Medicine, Inc.
References
- Received for publication September 25, 2008.
- Accepted for publication November 25, 2008.


Jump to section
Related Articles
Cited By...
- 18F-FDG PET/CT in the Management of Osteosarcoma
- 18F-FDG PET/CT in the Management of Osteosarcoma
- SNMMI Procedure Standard/EANM Practice Guideline on Pediatric 18F-FDG PET/CT for Oncology 1.0
- 18F-FDG Uptake During Early Adjuvant Chemotherapy Predicts Histologic Response in Pediatric and Young Adult Patients with Osteosarcoma
- 18F-FDG PET/CT to Predict Response to Neoadjuvant Chemotherapy and Prognosis in Inflammatory Breast Cancer
- Initial Metabolic Tumor Volume Measured by 18F-FDG PET/CT Can Predict the Outcome of Osteosarcoma of the Extremities
- Characterization of Different Osteosarcoma Phenotypes by PET Imaging in Preclinical Animal Models
- Metabolic Tumor Volume Assessed by 18F-FDG PET/CT for the Prediction of Outcome in Patients with Multiple Myeloma
- Prognostic Value of Baseline [18F] Fluorodeoxyglucose Positron Emission Tomography and 99mTc-MDP Bone Scan in Progressing Metastatic Prostate Cancer
- Correlation Between Glycolytic Phenotype and Tumor Grade in Soft-Tissue Sarcomas by 18F-FDG PET