


Article Figures & Data
Figures
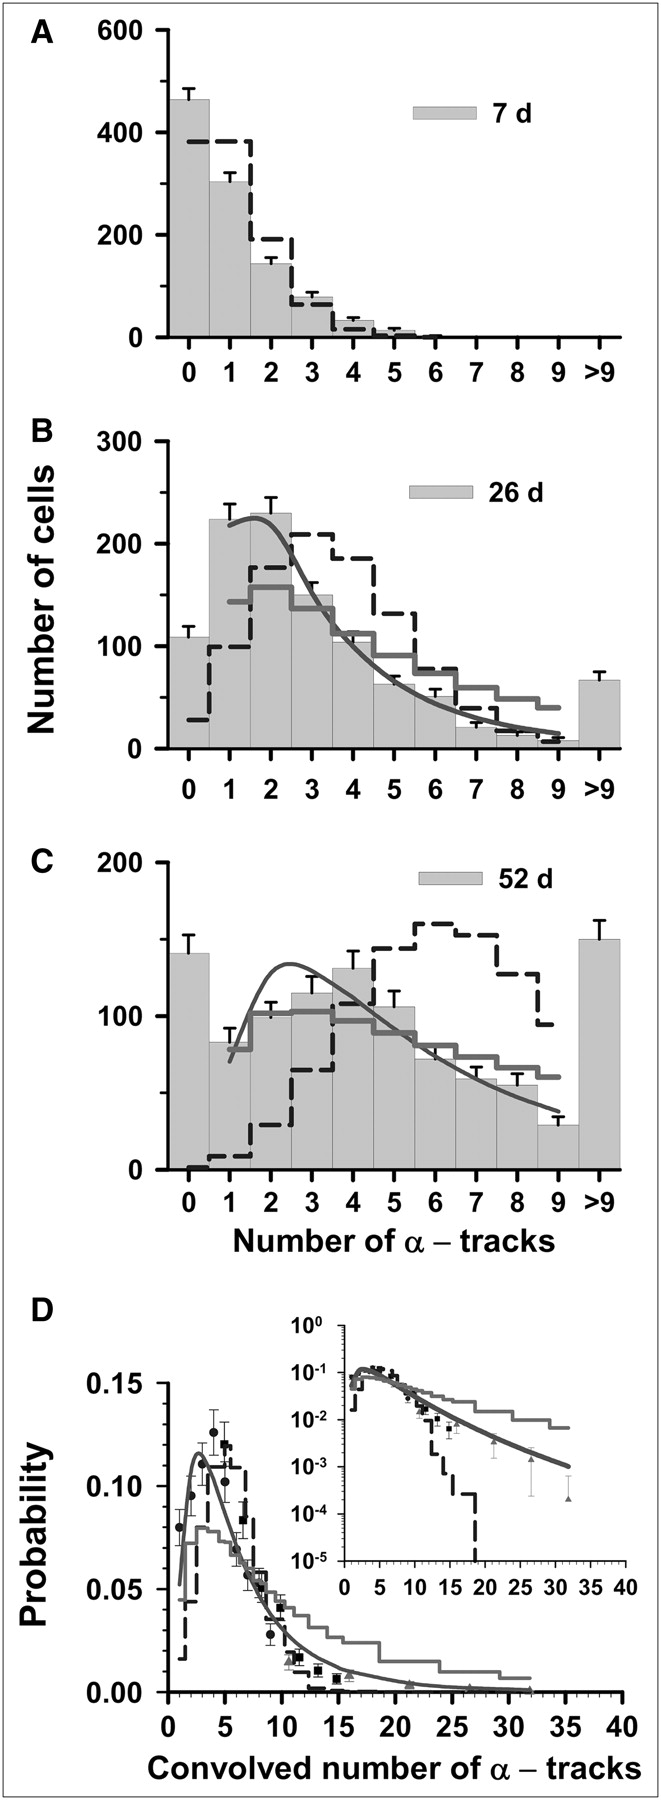
- FIGURE 1.
Statistical analysis of α-particle track distribution in V79 lung fibroblasts that were labeled in culture medium containing 0.52 kBq of 210Po-citrate per milliliter. (A–C) Vertical bars with SEs represent experimental track distributions (discrete) when scored after decays had been allowed to accumulate for 7, 26, and 52 d (7). (D) Data points represent normalized convolution of experimental track data obtained at 7 d (▴), 26 d (▪), and 52 d (•). Error bars represent SEs. In each panel, predicted probabilities based on Poisson, P-LN, and LN functions are represented by dashed step line, thick solid step line, and solid curve, respectively. Parameters of 3 probability density functions are enumerated in Table 1. Inset plots ordinates on log scale to compare trends of these probability functions relative to experimental data at high numbers of convolved tracks.
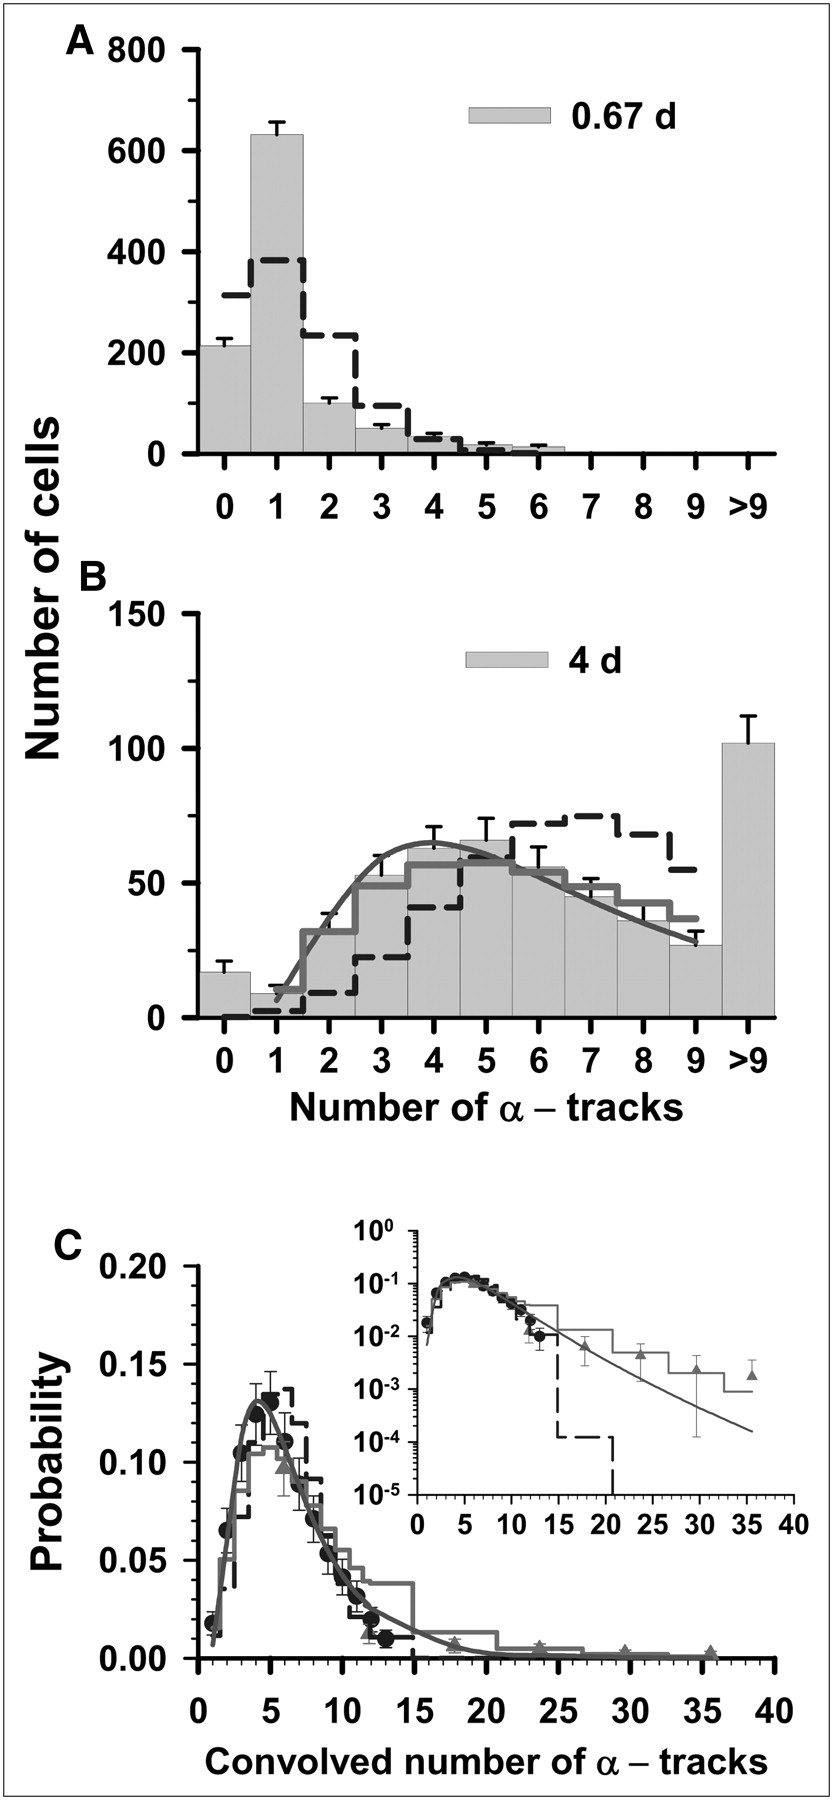
- FIGURE 2.
Statistical analysis of α-particle track distribution in V79 lung fibroblasts that were labeled in culture medium containing 3.8 kBq of 210Po-citrate per milliliter. (A and B) Decays were allowed to accumulate for 0.67 d (A) and 4 d (B). (C) Data points represent normalized convolution of experimental track data obtained at 0.67 d (▴) and 26 d (•). Error bars represent SEs. In each panel, predicted probabilities based on Poisson, P-LN, and LN functions are represented by dashed step line, thick solid step line, and solid curve, respectively. Inset plots ordinates on log scale to compare trends of these probability functions relative to experimental data at high numbers of convolved tracks. Parameters of 3 probability density functions are enumerated in Table 1.
- FIGURE 3.
Statistical analysis of α-particle track distribution in V79 lung fibroblasts that were labeled in culture medium containing 67 kBq of 210Po-citrate per milliliter. (A and B) Decays were allowed to accumulate for 0.25 d (A) and 1 d (B). (C) Data points represent normalized convolution of experimental track data obtained at 0.25 d (▴) and 1 d (•). Error bars represent SEs. In each panel, predicted probabilities based on Poisson, P-LN, and LN functions are represented by dashed step line, thick solid step line, and solid curve, respectively. Inset plots ordinate on log scale to compare trends of these probability functions relative to experimental data at high numbers of convolved tracks. Parameters of 3 probability density functions are enumerated in Table 1.
- FIGURE 4.
LN σ for 3 different activity concentrations of 210Po-citrate. Open squares (□) represent values of σ obtained, when <n> was constrained, by LS fits of experimental track data corresponding to longest decay accumulation times (i.e., t2 > t1, Figs. 1C, 2B, and 3B) to LN distribution function. SEs of these fitted σ-values are indicated by vertical lines. Corresponding σ-values obtained for these same data using P-LN distribution function are shown as open circles (○). Open triangles (▵) correspond to LS fits of convolved data (Figs. 1D, 2C, and 3C) to LN function. Finally, dashed line passes through what are considered best σ-values as defined by lowest
 .
.


Tables
- TABLE 1
Statistical Analysis of 210Po α-Particle Track Distribution Data (7) Using Poisson, LN, and P-LN Functions
- TABLE 2
Relevant Parameters for β-Particle Tracks per Cell in Autoradiography Experiment Along with Quantities of Statistical Tests for Stirred and Unstirred Mixtures
Statistical test Type and function <n>* σ† R2 Stirred mixture Poisson 8.7 — 22 0.15 — LN 8.7 0.70 20 0.0071 — P-LN 8.7 0.80 20 0.0064 — LS fit to LN 12 ± 1.4 0.79 ± 0.075 20 0.0048 0.79 Unstirred mixture Poisson 7.8 — 21 0.99 — LN 7.8 0.67 20 0.0077 — P-LN 7.8 0.68 20 0.0046 — LS fit to LN 8.2 ± 0.37 0.57 ± 0.033 20 0.018 0.93


Jump to section
Related Articles
Cited By...
- Changes in Lognormal Shape Parameter Guide Design of Patient-Specific Radiochemotherapy Cocktails
- Lognormal Distribution of Cellular Uptake of Radiopharmaceuticals: Implications for Biologic Response in Cancer Treatment
- The {alpha}-Camera: A Quantitative Digital Autoradiography Technique Using a Charge-Coupled Device for Ex Vivo High-Resolution Bioimaging of {alpha}-Particles
- Further Explorations of Cellular Uptake of Radioactivity