


Abstract
Cardiac PET/CT is optimized by cine CT with dedicated shift software for manual correction of attenuation–emission misregistration. Separate rest and stress CT scans incur greater radiation dose to patients than does standard helical PET/CT or “pure” PET using rotating rod attenuation sources. To reduce radiation dose, we tested quantitative accuracy of using a single poststress cine CT attenuation scan for reconstructing rest perfusion images to eliminate resting CT attenuation scans. Methods: A total of 250 consecutive patients underwent diagnostic rest-dipyridamole myocardial perfusion PET/CT with 82Rb and a 16-slice PET/CT scanner using averaged cine CT attenuation data during breathing at rest and stress. After correcting for any attenuation–emission misregistration, we quantitatively compared resting perfusion images reconstructed using rest cine CT attenuation data with the same resting emission data reconstructed with poststress cine CT attenuation data. Automated software quantifying average regional quadrant activity, severity, size, and combined size and severity of perfusion defects was used for this comparison. Results: Resting perfusion images reconstructed using rest cine CT attenuation data were quantitatively comparable to resting images reconstructed with poststress cine CT attenuation data with no clinically significant differences. Twenty-five (10%) of 250 cases required shifting of stress cine CT attenuation data to achieve optimal attenuation–emission coregistration with resting perfusion data. Eliminating rest CT attenuation scans reduced CT radiation dose by 50% below rest-plus-stress cine CT protocols. Conclusion: Resting perfusion images reconstructed using poststress cine CT attenuation data are quantitatively comparable to resting images reconstructed with resting cine CT attenuation data. Eliminating the rest CT scan reduces CT radiation dose by 50%.
Cardiac PET is the most accurate noninvasive technology for assessing myocardial perfusion. Frequent misregistration artifacts in standard cardiac PET/CT using helical CT scans (1–11) are eliminated by cine CT and manual coregistration of attenuation–emission data to achieve proper coregistration (10,11). With systematically correct attenuation–emission coregistration, cardiac PET is suitable for assessing the severity of coronary artery disease (CAD) as the basis of invasive procedures, for stratifying risk, for following progression or regression of CAD after intense risk factor treatment, and for predicting coronary events in relation to the intensity of medical treatment (12–26). Mild reductions in relative coronary flow reserve by PET indicate early nonobstructive or diffuse CAD as the basis for treatment before significant stenosis develops (13,20,21).
However, radiation dose to patients undergoing CT has become an important issue (27–30). Current standard PET/CT protocols acquire separate rest and poststress CT scans for attenuation data to reconstruct rest and stress emission images. Cardiac PET/CT involves substantially greater radiation dose than does “pure” cardiac PET using a rotating rod attenuation source. Although a rest and poststress cine CT protocol eliminates misregistration artifacts, it incurs greater radiation dose to patients than do rest and poststress helical CT scans. Accordingly, we tested the hypothesis that the quality of resting perfusion images reconstructed with poststress cine CT attenuation data is quantitatively comparable to resting perfusion images reconstructed using rest cine CT attenuation data. The rest CT scan could then be eliminated with corresponding reduction of radiation dose.
MATERIALS AND METHODS
Study Patients
A total of 250 consecutive patients undergoing diagnostic myocardial perfusion rest-dipyridamole PET/CT for potential CAD or follow-up imaging were analyzed at the Weatherhead PET Center for Preventing and Reversing Atherosclerosis of the University of Texas Medical School–Houston and Memorial Hermann Hospital. All subjects signed informed consent approved by the Committee for the Protection of Human Subjects of the University of Texas Health Science Center.
PET
Patients were instructed to fast for 4 h and abstain from caffeine, theophylline, and cigarettes for 24 h before study. PET/CT was performed using a Discovery ST 16-slice PET/CT bismuth germanate tomograph (General Electric Healthcare) in 2-dimensional mode with extended septa at a reconstructed in-plane resolution of 5.9 mm in full width at half maximum. Patients were positioned in the scanner using laser guides aligned to the base of the throat and confirmed by a CT scout scan. External body markers were used to check for correct positioning throughout data acquisition. Resting helical and cine CT transmission scans (rest CT) were obtained as detailed later in the text. Ungated emission images were then obtained over 6 min after intravenous injection of 1,295–1,850 MBq (35–50 mCi) of generator-produced 82Rb and contained 24–60 million total counts, of which 12–30 million were true coincidence counts.
Immediately after completion of the resting 82Rb scan, dipyridamole (0.142 mg/kg/min) was infused for 4 min. At 4 min after completion of the dipyridamole infusion, the same dose of 82Rb was given intravenously. Rest and stress emission image acquisition was started at 70 s after the beginning of 82Rb infusion or 80 s after the beginning of infusion for patients with heart failure or heart rates below 55 beats/min. For angina induced by dipyridamole, aminophylline (125 mg) was given intravenously. After completion of stress emission imaging, a poststress cine CT transmission scan was obtained (stress CT).
CT Attenuation Acquisition
After positioning in the gantry, patients had a CT scout scan using 120 kV and 10 mA in anterior-posterior format to bracket the heart. The helical CT attenuation acquisition used 120 kV, 100 mA over 4 s, x-ray collimation of 16 by 1.25 mm, gantry rotation of 0.5 s, and helical pitch of 1.75:1 as previously reported (11). Initially in our clinical cardiac PET/CT service, we used the standard 200 mA as recommended by the manufacturer. After the value of cine CT for reducing misregistration artifacts had been demonstrated (11), the helical scan was no longer used routinely for attenuation correction of emission data. However, the Discovery ST operating software requires an obligatory helical CT for completion of the PET/CT acquisition protocol. Consequently, the amperage of the first obligatory helical CT scan was lowered to 100 mA to reduce the radiation dose while retaining capacity to assess coronary calcification visually and to serve for reconstruction of emission images in the rare instance that the cine CT scan was not technically suitable.
Cine mode data acquisition is one of the 3 optional data acquisitions on the Discovery ST PET/CT scanner that include axial, helical, and cine modes. The cine CT attenuation scan used 120 kVp, x-ray collimation of 8 by 2.5 mm, gantry rotation cycle of 0.5 s, cine duration of 10 s, and 14-cm coverage. Each reconstruction used 360° of CT data over 0.5 s. The cine data acquisition lasted for 78 s, of which 70 s was for 7 cine CT acquisitions of 10 s each and 8 s for 6 table translations of 2 cm each between 2 adjacent cine CT acquisitions. Tube current for cine CT was 10 mA for patients weighing less than 100 kg, 15 mA for 100–130 kg, and 20 mA for more than 130 kg.
For each cine CT scan, there are 1,232 CT images reconstructed 2 min after the cine CT acquisition and 22 images per slice location during normal respiration before averaging into a CT image over several breathing cycles. The processing time for an averaged cine CT attenuation scan was less than 1 min. The average CT attenuation data was interpolated to make the average CT images align at the locations of the PET slices for attenuation correction of the PET data and to evaluate registration between the average CT image and the PET images corrected with the average CT attenuation data. In view of the inherent blurring introduced by the average CT but not by the helical CT data, we applied gaussian filtering of 4 mm and 10 mm in full width at half maximum on the average CT and helical CT data, respectively, before CT attenuation correction of the PET data.
Dedicated software was also developed to shift the averaged cine CT data in the horizontal and vertical directions in the transaxial plane and in the superior-inferior or z-axis direction of different planes to align the CT heart borders visually with the PET data to achieve good coregistration. The average cine CT slices, shifted to match the PET slices, are saved for repeated reconstruction of the PET images using the shifted average attenuation correction data as previously reported (11). For cases in which the stress cine CT data were shifted to achieve proper coregistration with the stress emission data, the same shifted stress attenuation data were used to reconstruct the resting images. The resting image reconstructed with the initially shifted stress cine CT data was then checked visually for attenuation–emission coregistration on the fusion display. If this initially shifted stress CT attenuation data failed to coregister with the rest perfusion data, it was shifted again to obtain good coregistration of the stress CT attenuation data with the resting emission data.
Quantitative Analysis of PET Images
Images were reconstructed using filtered backprojection with a Butterworth filter having a cutoff of 0.55, roll-off of 10, and pixel size of 3.27 × 3.27 mm based on our phantom studies showing better contrast resolution for cold spot imaging using filtered backprojection, compared with ordered-subset expectation maximization (31). Fusion images were made by superimposing attenuation-corrected emission and CT transmission scans in horizontal, coronal, and sagittal views and shifted as needed to achieve correct attenuation–emission coregistration. After attenuation correction, the reconstructed PET emission images in DICOM format were exported to an Ultra 60 workstation (Sun Microsystems) of an mPower-HZL PET scanner (Positron Corp.) for reorientation into long- and short-axis tomographic and topographic 3-dimensional displays using previously described automated quantitative software (10–26) for comparison to our reports on misregistration artifacts in PET (10,11). Quantitative data from rubidium and 18F phantoms imaged on the Discovery ST scanner are exported to the mPower-HZL software for automated quantitative analysis and display of PET images where quantitative accuracy of exported data has been validated by extensive phantom studies.
A 3-dimensional restructuring algorithm generates true short- and long-axis views from reconstructed PET transaxial cardiac images, perpendicular to and parallel to the long axis of the left ventricle. From the tomographic data, circumferential profiles are used to reconstruct 3-dimensional topographic views of the left ventricle showing relative regional activity distribution divided into lateral, inferior, septal, and anterior quadrant views of the 3-dimensional topographic display corresponding to the coronary arteries as previously described (10–26).
Mean activity in each quadrant is normalized to the maximum 2% of pixels in the whole heart dataset. Regions of each quadrant are identified having values outside 2.5 SDs or 97.5% confidence intervals outside reference values of 50 healthy volunteers with no risk factors by complete medical history (no hypercholesterolemia, hypertension, diabetes, smoking, obesity, drug or alcohol abuse, other systemic diseases, or family history of CAD). The percentage of circumferential profile units outside 2.5 SDs was calculated automatically for each quadrant and the whole heart.
The severity of a perfusion defect is quantified as the average relative uptake in a defined quadrant or the lowest quadrant average relative activity; that is, the average relative activity for the quadrant having the lowest average activity of anterior, septal, lateral, and inferior quadrants for each subject, expressed as a percentage of the highest 2% of activity in the image dataset. The size of perfusion defects is quantified as the fraction of the whole cardiac image outside 2.5 SDs or 97.5% confidence intervals of controls in each quadrant and whole heart. The combined size and severity of perfusion defects are defined as the percentage of the whole cardiac image with relative activity of less than 60% of maximum activity (100%), which is 3.0 SDs below the mean maximum activity of controls.
Because the stress emission images were reconstructed using the poststress cine CT scan as previously reported, only the resting images required quantitative comparison of rest cine CT attenuation data with stress cine CT attenuation data.
Statistical Methods
Statistical analyses were performed using SPSS software, version 11.5 (SPSS Inc.), for significance of differences in continuous variables among groups determined by paired 2-tailed t tests with data reported as mean ± 1 SD. A 2-tailed P value of less than 0.05 was considered statistically significant. For comparison of the histograms of diaphragmatic position on rest and stress CT scans, skewness tests for normality and a paired t test for significance of differences were performed using Stata 10 (StataCorp LP).
RESULTS
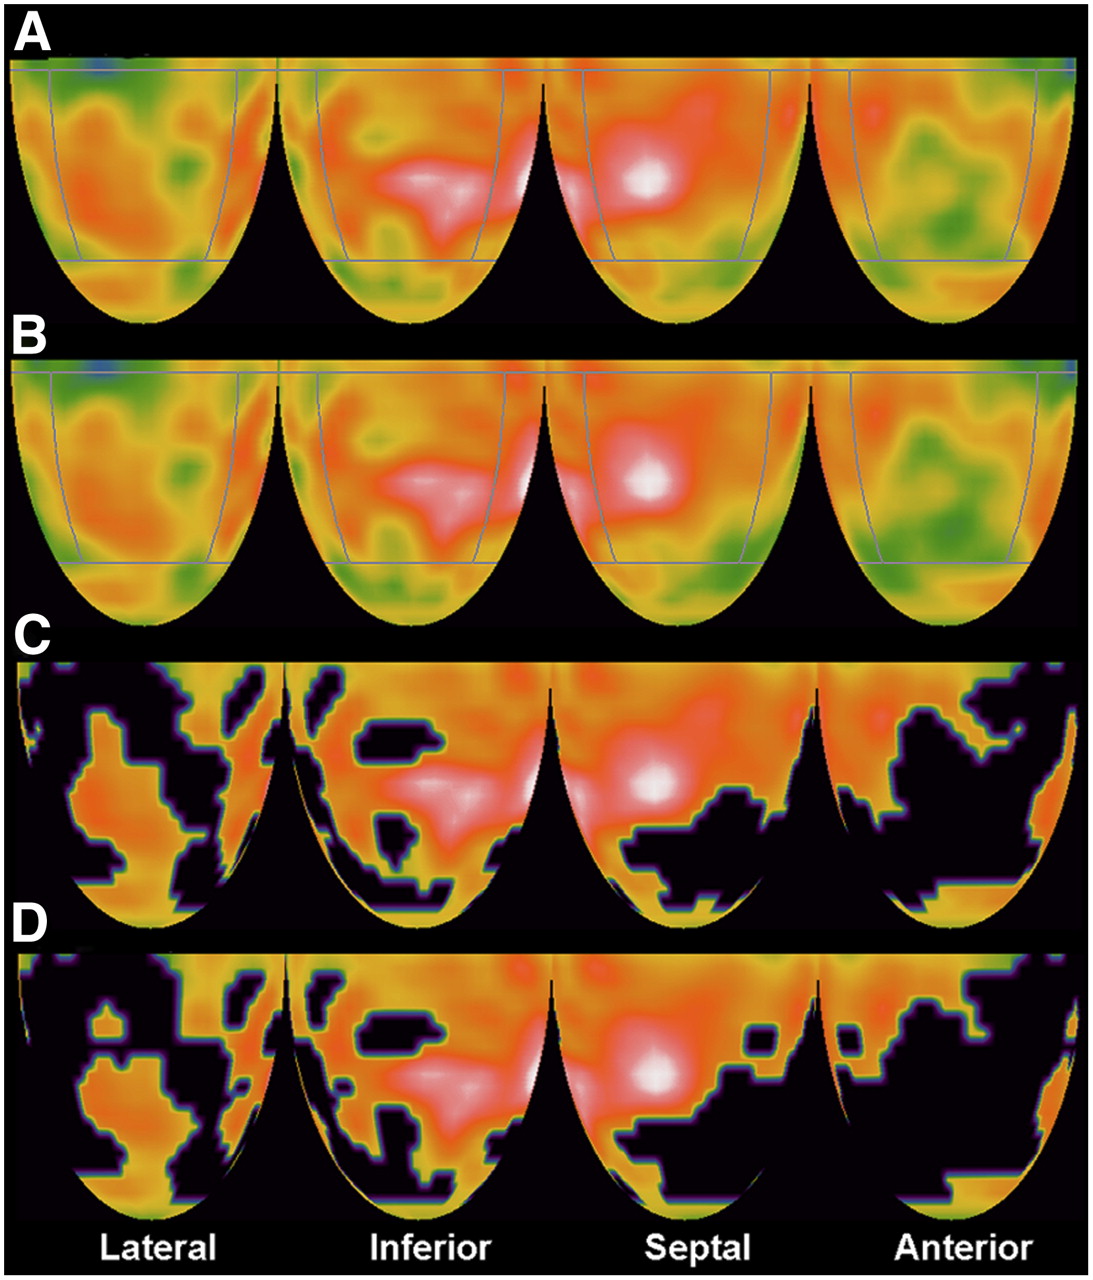
Figure 1 illustrates quantification of resting perfusion scans reconstructed using rest cine CT attenuation data compared with reconstruction with stress cine CT data in a patient with separate lateral and anterior myocardial scars. Panel A shows lateral, inferior, septal, and anterior quadrants of the rest image reconstructed with rest cine CT attenuation data for which normalized mean activity was compared with panel B, showing rest images reconstructed with stress cine CT attenuation data. The anterior quadrant has the minimum mean quadrant activity containing the resting worst perfusion defect, defined as the severity of the defect. Panel C shows the resting perfusion image reconstructed using resting cine CT attenuation data with blackout of areas outside 2.5 SDs of normal for each whole-heart dataset (all quadrants), here comprising 39% of the left ventricle. Panel D shows the resting perfusion image reconstructed with stress cine CT data, with blackout of areas outside 2.5 SDs of normal of comparable size comprising 41% of the left ventricle.

(A) Topographic 3-dimensional displays of resting perfusion images by cine PET/CT reconstructed with resting cine CT data showing moderate anterior and basal lateral defects with diffuse resting perfusion heterogeneity characteristic of diffuse CAD. White indicates highest myocardial uptake of 82Rb, reflecting highest myocardial perfusion, with red being next highest and progressively lower perfusion indicated by color gradations from red to yellow, green, and blue to black as lowest activity. (B) Same resting perfusion images as in A reconstructed with stress cine CT data showing minimally visible differences from images reconstructed with rest cine CT attenuation data. (C) Blackout of pixels outside 2.5 SDs of normal controls, comprising 39% of left ventricle of rest perfusion image in A reconstructed with rest cine CT attenuation data. (D) Blackout of pixels outside 2.5 SDs of controls, comprising 41% of left ventricle of rest perfusion image in B reconstructed with stress cine CT attenuation data.
Table 1 quantifies comparison of resting images reconstructed with rest cine CT versus stress cine CT attenuation data. There are no statistically significant differences for most of the quantitative comparisons. Although some of the differences are statistically significant (image pairs 2, 4, and 5) because of a large number of subjects with a relatively narrow range of values, the differences are so small as to be clinically insignificant. For example, the average inferior quadrant normalized activities for the 2 rest images were 80.8% ± 4.6% and 80.3% ± 4.5% of maximum activity, which was significantly different, at P < 0.0005. However, this small difference is of no clinical consequence, is not visually apparent, and did not alter clinical interpretation.
Quantitative Comparison of Rest Perfusion Images Reconstructed with Rest and Stress Cine CT Data
In 25 (10%) of the 250 cases, the stress cine CT data did not coregister correctly with resting emission data, thereby causing an associated artifactual abnormality. This misregistration artifact disappeared after shifting of the stress attenuation data to obtain proper coregistration with the resting emission data, as previously reported (11).
In addition to a comparison of continuous quantitative variables in Table 1, the data were analyzed for discrete differences in the number of resting images reconstructed with stress cine CT attenuation data that were outside the limits (mean ± 2.5 SDs) of the resting images reconstructed with resting CT attenuation data. For severity of perfusion defect expressed as the minimum average quadrant activity, the rest image reconstructed with stress cine CT attenuation data for 3 of 250 patients (1.2%) was outside 2.5 SDs of the mean of the rest images reconstructed with rest cine CT attenuation data. For size of perfusion defect (fraction of left ventricle outside 2.5 SDs of controls) and for combined size and severity (percentage of the left ventricle outside 60% of maximum activity), no resting images reconstructed with stress cine CT attenuation data were outside 2.5 SDs of the mean of these endpoints for rest images reconstructed with rest cine CT attenuation data.
To assess further the suitability of rest scans reconstructed with stress cine CT attenuation data, we also measured the change in average position of the dome of the right diaphragm on the rest cine CT compared with stress cine CT. Although the attenuating structures of the entire thorax change with respiration, the position of the dome of the right diaphragm serves as an easily measured index of differences in respiratory cycles on CT scans acquired at different times uncomplicated by the heart over the left diaphragm. Cine CT images the average diaphragm position for 2–3 breathing cycles during the 78-s cine CT scan.
As illustrated in Figure 2A, the vertical distance between the dome of the right diaphragm and the zero reference slice of the stress (panel A) and rest (panel B) cine CT scans were measured to determine the difference in mean diaphragm position between the 2 CT scans. A positive difference indicates that the mean diaphragm position on the stress cine CT scan was higher than or superior to the rest cine CT scan. A negative difference indicates that the mean diaphragm position on the stress cine CT scan was lower than or inferior to the rest cine CT scan. These diaphragmatic measurements were made on unshifted cine CT images.
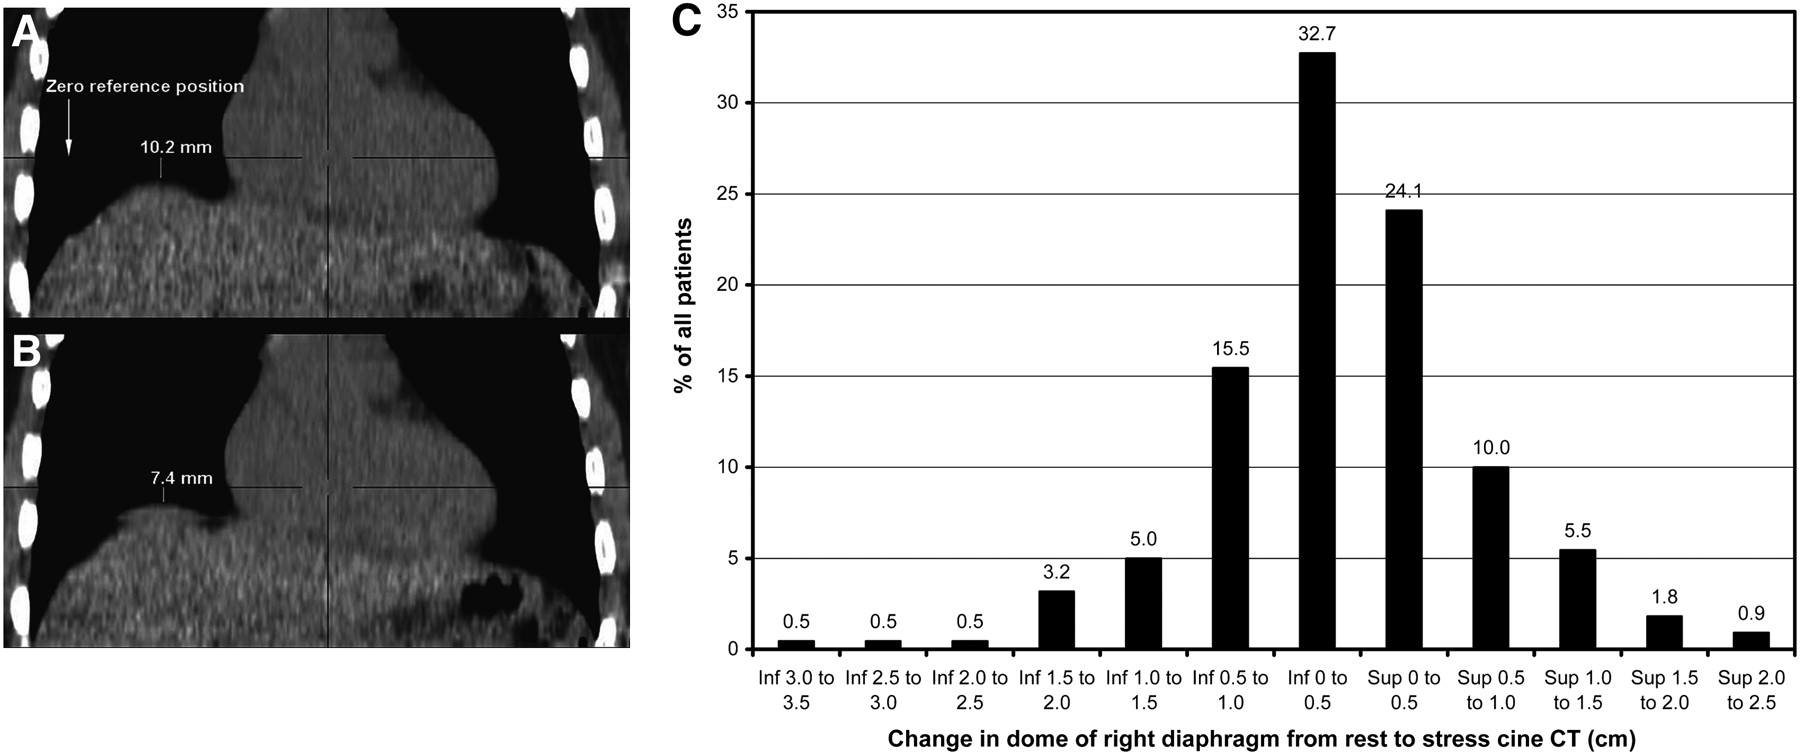
Stress cine CT scan (A) and rest cine CT scan (B) with measurement of distance from dome of right diaphragm to zero reference slice of CT that is same for both CT scans. (C) Histogram of differences in diaphragm position between rest and stress CT scans. Inf = inferior; sup = superior.
The distribution of the differences in mean diaphragm position on rest cine CT and stress cine CT scans, with their sign indicating a superior or inferior relation, are graphed as a frequency histogram in Figure 2B, expressed as percentage of the total cases. Any systematic difference would cause an asymmetric histogram to either the right or the left of the bell-shaped curve, indicating that mean diaphragmatic position on the stress cine CT scan was above or below the mean diaphragmatic position on the rest cine CT scan.
The symmetric bell-shaped distribution indicates visually no systematic difference in mean diaphragmatic position on rest and stress cine CT scans, confirmed by statistical analysis. A paired-sample t test found that the mean diaphragmatic positions were not statistically different (P = 0.12). The skewness of the differences was −0.3, which was not statistically different from a healthy population (P = 0.065), implying that the distribution is symmetric. Although there was no systematic difference in the position of the dome of the right diaphragm on rest, compared with stress cine CT scans, individual patients may have shown rest–stress differences as evidenced by the bell-shaped curve in Figure 2B. As needed, any attenuation–emission misregistration on the fusion images was corrected by shifting the cine CT images to achieve coregistration.
Table 2 shows the radiation dose (mGy) and dose equivalent (mSv) to patients for 3 protocols for acquiring CT attenuation data: a standard protocol of a helical CT scan (200 mA) at rest and after stress; a protocol of resting and stress cine CT plus the obligatory low-dose helical CT scan (100 mA) required to complete the Discovery ST PET/CT image acquisition not used for attenuation correction of emission data; and a protocol of a single stress cine CT scan plus a low-dose obligatory helical CT scan (100 mA) required to complete the Discovery ST PET/CT image acquisition not used for attenuation correction of emission data. The radiation dose and effective dose equivalent for a single standard helical CT scan (200 mA) for the settings defined in the Materials and Methods are 5.7 mGy and 1.33 mSv, respectively, and for a rest-plus-stress helical scan is 11.4 mGy and 2.66 mSv, respectively. The radiation dose and effective dose equivalent for a single cine CT are 10 mGy and 2.36 mSv, respectively, for the settings defined. The radiation dose and effective dose equivalent of the low-dose (100 mA) single obligatory helical CT scan necessary to complete the Discovery ST PET/CT acquisition are 2.9 mGy and 0.67 mSv, respectively, for the settings defined.
Radiation Dose and Dose Equivalent from different Protocols for Acquiring CT Attenuation Data
Although the rest-plus-stress cine CT protocol eliminates misregistration artifacts, it incurs a greater radiation dose and radiation-equivalent dose to patients—doses totaling 22.9 mGy and 5.39 mSv, respectively, compared with the dose of the rest-plus-stress helical CT protocol, totaling 11.4 mGy and 2.66 mSv. However, for the single poststress cine CT protocol with the low-dose single obligatory CT scan, the total radiation dose and effective dose equivalent are reduced by 50% to 12.9 mGy and 3.03 mSv, respectively, comparable to the rest-plus-stress helical CT protocol.
In principle, radiation dose could be reduced further by shortening the duration of each single-component cine scan from 10 s, used here, to 6 s, thereby reducing the cine CT dose by another 0.94 mSv (8,9) and lowering the cine CT dose from 2.36 mSv to 1.42 mSv. Based on unpublished data, a single-component cine CT scan of 6 s would bracket 2 respiratory cycles in approximately 90% of patients. However, in 10% of patients the cine CT might acquire partial or incomplete average attenuation data from incomplete respiratory cycles, thereby biasing the attenuation correction data. Because consistency and reliability across a wide spectrum of patients and respiratory rates are essential for clinical applications, shortening the scan time of the single-component cine CT scan below 10 s is not optimal clinically in our view. Lowering the amperage of the obligatory first helical scan required by the Discovery ST operating software to less than 100 mA would further reduce radiation dose. However, a lower amperage degrades the images sufficiently to preclude assessing coronary calcification or using the initial helical scan for attenuation correction in the rare instance of the cine CT scan being technically unsatisfactory.
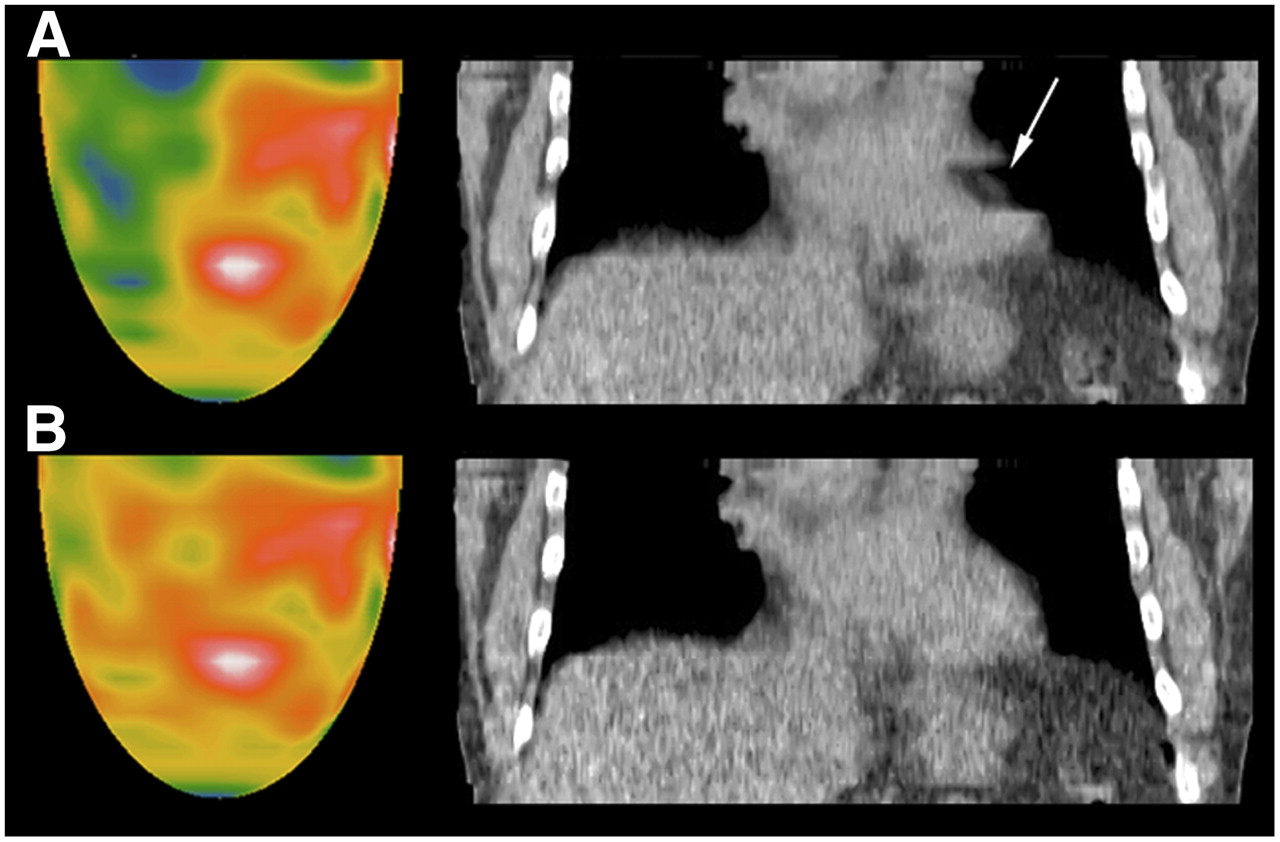
Despite cine CT and shifting of the attenuation data to achieve correct coregistration, 2 patients of the 250 had PET misregistration artifacts that were due to patients taking a single deeper breath or sigh during their normal shallower breathing pattern during cine CT acquisition. Figure 3A shows a severe lateral artifactual defect on resting images corresponding to the gap in the cine CT scan with lateral misregistration of a localized segment of the basal lateral left ventricular wall. This lateral artifactual defect disappeared after we corrected the segmental misregistration by removing the CT data acquired during the single bigger breath and used the remaining CT data during the rest of the breathing cycles to reconstruct the emission images.

Resting perfusion images by cine PET/CT showing severe lateral perfusion defect (A) that is artifact due to segmental gap of misregistration shown by arrow on coronal CT view caused by patient taking single sigh or bigger breath than normal shallower breathing during CT attenuation scan. This artifact disappears (B) after removing attenuation data during bigger breath and using attenuation data acquired during remaining normal breathing cycles.
DISCUSSION
In cardiac helical PET/CT, misregistration artifacts that are false-positive results may occur in up to 40% of patients because of the standard short helical CT scan acquiring attenuation data at one moment during the respiratory cycle that does not match the average attenuating structures during the 5-min or longer emission imaging with normal breathing (11). Moreover, variable attenuation correction associated with respiratory motion causes marked heterogeneity in quantitative measurements of relative and absolute myocardial radionuclide uptake (5). Therefore, measurements of absolute myocardial perfusion in cm3/min/g by PET/CT is appropriate only if the primary radionuclide update data are correctly obtained using cine or shifted cine CT attenuation correction that matches the average attenuation structures of emission data obtained over longer times during breathing.
These misregistration artifacts are eliminated by cine CT attenuation data and as needed in some cases by shifting the cine CT attenuation data for optimal coregistration (11). However, the radiation dose to patients with rest-plus-stress cine CT scans is more than that with rest-plus-stress helical CT scans. Our data show that the radiation dose can be substantially reduced and made comparable to the rest–stress helical CT protocol by a single stress cine CT for reconstructing both the rest and the stress emission images while preserving the quantitative quality of rest perfusion images. High-quality resting perfusion images are particularly important for measuring absolute myocardial perfusion and coronary flow reserve.
Our quadrant displays are based on 30 y of experience with cardiac PET and substantial publications on quantifying PET perfusion defects routinely as an essential component of our clinical and research service (10–21). Using the quadrant display and analysis, we have more peer-reviewed publications on changes in PET perfusion images after lipid lowering or lifestyle treatment (15–19) than any other center in our knowledge. We have also published the only detailed map of myocardial perfusion anatomy by PET down to tertiary branches in more than 1,000 patients undergoing coronary arteriography (14). In our view, the multiple, small pie-segment bull's-eye display artificially compartmentalizes and distorts the myocardial image unrelated to the branching coronary tree structure and unrelated to the longitudinal base-to-apex perfusion gradient characterizing diffuse CAD (20). Accordingly, our reading and quantification of whole quadrants of the PET image provides more reliable consistent quantification and interpretations for each specific coronary artery than does smaller compartmentalization, which is subject to greater variability, greater reported interobserver variability, and less accuracy for assessing changes or quantifying abnormalities over and above the inherent noise of nuclear images.
The study had some limitations. Most current commercial PET/CT scanners lack appropriate hardware or software for cine CT. Some have cine CT capacity but average the cine CT data with the helical CT data, thus biasing the cine CT data, and lack the capacity for fusion images using the averaged cine-helical PET/CT data for visually assessing and correcting misregistration. Alternatively, a non-CT pure PET scanner with a 3-rod rotating attenuation source acquires attenuation data rapidly without the relatively high radiation dose of PET/CT, thereby providing the basis for an inexpensive fast PET scanner for cardiac imaging. The radiation dose from a rotating rod attenuation source is much lower at 0.13 mSv (27) than is the dose from a CT scan for attenuation data.
Cine CT optimizes cardiac PET/CT by eliminating misregistration artifacts but is suboptimal for assessing extracardiac structures. In view of the trade-offs between images optimized for cardiac versus extracardiac structures, we prefer to optimize the cardiac images at the lowest radiation dose and refrain from formal reading of extracardiac structures, for which cine CT is suboptimal. If clinically indicated, the settings for the obligatory helical CT scan necessary for completing image acquisition may be set for better assessing extracardiac structures but incur increased radiation dose.
Commonly, a separate helical CT scan is done for scoring coronary calcification, which uses different settings, is electrocardiography-gated, and cannot be applied for attenuation correction in the PET/CT protocol. It therefore adds a radiation dose that is approximately the same as that from the rest or stress helical CT scan at 200 mA (Table 2). In our view, the low-dose obligatory helical scan in the cine PET/CT protocol provides sufficient visualization of coronary calcification to enable a qualitative visual judgment on mild, moderate, dense, limited, or extensive coronary calcification. Essential clinical information is provided without the added radiation dose incurred in the separate procedure for obtaining a calcium score, which adds little clinical value to the visual grading.
CONCLUSION
In cardiac PET/CT using rest and stress helical CT, common artifactual defects and false-positive results due to attenuation–emission misregistration are eliminated by cine CT acquisition for attenuation correction. However, rest–stress cine CT incurs a higher radiation dose than do the corresponding rest–stress helical CT protocols. The radiation dose in cine CT is substantially reduced while retaining comparable quantitative image quality by using a single cine poststress CT for attenuation correction of rest and stress emission images with software for manually coregistering attenuation–emission data if needed. Properly coregistered PET/CT provides definitive perfusion images at an acceptable radiation dose for assessing the severity of CAD, for following its regression or progression, and for identifying mild early nonobstructive coronary atherosclerosis as the basis for intense, lifelong pharmacologic and lifestyle management (10–26).
Footnotes
-
COPYRIGHT © 2008 by the Society of Nuclear Medicine, Inc.
References
- Received for publication November 15, 2007.
- Accepted for publication January 6, 2008.


Jump to section
Related Articles
Cited By...
- Optimal Adenosine Stress for Maximum Stress Perfusion, Coronary Flow Reserve, and Pixel Distribution of Coronary Flow Capacity by Kolmogorov-Smirnov Analysis
- Variation in Quantitative Myocardial Perfusion Due to Arterial Input Selection
- Effective Dose of PET/CT in Informed Consent Forms
- Impact of Unexpected Factors on Quantitative Myocardial Perfusion and Coronary Flow Reserve in Young, Asymptomatic Volunteers
- Does Coronary Flow Trump Coronary Anatomy?