


Abstract
The purpose of this study was to investigate whether 18F-FDG PET/CT can be used for in vivo chemosensitivity testing and to determine the optimal time point for observation. Methods: Forty-two rabbits with 84 implanted VX2 squamous cell tumors were randomized into a control group (n = 10) and a treatment group (n = 32). 18F-FDG PET/CT was performed the day before intravenous administration of cisplatin (4 mg/kg) and at 95–100 min (day 0), day 1, day 7, and day 14 afterward. In the control group, 18F-FDG PET/CT images were acquired at the same time points but without cisplatin administration. Maximum standardized uptake value (SUV) and mean SUV were analyzed. On the basis of tumor volume, we categorized animal tumors into a sensitive group and an insensitive group. If tumor volume doubled by day 7, the tumor was considered insensitive. Results: On day 0, maximum SUV and mean SUV were significantly different between the sensitive group and the insensitive and control groups (P < 0.05 for both). In the sensitive group, the average change from the pretherapy values was −48.96% ± 12.27% for maximum SUV and −51.63% ± 10.45% for mean SUV. SUV did not significantly differ between the groups at any other points (days 1–14). On day 0, tumor volume was not significantly different between the control group and the sensitive or insensitive groups. After cisplatin administration, the size of the VX2 xenograft tumors increased slowly. Tumor necrosis fractions on days 7 and 14 were significantly greater in the sensitive group than in the insensitive or control group. Viable tumor cells on days 7 and 14 were less numerous in the sensitive group than in the insensitive or control group. A significant difference in inflammatory cells was seen between the sensitive and insensitive groups on days 7 and 14 (P < 0.05 for both). No significant differences in inflammatory cells or viable tumor cells were seen between the insensitive and control groups at any time points from before therapy to day 14 (P > 0.05 for all). A slight increase in viable tumor cells and inflammatory cells was seen in the sensitive group on day 14, compared with day 7. Conclusion: When 18F-FDG was injected as early as 40 min after administration of chemotherapy, PET showed significantly decreased in vivo uptake of the tracer in chemoresponsive tumors. This finding suggests that 18F-FDG PET may be able to discriminate sensitive from insensitive tumors if the imaging is performed immediately after a test dose of chemotherapy. The optimal observation time and methodology for various chemotherapy–tumor combinations will need to be studied to confirm whether this approach can be generalized.
The treatment of cancer has improved greatly because of the curative effect of combining adjunctive therapy with a main course of chemotherapy. However, tumors are widely heterogeneous. Different tumors may have different sensitivities to chemotherapy even if the tumors are of the same pathologic type and the same degree of differentiation. Therefore, the curative effect of chemotherapy on cancer is rather low as a whole. Furthermore, most chemotherapeutic drugs have toxic side effects. Incorrect treatment may cause severe toxicity and resistance, which can then lead to treatment failure. The curative effect of chemotherapeutic agents can be improved through guidance from chemosensitivity testing. But to date, sensitivity tests have been in vitro and thus not reflective of the true in vivo effect of a drug. It is therefore highly desirable that a sensitive, easily repeatable, and noninvasive in vivo testing method be developed to allow early differentiation of sensitive tumors from insensitive tumors and to guide oncologists in choosing the best chemotherapeutic agent for an individual patient.
PET integrated with CT has emerged as a clinical cornerstone in cancer staging and restaging for many malignancies. This method is one of the few molecular imaging technologies approved by the U.S. Food and Drug Administration (1). 18F-FDG is a glucose analog that is selectively taken up by cells that have a high rate of glucose metabolism—a distinguishing feature of malignant cells. Many recent studies have demonstrated the potential role of 18F-FDG PET in the early monitoring of therapy for a variety of cancers (2–10). The use of 18F-FDG PET could help improve the management of cancer patients by avoiding the administration of several rounds of chemotherapy with limited efficacy. However, an unsolved and critical issue in this use of 18F-FDG PET is the optimal earliest time to obtain the scan after chemotherapy or radiotherapy. The timing is critical because an inflammatory reaction may obscure the therapeutic effects. To investigate whether 18F-FDG PET/CT can be used for in vivo chemosensitivity testing and to determine the optimal time point for observation, we studied the time-dependent relationship between cisplatin chemotherapy and 18F-FDG uptake, as well as pathologic changes in the VX2 tumor model.
Cisplatin is a chemotherapeutic drug commonly used for testicular, bladder, pulmonary, esophageal, gastric, and ovarian cancers. For our experiment, we selected the VX2 rabbit tumor model, a Shope papillomavirus–associated VX2 carcinoma (11) implanted into immune-competent rabbits. Because of variation in immune response, some of the tumors are more sensitive to cisplatin than others. The tumor grows rapidly and reaches a size that is easily identified by imaging. The high glycolysis rate of the tumor is characteristic of advanced-stage tumors. This animal model has been widely used to evaluate the curative effects of anticancer drugs and new treatment devices (12–16). Some researchers have already demonstrated that transplanted VX2 tumors can be evaluated by 18F-FDG PET (17,18).
MATERIALS AND METHODS
All experiments were approved by the Laboratory Animal Sciences Center of Shanghai JiaoTong University. This study used 48 male New Zealand rabbits 3–4 mo old and weighing 2.0–2.5 kg.
Preparation of VX2 Tumor Model
Each rabbit received general anesthesia with 3% pentobarbital, 30 mg/kg, through an indwelling catheter in the auricular vein. The VX2 tumor was surgically removed from a donor rabbit under general anesthesia and minced into 1-mm3 pieces with a pair of scissors. After receiving anesthesia, the recipient rabbit was fixed supine onto the operating table. Two 1.0-cm-deep tunnels were made bilaterally into the skin of the front chest, and one or two 1-mm3 pieces of VX2 tissue were implanted into each tunnel. The incisions were closed with 3.0 sutures. When the tumors had grown to approximately 10–20 mm in diameter, the rabbit was used in the experiment.
Experimental Design
Of the 48 rabbits, 6 were used as donor rabbits and the other 42 (with 84 tumors, measuring 10–20 mm) were randomly divided into 2 groups. Ten rabbits served as untreated controls, and 32 received the chemotherapy. In the treated animals, cisplatin was intravenously administered at a single dose of 4 mg/kg. 18F-FDG PET/CT was performed the day before that administration and at 95–100 min (day 0), 1 d, 7 d, and 14 d afterward. In the control group, 18F-FDG PET/CT images were acquired at the same time points but without cisplatin administration.
Design of Cisplatin Dose
Using the guidance of the Food and Drug Administration (19) on converting animal doses to human-equivalent doses in estimating the safe starting dose for clinical trials, we calculated the dose in rabbits (mg·kg−1) as Da(Kb/Ka)(Wa/Wb)1/3, where Da is the dose in humans (mg per person) (19), K is the coefficient of body type (Ka [humans] = 0.1057 and Kb [rabbits] = 0.1014), and Wa and Wb are body weights in humans and rabbits, respectively (kg). Clinically, a large dose of cisplatin chemotherapy in humans is 80–120 mg/m2, which when converted to a rabbit dose is 6.83–10.24 mg/kg.
Our experimental dose of 4 mg/kg was low for a rabbit. The rationale for our selecting this dose is that drug-sensitive tumors show a monotonic relationship between dose and response; that is, a higher dose creates a greater effect. However, the administered dose should be under a certain limit because of side effects. In our preliminary experiment, the human-equivalent cisplatin dose of 10 mg/kg usually killed the animal because of side effects. Because our aim was to investigate whether 18F-FDG PET/CT can be used for in vivo testing of chemosensitivity, we accepted a low dose of 4 mg/kg for the study.
18F-FDG PET/CT Imaging
All animals were kept fasting at least 6 h before undergoing 18F-FDG PET/CT. The rabbits were given a combination of anesthesia consisting of intravenous pentobarbital, 30 mg/kg, and intramuscular Sumianxin (846 compounds; Academy of Military Medical Sciences, ChangChun, JiLin, China), 1 mL/kg. After anesthesia, the rabbits were positioned prone using a handmade holding device. 18F-FDG (37 MBq/kg) was administered via the auricular vein, and PET/CT images were acquired 55–60 min afterward on a Discovery LS PET/CT system (GE Healthcare Bio-Sciences Corp.). The acquisition took place before cisplatin treatment and 0, 1, 7, and 14 d afterward. On day 0, the rabbits received the cisplatin and then 40 min later the 18F-FDG, and the images were acquired at 55–60 min after 18F-FDG injection. The CT component was performed using a multidetector scanner before the emission component. The parameters included 140 kV, 80 mA, 0.8 s per CT rotation, a pitch of 5.0 mm, and a table speed of 22.5 mm/s. The PET data were acquired in the same anatomic locations, at 5 min per bed position. The measured spatial resolution (full width at half maximum of the line spread function) was 4.25 mm. A postprocessing filter of 5.45 mm and loop filter of 3.91 mm were applied. The PET images were reconstructed using CT for attenuation correction and reconstruction with an ordered-subsets expectation maximization algorithm. The images were fused using commercially available software (Xeleris; GE Healthcare Bio-Sciences Corp.).
PET Image Interpretation and Data Analysis
The plane in which the tumor appeared largest on the CT image was selected at the Xeleris workstation. An irregular region of interest covering the whole tumor on CT was drawn and then copied to PET in the same image mirror. The maximum and mean standardized uptake values (SUVs) were determined, and changes in these values were calculated as (SUV0 − SUVpre)/SUVpre, where SUV0 is the maximum or mean SUV on day 0 and SUVpre is the maximum or mean SUV at baseline, before administration of chemotherapy.
Tumor Volume Calculation
Tumor volume (mm3) was determined by CT measurement of the maximum perpendicular diameters of the short and long axes of the tumor and was calculated as d1 × d2 × d3 × π/6, where d1 is the longest diameter of the tumor, d2 is the longest diameter perpendicular to d1, and d3 is the height of the tumor.
If a tumor doubled in volume by day 7, it was included in the insensitive group. Likewise, if a tumor did not double in volume by day 7, it was included in the sensitive group.
Histopathologic Examination
On days 0, 1, 7, and 14, after PET/CT the tumors of 1 rabbit were excised, measured, cut open across the maximum dimension, and measured across that section. The necrotic area was also measured, and the necrotic fraction was calculated as the necrotic tumor area divided by the total tumor area.
The specimens were fixed with 10% formalin, transaxially sliced, embedded in paraffin, sectioned at 4 μm thick with a microtome, and stained with hematoxylin and eosin for histopathologic examination. All histologic slides were reviewed by 2 pathologists, who randomly chose 1 of 5 high-power fields to count (upper left, upper right, lower left, lower right, or middle). The inflammatory cells were counted under a ×400 high-power field, and the average percentage was calculated.
Statistical Analysis
The software package SAS, version 6.12 (SAS Institute), was used. Data were expressed graphically as the mean ± SEM of the different variables. Univariate repeated-measures ANOVA was conducted for maximum and mean SUV. Analysis of the necrotic fraction, of decreases in the rates of maximum and mean SUV, and of the percentage of inflammatory cells was performed by 1-way ANOVA. A P value of less than 0.05 was considered statistically significant.
RESULTS
Changes in Tumor Volume Measured by Integrated CT
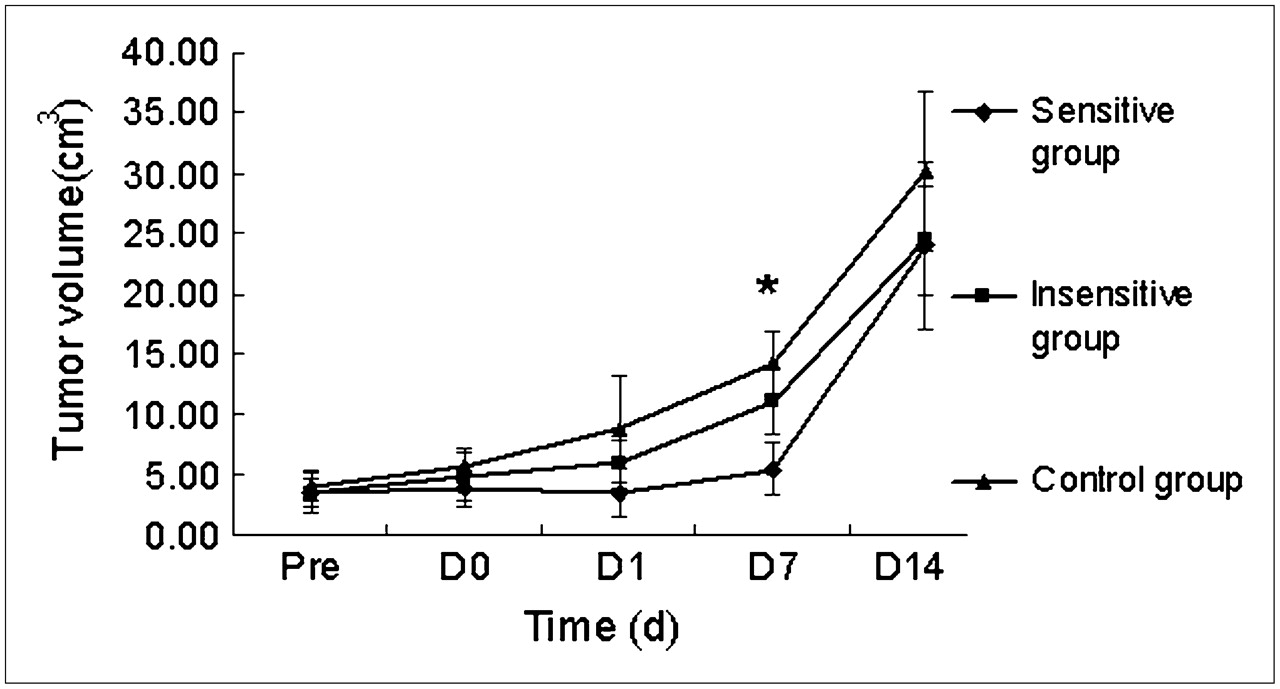
Before therapy, there was no significant difference in tumor volume among the 3 groups. The tumor volume in the 3 groups increased gradually on days 0 and 1, but no significant differences were seen among the groups at these time points. On day 7, volume was significantly lower in the sensitive group than in the insensitive and control groups. Volume did not significantly differ among the 3 groups on day 14 (Fig. 1).

Changes in tumor volume at various endpoints. Significant difference in tumor volume was seen between sensitive and insensitive groups on day 7 (*P < 0.05). No significant differences in tumor volume were seen among the 3 groups before therapy or on days 0, 1, or 14. Pre = before therapy; D0 = day 0; D1 = day 1; D7 = day 7; D14 = day 14.
Changes in SUV on 18F-FDG PET/CT
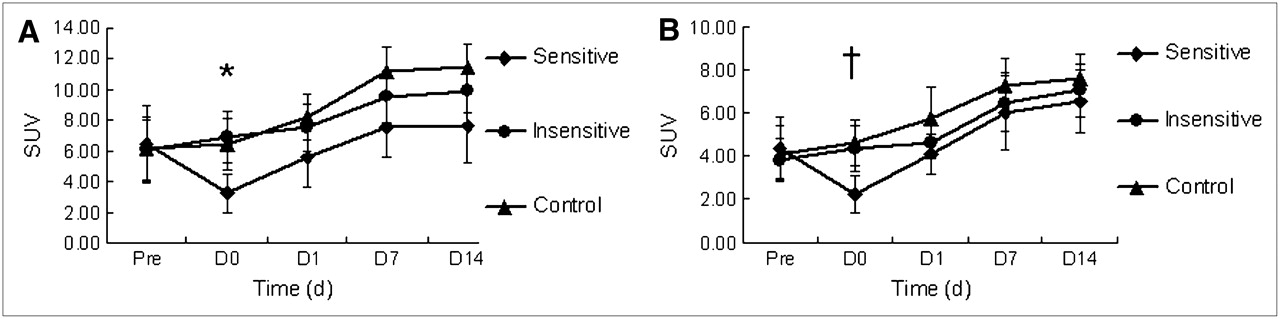
Maximum and mean SUV did not significantly differ between the treatment and control groups before therapy. However, there was an obvious decrease in maximum and mean SUV on day 0 in the sensitive group. The average change in maximum SUV in the sensitive, insensitive, and control groups was −48.96% ± 12.27%, 21.16% ± 18.26%, and 7.16% ± 13.47%, respectively. Mean SUV decreased in the sensitive group (−51.63% ± 10.45%) but increased by 15.80% ± 13.68% and 14.03% ± 16.02% in the insensitive and control groups, respectively (P > 0.05). A significant difference in maximum SUV (P = 0.0001) and mean SUV (P = 0.0001) was seen between the sensitive and insensitive groups on day 0. SUVs did not significantly differ between those 2 groups at any other time points (days 1–14), and SUVs did not significantly differ between the insensitive and control groups at any time point. SUVs in the control group gradually increased but, after day 7, reached a plateau or decreased slightly (Fig. 2).

Changes in maximum SUV (A) and mean SUV (B) at the various endpoints. On day 0, SUVs decreased markedly in sensitive group but only slightly in insensitive group. All increases occurred on day 1. On day 7, SUVs stabilized. *P = 0.0001. †P = 0.0001. Pre = before therapy; D0 = day 0; D1 = day 1; D7 = day 7; D14 = day 14.
Gross Histologic Findings
Fresh VX2 tumor tissue was gray before chemotherapy, with little central necrosis. Insignificant changes in the necrotic fraction were seen on days 0 and 1 in each group. But on days 7 and 14, necrosis was obvious in all 3 groups. The tumor wall became thinner, and the necrotic area larger, in the sensitive group than in the insensitive and control groups. The necrotic fraction on day 7 in the sensitive, insensitive, and control groups was 6.15% ± 1.03%/d, 2.02% ± 0.74%/d, and 2.70% ± 0.48%/d, respectively, whereas the necrotic fraction on day 14 was 5.21% ± 0.47%/d, 2.78% ± 0.37%/d, and 3.05% ± 0.31%/d, respectively. Statistically significant necrotic fractions were seen in the sensitive and insensitive groups or in the sensitive and control groups on days 7 and 14. The necrotic fraction did not significantly differ between the insensitive and control groups on days 7 and 14 (Table 1).
Necrotic Fraction on Days 7 and 14
Semiquantitative Analysis of Inflammatory Cells at the Various Endpoints
The average percentages of inflammatory cells at the various endpoints are shown in Table 2. The percentages did not significantly differ between the 3 groups before therapy or on days 0 or 7. On days 7 and 14, the percentage of inflammatory cells was 17.83% ± 3.5% and 33.83% ± 2.83%, respectively, in the sensitive group and 2.00% ± 0.33% and 17.50% ± 3.33%, respectively, in the insensitive group. A significant difference in inflammatory cells was seen between the sensitive and insensitive groups on days 7 and 14. No significant difference in inflammatory cells was seen between the insensitive and control groups on day 7 or 14. A slight increase in viable tumor cells and inflammatory cells was seen in the sensitive group on day 14, compared with day 7.
Semiquantitative Analysis of Inflammatory Cells in Histologic Sections
18F-FDG Uptake Versus Microscopic Findings
The accumulation of 18F-FDG in tumor lesions before the administration of cisplatin was obvious. Large quantities of viable tumor cells were seen in the section (Fig. 3A). On day 0, a decrease in 18F-FDG uptake was obvious in the sensitive group (Fig. 3B). Uptake was slightly greater in the insensitive group than in the control group, but no conspicuous difference was found microscopically between the groups. On day 1, uptake in the sensitive group recovered gradually to almost the same level as before cisplatin administration. Only swelling and pyknosis of tumor cells were seen microscopically in the sensitive group (Fig. 3C). On day 0, uptake was slightly less in the insensitive group than in the control group but still exceeded the level before therapy. Microscopically, tumor cells were the same before therapy and on day 0. Inflammatory cells and a large quantity of necrotic tumor cells were seen on days 7 and 14 in the sensitive group, and viable tumor cells were fewer than in the insensitive and control groups (Figs. 3D and 3E). The percentage of inflammatory cells was 17.83% ± 3.50% on day 7 and 33.83% ± 2.83% on day 14. Uptake on day 7 increased and finally peaked and on day 14 plateaued in the 3 groups. However, no conspicuous differences were found microscopically among the 3 groups.

PET images, CT images, and hematoxylin- and eosin-stained histologic sections from sensitive group. (A) Before cisplatin therapy, 18F-FDG accumulated in tumor lesion, and large quantity of viable tumor cells was noticeable. Tumor cells reordered divergence and formed cancer nest. (B) On day 0, 18F-FDG uptake decreased greatly, but no evident pathologic changes were observed on histology. (C) On day 1, 18F-FDG uptake recovered gradually, and tumor cell swelling and pyknosis were seen on histology. (D) On day 7, 18F-FDG uptake increased gradually, and abundant inflammatory cells and necrotic cells were seen in sensitive group. Number of viable tumor cells was fewer than in insensitive and control groups on day 7. (E) On day 14, tumor volume had increased, and new metastasis was seen in right tumor. Abundant necrosis and inflammatory cells were seen in sensitive group. HE = hematoxylin and eosin; SUVmax = maximum SUV; SUVmean = mean SUV.
DISCUSSION
As a noninvasive tool to monitor the effects of chemotherapy and radiotherapy, 18F-FDG PET/CT has many unique advantages (20). Many studies have demonstrated that 18F-FDG PET is sensitive for monitoring the response of tumors early after chemotherapy and radiotherapy (2,21–23). Few studies, though, have used this metabolic method in vivo to test for sensitivity to chemotherapeutic drugs. Our study demonstrated that metabolic measurements using 18F-FDG PET/CT can distinguish sensitive from insensitive tumors in vivo as early as 1–2 h after intravenous administration of cisplatin. In clinical practice, “early” is usually defined as 14 d after the start of systemic chemotherapy or after the first or second round of chemotherapy. Although 18F-FDG PET is useful for classifying chemosensitivity and monitoring chemotherapy, the time window for observing differences in 18F-FDG uptake is critical. We observed a difference only on day 0. Hence, if the sensitive observation window is lost, a researcher or physician may get incorrect results. Wakatsuki et al. found that, in rabbits, the blood level of cisplatin peaks at about 20 min (13), and we chose to monitor for 100 min after the administration of cisplatin to observe early metabolic changes in individual rabbits. Because no significant differences were observed on days 1, 7, or 14, we recommend that observation take place earlier than those time points. Our finding of the criticality of early observation was also found by Su et al. (24). In their study, a spectrum cell line was cultured and established in tumor xenografts in mice to study whether 18F-FDG PET could be used to monitor epidermal growth factor receptor inhibitors of treatment-induced glucose changes. Su et al. found a dramatic decrease in 18F-FDG uptake as early as 2 h after treatment. These metabolic alterations preceded changes in cell cycle distribution, thymidine uptake, and apoptosis. Small-animal PET studies showed a decrease of up to 55% in tumor 18F-FDG uptake in sensitive xenografts within 48 h.
In this study, we also quantitatively and histopathologically investigated the contribution of tumoral and nontumoral components to the time-dependent uptake of 18F-FDG after cisplatin therapy in sensitive, insensitive, and control groups. 18F-FDG uptake on days 0 and 1 showed viable tumor cells, which are almost the only cell population present at that time. However, on day 7 a profound morphologic alteration was found in the sensitive, insensitive, and control groups, with necrosis and infiltration of inflammatory cells. However, the percentage of inflammatory cells on day 7 in the sensitive group was 17.50% ± 3.33%, slightly greater than that in the insensitive group (2.00% ± 0.33%) and the control group (3.00% ± 1.00%). On day 14, the percentage of inflammatory cells in the sensitive, insensitive, and control groups was 33.83% ± 2.83%, 17.50% ± 3.33%, and 18.00% ± 6.67%, respectively. Day 0 was found to be the optimal early observation time in our experiment. At that point, there is little inflammatory reaction and 18F-FDG uptake reflects the actual response of the tumors to cisplatin chemotherapy.
Early after the administration of chemotherapy, 18F-FDG PET/CT can differentiate between sensitive and insensitive tumors on the basis of a rapid and significant decrease in glucose metabolism by tumors. Several clinical studies have presurgically investigated the relationship between 18F-FDG uptake and the disease-free survival and prognosis of a cancer patient. These studies have confirmed that early changes in uptake are related to subsequent histologic tumor regression and increased survival (7,9,25–29). However, the criteria used to predict response have not been unified. Weber et al. prospectively evaluated the value of a therapy-induced reduction in tumor glucose use for predicting the subsequent response and survival of gastric cancer patients who received preoperative chemotherapy (30). The investigators demonstrated that a decrease in uptake by more than 35% of the baseline value allowed an accurate prediction of response as soon as 14 d after the initiation of chemotherapy. Avril et al. evaluated sequential 18F-FDG PET images to predict patient outcome after the first and third cycles of neoadjuvant chemotherapy in advanced-stage ovarian cancer. That study found an SUV decrease of 20% from baseline after the first cycle, and this criterion was more accurate than clinical or histopathologic response criteria (5,25). Our study demonstrated that after a dose of 4 mg of cisplatin per kilogram, the decrease in maximum and mean SUV in the sensitive group was 48.96% ± 12.27% and 51.63% ± 10.45%, respectively. In our preliminary study, we observed that in the sensitive group the least decrease in maximum SUV was 28.79% and the least decrease in mean SUV was 35.41%. Therefore, we inferred that an SUV decrease of 30% or more is a suitable criterion to judge whether individuals are sensitive or insensitive to particular chemotherapeutic drugs.
In our experiment, 18F-FDG PET/CT could discriminate between sensitive and insensitive tumors as soon as 1–2 h after administration of the 4 mg/kg dose of cisplatin. An early metabolic response on 18F-FDG PET/CT correlated significantly with subsequent tumor volume, tumor necrotic fraction, and histologic findings 7 d after cisplatin administration. Because of the rapid proliferation and invasiveness of the malignant tumor, the single low dose of cisplatin could not eliminate all viable tumor cells. The remaining tumor cells proliferated rapidly; tumor volume did not significantly differ between the sensitive and insensitive groups on day 14. On review of the pathologic histology, one can see that changes in the viability of tumor cells in the sensitive group after administration of cisplatin were few; one almost cannot discriminate between the sensitive and insensitive groups. Changes in tumor size as measured on CT were a late sign. Only by day 7 was there a distinction between sensitive and insensitive tumors.
These differences between the sensitive and insensitive groups after administration of cisplatin showed the exact individual discrepancies, and these responses of VX2 tumors to cisplatin chemotherapy were similar to those of human solid tumors. The VX2 tumor model in our experiment was squamous cell carcinoma, which originates from squamous epithelium (11,31), and this squamous carcinoma has a broad range of representations in human carcinoma in monitoring the treatment effects of chemotherapy or radiotherapy. When administered cisplatin, some tumors were sensitive to it and others were not. The fundamental mechanism of chemotherapy is complicated, and the existing normal immune system is likely the main reason for the variable sensitivity. We have also observed this phenomenon in clinical practice. Even if the same pathologic tumor type and the same degree of differentiation exist, responses to the same chemotherapy schedule may differ. The differences in response to cisplatin in this animal model can truly be reflected in vivo in an individual's response to a chemotherapeutic drug and can provide valuable information to the oncologist. This animal tumor model can be used to determine the optimal observation window and to distinguish inflammatory reactions, which may obscure 18F-FDG uptake. The method described in this report can guide oncologists in the development of truly personalized cancer treatment and carries significant clinical potential in the management of cancer patients.
The shortcomings of our experiment are those of our tumor model. These were animal experiments, and the time course of 18F-FDG uptake and inflammation might be quite different in humans. In addition, the behavior of 18F-FDG uptake in VX2 tumors might not be representative of that in other types of tumors.
CONCLUSION
Our findings suggest that when performed as soon as 1 h after the administration of chemotherapy, 18F-FDG PET/CT may be useful for the in vivo detection of chemosensitivity. The technique is sensitive and noninvasive, truly reflects tumor response to chemotherapy, and can guide oncologists in choosing the best chemotherapeutic option. However, further studies are needed to determine the optimal observation windows for the various chemotherapeutic drugs.
Acknowledgments
We thank Professor GuiXiang Zhang for the donor rabbits; Junfeng Feng, Dali Zheng, Shuqi Wu, Yanghua Xia, Zhiwei Gao, Weiwei Cai, Zhengyu Wang, and Kuiming Zhang for technical support; and Professor Ching-yee Oliver Wong for editorial comments.
Footnotes
-
COPYRIGHT © 2008 by the Society of Nuclear Medicine, Inc.
References
- Received for publication June 15, 2007.
- Accepted for publication October 29, 2007.


