
Main menu

  • Home
  • Content
    • Current
    • Ahead of print
    • Past Issues
    • JNM Supplement
    • SNMMI Annual Meeting Abstracts
    • Continuing Education
    • JNM Podcasts
  • Subscriptions
    • Subscribers
    • Institutional and Non-member
    • Rates
    • Journal Claims
    • Corporate & Special Sales
  • Authors
    • Submit to JNM
    • Information for Authors
    • Assignment of Copyright
    • AQARA requirements
  • Info
    • Reviewers
    • Permissions
    • Advertisers
  • About
    • About Us
    • Editorial Board
    • Contact Information
  • More
    • Alerts
    • Feedback
    • Help
    • SNMMI Journals
  • SNMMI
    • JNM
    • JNMT
    • SNMMI Journals
    • SNMMI

User menu

  • Subscribe
  • My alerts
  • Log in
  • Log out
  • My Cart

Search

  • Advanced search
Journal of Nuclear Medicine
  • SNMMI
    • JNM
    • JNMT
    • SNMMI Journals
    • SNMMI
  • Subscribe
  • My alerts
  • Log in
  • Log out
  • My Cart
Journal of Nuclear Medicine

Advanced Search

  • Home
  • Content
    • Current
    • Ahead of print
    • Past Issues
    • JNM Supplement
    • SNMMI Annual Meeting Abstracts
    • Continuing Education
    • JNM Podcasts
  • Subscriptions
    • Subscribers
    • Institutional and Non-member
    • Rates
    • Journal Claims
    • Corporate & Special Sales
  • Authors
    • Submit to JNM
    • Information for Authors
    • Assignment of Copyright
    • AQARA requirements
  • Info
    • Reviewers
    • Permissions
    • Advertisers
  • About
    • About Us
    • Editorial Board
    • Contact Information
  • More
    • Alerts
    • Feedback
    • Help
    • SNMMI Journals
  • View or Listen to JNM Podcast
  • Visit JNM on Facebook
  • Join JNM on LinkedIn
  • Follow JNM on Twitter
  • Subscribe to our RSS feeds
OtherBASIC SCIENCE INVESTIGATIONS

Validation of an Extracerebral Reference Region Approach for the Quantification of Brain Nicotinic Acetylcholine Receptors in Squirrel Monkeys with PET and 2-18F-Fluoro-A-85380

Bernard Le Foll, Svetlana I. Chefer, Alane S. Kimes, Dean Shumway, Steven R. Goldberg, Elliot A. Stein and Alexey G. Mukhin
Journal of Nuclear Medicine September 2007, 48 (9) 1492-1500; DOI: https://doi.org/10.2967/jnumed.107.039776
Bernard Le Foll
  • Find this author on Google Scholar
  • Find this author on PubMed
  • Search for this author on this site
Svetlana I. Chefer
  • Find this author on Google Scholar
  • Find this author on PubMed
  • Search for this author on this site
Alane S. Kimes
  • Find this author on Google Scholar
  • Find this author on PubMed
  • Search for this author on this site
Dean Shumway
  • Find this author on Google Scholar
  • Find this author on PubMed
  • Search for this author on this site
Steven R. Goldberg
  • Find this author on Google Scholar
  • Find this author on PubMed
  • Search for this author on this site
Elliot A. Stein
  • Find this author on Google Scholar
  • Find this author on PubMed
  • Search for this author on this site
Alexey G. Mukhin
  • Find this author on Google Scholar
  • Find this author on PubMed
  • Search for this author on this site
  • Article
  • Figures & Data
  • Supplemental
  • Info & Metrics
  • PDF
Loading

Article Figures & Data

Figures

  • Tables
  • Additional Files
  • FIGURE 1. 
    • Download figure
    • Open in new tab
    • Download powerpoint
    FIGURE 1. 

    (A) Fraction of nonmetabolized 2-FA expressed as percentage of total plasma radioactivity (mean ± SEM; n = 6). (B) Typical time course of elimination of radioactivity from arterial blood plasma after 2-FA administration. Values represent mean ± SEM of total plasma radioactivity (•) and radioactivity from free parent compound in plasma (nonmetabolized 2-FA) (○) measured in 6 different monkeys and expressed as SUVs. To obtain SUVs, mean radioactivity (kBq/cm3) was normalized to injected dose (kBq) per gram of body weight, as follows: SUV = tissue radioactivity/dose radioactivity (13). (C) Dynamics of radioactivity accumulation in different structures after 2-FA administration. SUVs (mean ± SEM) in thalamus (○), midbrain (•), cortex (□), cerebellum (♦), and muscle (⋄) are presented.

  • FIGURE 2. 
    • Download figure
    • Open in new tab
    • Download powerpoint
    FIGURE 2. 

    Comparison of VDT values obtained with 1TCM, 2TCM, and Logan approaches in control (CTRL; n = 6) and in blocking (BLK; n = 4) studies. Results are expressed as mean ± SEM of VDT values obtained with different approaches. Note high consistency and similar variability among VDT values.
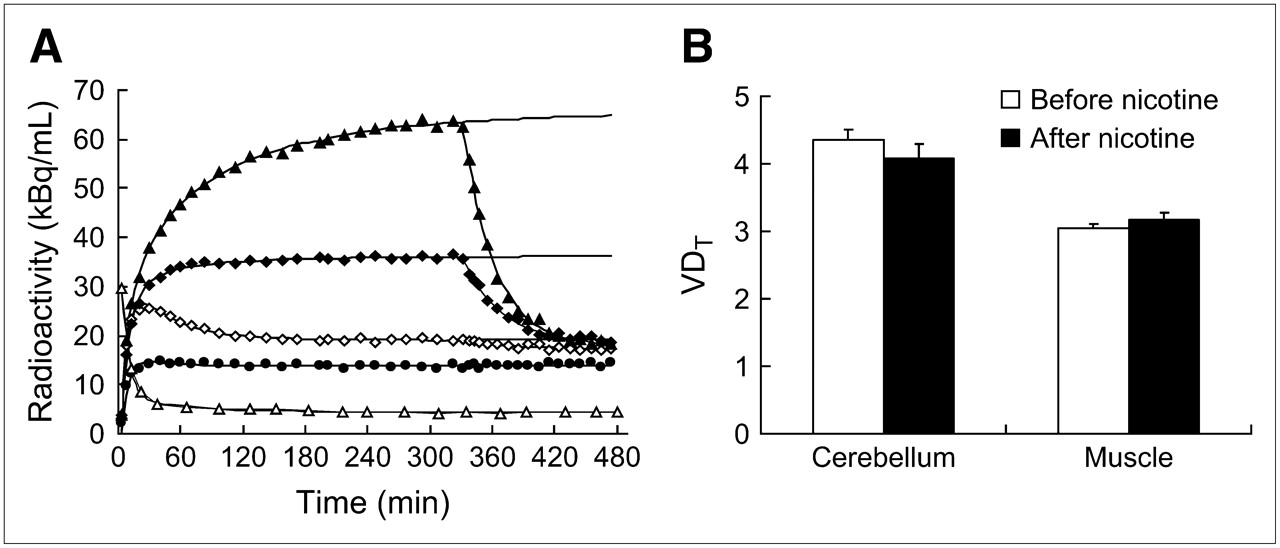
  • FIGURE 3. 
    • Download figure
    • Open in new tab
    • Download powerpoint
    FIGURE 3. 

    Effect of nicotine infusion during PET studies. (A) Representative dynamics of radioactivity accumulation in different structures after bolus administration of 2-FA. Nicotine infusion was initiated at 330 min. Regions displayed include thalamus (▴), cortex (♦), cerebellum (⋄), muscle (•), and blood (▵). (B) Average displacement induced by nicotine in 5 different experiments. Results are expressed as mean ± SEM of VDT values in cerebellum and muscle structures; data were collected during 1-h periods either before (⋄, ▵) or 2 h after (▴, ♦, •) infusion of nicotine.
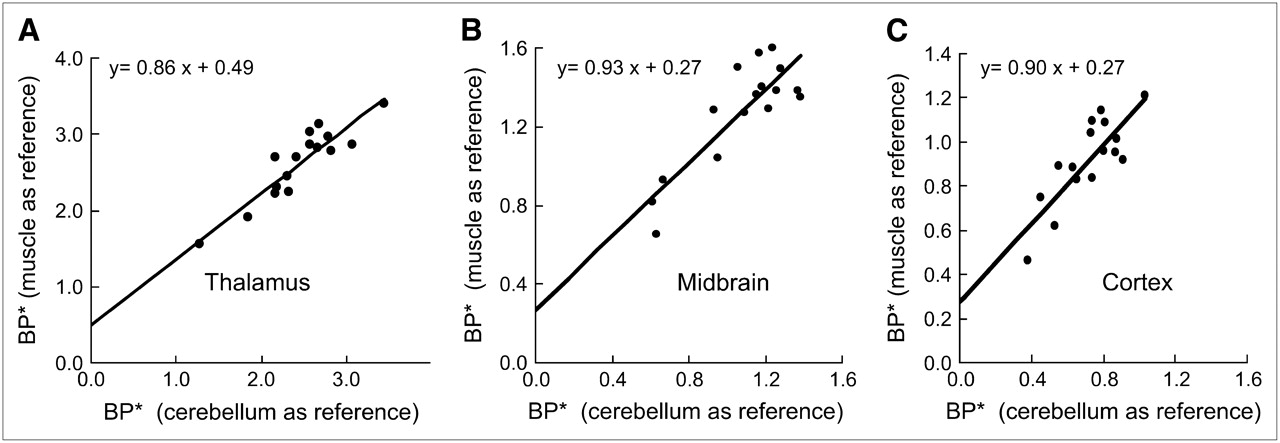
  • FIGURE 4. 
    • Download figure
    • Open in new tab
    • Download powerpoint
    FIGURE 4. 

    Correlation of apparent BP* values measured with cerebellum (abscissa) or muscle (ordinate) as reference region. Results were obtained from 16 different monkeys. Significant correlations were noted in 3 brain areas (r = 0.91, 0.85, and 0.82 for thalamus, midbrain, and cortex, respectively).
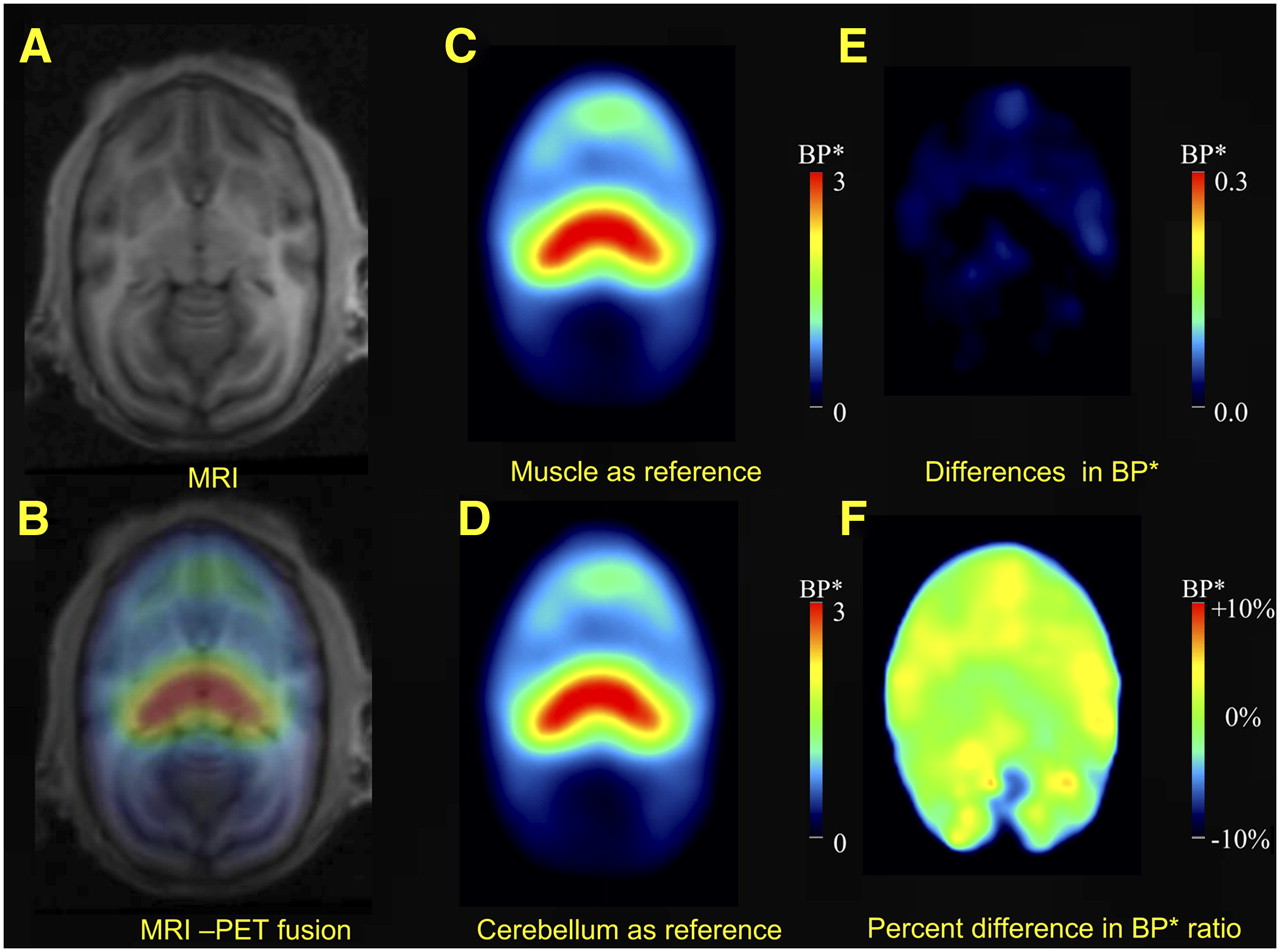
  • FIGURE 5. 
    • Download figure
    • Open in new tab
    • Download powerpoint
    FIGURE 5. 

    Images showing that similar BP* values were obtained with cerebellum or muscle as reference region. (A) Representative MRI horizontal section at level of thalamus in squirrel monkey. (B) Fused MRI and PET images. (C and D) Images showing BP* values measured with muscle (C) and with cerebellum (D) as reference regions. (E) Difference between C and D, indicating similar values for whole brain with either muscle or cerebellum as reference region. (F) Same difference as in E but expressed as percentage of values obtained with cerebellum as reference region.
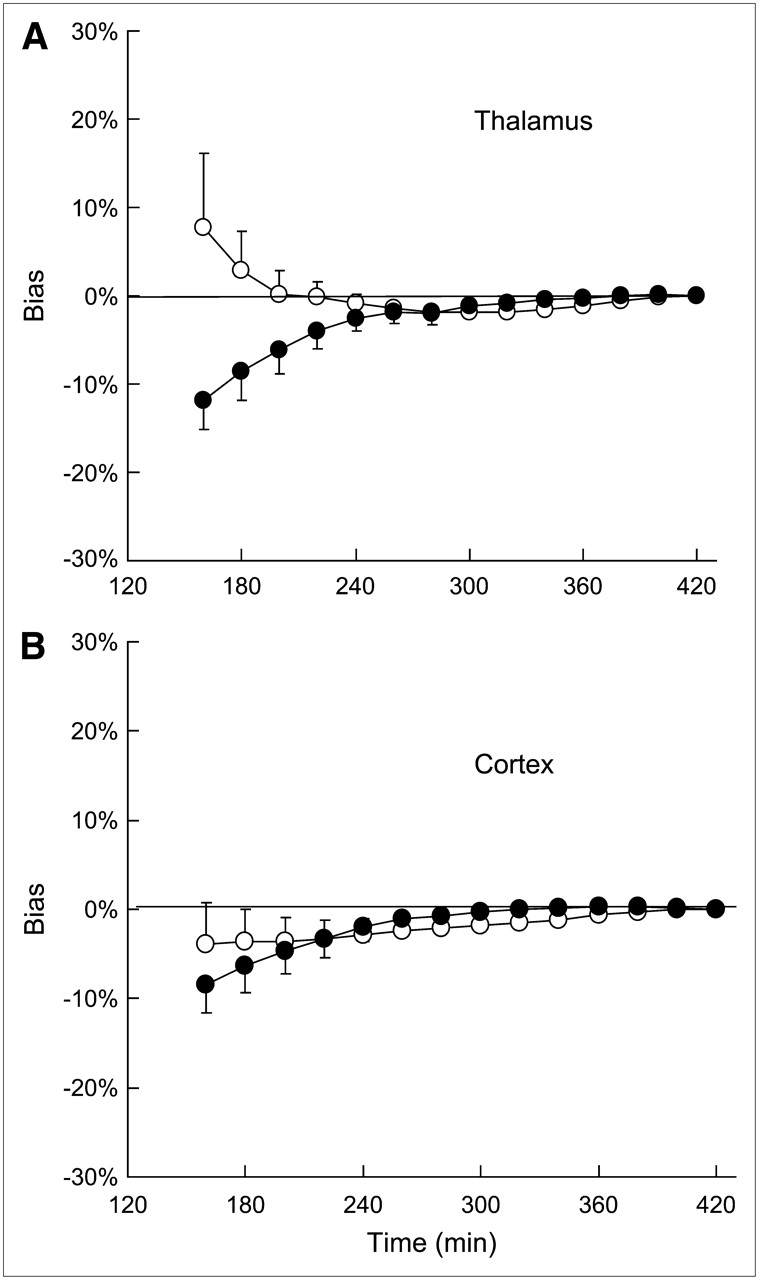
  • FIGURE 6. 
    • Download figure
    • Open in new tab
    • Download powerpoint
    FIGURE 6. 

    Effect of study duration on stability of BP* values measured with cerebellum (○) or muscle (•) as reference region. BP* values (mean ± SD; n = 5) are expressed as percentage deviation from value obtained with 7-h scanning time. (A) Thalamus. (B) Cortex.
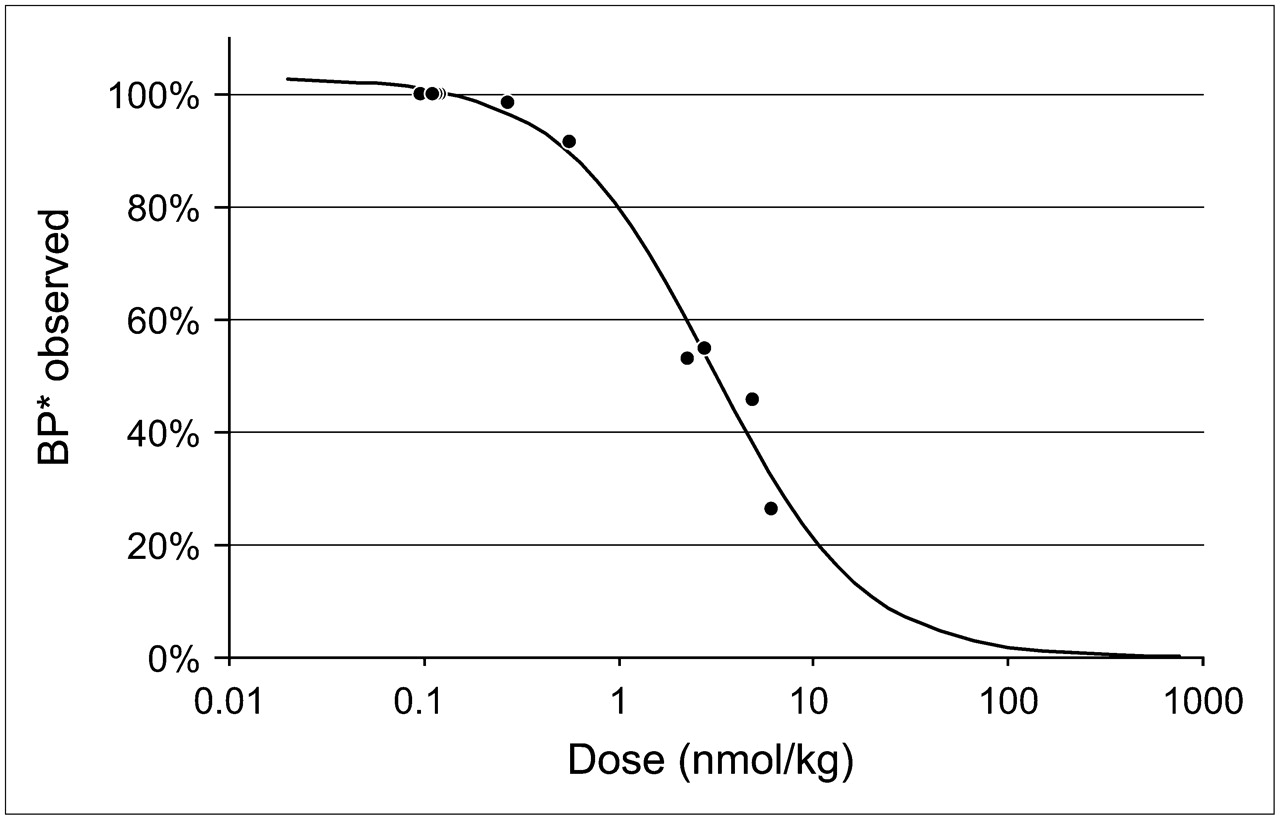
  • FIGURE 7. 
    • Download figure
    • Open in new tab
    • Download powerpoint
    FIGURE 7. 

    Effect of mass of administered radioligand on apparent BP* values measured in thalamus with cerebellum as reference region. ED50 of this effect (3.2 ± 0.3 nmol/kg) was calculated on basis of results obtained for 4 animals in 9 separate PET studies with bolus administration of 2-FA at doses ranging from 0.1 to 6.1 nmol/kg. Obtained values were expressed as percentage of control values obtained when radioligand was injected at lowest dose (0.1–0.12 nmol/kg). Control BP* values in 4 animals used in this experiment were 3.0, 2.7, 2.5, and 2.4.

Tables

  • Figures
  • Additional Files
    • View popup
    TABLE 1

    Comparison of BP* Values in Thalamus and Temporal Cortex, Calculated from VDT and VDnd Values Obtained During Blocking Studies (BP*blk) or Calculated with SRTM Approach and Muscle (BP*msl) or Cerebellum (BP*cb) as Reference Region

    ThalamusCortex
    MonkeyBP*blkBP*msl% Change*BP*cb% Change*BP*blkBP*msl% Change*BP*cb% Change*
    13.103.131.02.81−9.30.971.079.90.84−13.4
    22.502.23−10.62.34−6.60.700.8318.50.66−6.4
    31.601.56−2.41.45−9.40.400.401.00.400.0
    42.402.7112.92.18−9.20.881.0317.40.75−14.8
    Mean2.402.410.22.19−8.60.740.8311.70.66−8.6
    SD0.620.679.80.561.30.250.308.10.196.8
    • ↵* Percentage change from BP*blk value in respective brain region.

Additional Files

  • Figures
  • Tables
  • Supplemental Data

    Files in this Data Supplement:

    • Supplemental Tables and Figure Legend
    • Supplemental Figure 1
PreviousNext
Back to top

In this issue

Journal of Nuclear Medicine: 48 (9)
Journal of Nuclear Medicine
Vol. 48, Issue 9
September 2007
  • Table of Contents
  • Table of Contents (PDF)
  • About the Cover
  • Index by author
Print
Download PDF
Article Alerts
Sign In to Email Alerts with your Email Address
Email Article

Thank you for your interest in spreading the word on Journal of Nuclear Medicine.

NOTE: We only request your email address so that the person you are recommending the page to knows that you wanted them to see it, and that it is not junk mail. We do not capture any email address.

Enter multiple addresses on separate lines or separate them with commas.
Validation of an Extracerebral Reference Region Approach for the Quantification of Brain Nicotinic Acetylcholine Receptors in Squirrel Monkeys with PET and 2-18F-Fluoro-A-85380
(Your Name) has sent you a message from Journal of Nuclear Medicine
(Your Name) thought you would like to see the Journal of Nuclear Medicine web site.
Citation Tools
Validation of an Extracerebral Reference Region Approach for the Quantification of Brain Nicotinic Acetylcholine Receptors in Squirrel Monkeys with PET and 2-18F-Fluoro-A-85380
Bernard Le Foll, Svetlana I. Chefer, Alane S. Kimes, Dean Shumway, Steven R. Goldberg, Elliot A. Stein, Alexey G. Mukhin
Journal of Nuclear Medicine Sep 2007, 48 (9) 1492-1500; DOI: 10.2967/jnumed.107.039776

Citation Manager Formats

  • BibTeX
  • Bookends
  • EasyBib
  • EndNote (tagged)
  • EndNote 8 (xml)
  • Medlars
  • Mendeley
  • Papers
  • RefWorks Tagged
  • Ref Manager
  • RIS
  • Zotero
Share
Validation of an Extracerebral Reference Region Approach for the Quantification of Brain Nicotinic Acetylcholine Receptors in Squirrel Monkeys with PET and 2-18F-Fluoro-A-85380
Bernard Le Foll, Svetlana I. Chefer, Alane S. Kimes, Dean Shumway, Steven R. Goldberg, Elliot A. Stein, Alexey G. Mukhin
Journal of Nuclear Medicine Sep 2007, 48 (9) 1492-1500; DOI: 10.2967/jnumed.107.039776
Twitter logo Facebook logo LinkedIn logo Mendeley logo
  • Tweet Widget
  • Facebook Like
  • Google Plus One
Bookmark this article

Jump to section

  • Article
    • Abstract
    • MATERIALS AND METHODS
    • RESULTS
    • DISCUSSION
    • CONCLUSION
    • Acknowledgments
    • Footnotes
    • References
  • Figures & Data
  • Supplemental
  • Info & Metrics
  • PDF

Related Articles

  • This Month in JNM
  • PubMed
  • Google Scholar

Cited By...

  • PET Imaging of Nicotinic Acetylcholine Receptors in Baboons with 18F-AZAN, a Radioligand with Improved Brain Kinetics
  • Google Scholar

More in this TOC Section

  • Design and Fabrication of Kidney Phantoms for Internal Radiation Dosimetry Using 3D Printing Technology
  • Synthesis and Biologic Evaluation of Novel 18F-Labeled Probes Targeting Prostate-Specific Membrane Antigen for PET of Prostate Cancer
  • Tumor-Specific Binding of Radiolabeled PEGylated GIRLRG Peptide: A Novel Agent for Targeting Cancers
Show more Basic Science Investigations

Similar Articles

SNMMI

© 2025 SNMMI

Powered by HighWire