


Abstract
There are only 2 currently available radioligands, 2-18F-FA and 6-18F-FA, for quantitative PET of the main cerebral subtype of nicotinic acetylcholine receptors (α4β2-nAChRs) in humans. Both exhibit slow distribution kinetics in the brain and require several hours for PET imaging. This makes PET of nAChRs with these radioligands logistically difficult and a serious burden for human subjects. The main purpose of this study was to preclinically evaluate (−)-2-(6-18F-fluoro-2,3′-bipyridin-5′-yl)-7-methyl-7-azabicyclo[2.2.1]heptane (18F-AZAN), our new radiolabeled antagonist of α4β2-nAChRs, that has high binding potential and rapid brain kinetics in baboons. Methods: 18F-AZAN was synthesized using a modified 18F-FDG synthesis module. The regional distribution of 18F-AZAN in the brain was evaluated in baseline and cytisine-blocking studies of 4 male Papio anubis baboons. PET modeling procedures were used for calculation of regional distribution volume (VT), nondisplaceable binding potential (BPND), and receptor occupancy. Results: 18F-AZAN rapidly entered the baboon brain, reached a steady state within 90 min after injection, and specifically labeled cerebral nAChRs. The peak radioactivity in the thalamus was 540 (percentage standardized uptake value) at 18 ± 7 min (n = 4) after bolus injection. Mathematical data analysis demonstrated that scanning for only 90 min is sufficient for determination of PET outcome variables (BPND, 3.2 [unitless] and VT, 32–35 mL/mL in thalamus). The dose-dependent blocking experiments with cytisine demonstrated that 18F-AZAN binds specifically with β2-containing (predominantly α4β2) nAChRs. Conclusion: 18F-AZAN specifically labels nAChRs in baboon brains with a high value of BPND and it requires only 90 min of PET scanning to produce estimates of VT and BPND in the various brain regions. The blocking of nAChRs with cytisine is dose-dependent and it showed that 18F-AZAN is suitable for application in nicotinic drug evaluation. In summary, 18F-AZAN is superior to 2-18F-FA and 6-18F-FA for imaging cerebral β2-containing nAChRs in baboons. Further evaluations of 18F-AZAN in the human brain are under way.
Nicotinic acetylcholine receptors (nAChRs) are ligand-gated cation channels that have an essential role in brain physiology. Structurally, nAChRs consist of 5 subunits that are localized around the central ion-conducting pore. In vertebrates, there are 2 groups of nAChR subunits that include muscle type (α1, β1, δ, γ, and ε) and neuronal type subunits (α1−α10 and β2−β4). In the central nervous system, nAChRs mediate the action of endogenous acetylcholine and modulate the release of several important neurotransmitters. Cerebral nAChRs influence a wide range of central nervous system functions and pathways (1). The α4β2 is the main subtype of nAChR in the mammalian brain, with the highest density of this receptor in the thalamus, an intermediate density in the cortical regions and caudate, and the lowest density in the cerebellum (2,3). The α4β2-nAChRs are involved in several disorders, and alteration of the density of the receptor in various central nervous system disorders is well recognized (2,3).
Even though nAChRs were isolated more than 40 y ago and studied for many years, the detailed involvement of the receptors in physiology remains elusive (4). PET is the most advanced technique for studying cerebral receptors, and quantitative PET of α4β2-nAChRs has been a goal of many researchers since the development of 11C-nicotine. Regrettably, 11C-nicotine exhibits poor imaging properties in animals and humans because of its high nonspecific binding, low specific binding, and rapid metabolism (5).
The only currently available radioligands for quantitative PET nAChR in humans, 2-18F-FA and the less commonly used 6-18F-FA, exhibit slow distribution kinetics in both monkey and human brains and require many hours of PET scanning (2,5–9). Even the bolus-plus-infusion approach (10), which allows shortening the scanning time, does not resolve the problem completely because of the long postinjection waiting period (which remains more than 6 h). As a result, PET of nAChR with 2-18F-FA and 6-18F-FA is logistically difficult for many PET researchers and a significant burden for patients, especially those patients with neuropsychiatric disorders.
The kinetic drawbacks of 2-18F-FA and 6-18F-FA have prompted the development of radioligands with faster brain kinetics by our group and others (6,8,9). The studies on the relationship between radioligand structure and imaging properties (11,12) led us to synthesize 18F-AZAN ((−)-2-(6-18F-fluoro-2,3′-bipyridin-5′-yl)-7-methyl-7-azabicyclo[2.2.1]heptane), an α4β2-nAChR antagonist with rapid brain kinetics and desirably high binding potential values (11). The main objectives of this study were to develop a method of radiosynthesis of 18F-AZAN that would be suitable for baboons and future clinical PET studies, confirm the rapid brain kinetic properties of 18F-AZAN in baboons, test various mathematical models for quantification of the radioligand in baboon brains, and evaluate 18F-AZAN in blocking studies.
MATERIALS AND METHODS
Preparation of 18F-AZAN
A solution of 18F-fluoride, potassium carbonate (2.5 mg), and 1,10-diaza-4,7,13,16,21,24-hexaoxabicyclo[8.8.8]hexacosane (Kryptofix 222; Aldrich) (15–20 mg) in a mixture of 0.3 mL of water and 2 mL of acetonitrile was added to a reaction vessel of an 18F-FDG synthesis module (GE Healthcare). The mixture was heated at 120–140°C under a stream of argon, and water was evaporated azeotropically under reduced pressure. A solution of the precursor ((−)-7-methyl-2-exo-[3′-(6-bromopyridin-2-yl)-5′-pyridinyl]-7-azabicyclo[2.2.1]heptane (11)) (2–4 mg) in anhydrous dimethylsulfoxide (0.8 mL) was added to the reaction vessel and heated at 185°C for 18 min. The reaction mixture was cooled, diluted with 1 mL of water, injected onto the reverse-phase high-pressure liquid chromatography (HPLC) column (XBridge C18 10 μm, 10 × 250 mm; Waters), and eluted with 28% acetonitrile:72% water:0.1% trimethylamine mobile phase at flow rate of 12 mL/min. The product had a retention time of approximately 20 min. The radioactive peak was collected into 50 mL of HPLC water. The water solution was transferred through an activated Oasis HLB Plus LP cartridge (Waters). The cartridge was washed with 20 mL of saline, and the product was eluted with 1 mL of ethanol through a 0.2-μm sterile filter into a sterile, pyrogen-free multidose vial containing 4 mL of sterile 0.9% saline; 10 mL of saline was added through the same cartridge-filter assembly. The pyrogen-free and sterile solution of 18F-AZAN was then analyzed by HPLC (column: XBridge 3.5 μm, C18, 4.6 × 100 mm; mobile phase: 40% acetonitrile:60% water:0.1% triethylamine; 2 mL/min; ultraviolet: 285 nm; and retention time, ∼3.5 min) to determine the radiochemical purity and specific radioactivity. The content of residual Kryptofix was determined by thin-layer chromatography: silica gel, methanol:30% ammonium hydroxide (9:1). The residual solvents were determined by gas-chromatography analysis (column: WAX polyethyleneglycol phase, 30 m, 0.25-mm internal diameter, 0.25-mm film; temperature, 40–200°C). The total synthesis time, including the quality control, was about 90 min.
PET Experiments
The experimental protocol was approved by the Animal Care and Use Committee of the Johns Hopkins Medical Institutions. PET experiments were performed on 4 male baboons (Papio anubis) weighing 19.5–32.7 kg, on the High Resolution Research Tomograph (HRRT; CPS Innovations, Inc.). Each animal underwent 1 baseline scan and a varying number of blocking scans after pretreatment with cytisine at various dose levels on separate dates (Table 1).
Cytisine Doses for Blocking Scans
The animals were kept fasting for 12 h before each PET study. Anesthesia was induced with intramuscular Ketamine (7.5–10 mg/kg; Bioniche Teoranta) and maintained with a continuous intravenous infusion of propofol at 0.3–0.4 mg/kg/min throughout the PET experiment. One venous catheter was inserted for the radioligand injection, and 1 arterial catheter was inserted to obtain arterial blood samples for the determination of radioactivity in plasma. The animals were also intubated to facilitate respiration, and circulatory volume was maintained by constant infusion of isotonic saline. Physiologic vital signs, including heart rate, blood pressure, electrocardiogram, and oxygen saturation, were monitored continuously throughout the study.
The animal was positioned in the PET scanner, with the head immobilized with a thermoplastic mask to reduce head motion. A 6-min transmission scan was acquired using a rotating 137Cs source for attenuation correction. Dynamic PET images were then acquired in 3-dimensional list mode for 90 min after an intravenous bolus injection of 18F-AZAN (281–459 MBq [7.6–12.4 mCi]), with specific radioactivity in the range of 83–1,335 GBq/μmol (2,254–36,071 mCi/μmol).
In blocking scans, cytisine was given subcutaneously 1.5 h before the start of the PET scan. Arterial blood samples were collected at short intervals (<5 s) initially and gradually prolonged intervals throughout the PET study for determination of plasma radioactivity. Selected samples taken at 0, 5, 10, 20, 30, 60, and 90 min were analyzed by HPLC for the presence of 18F-AZAN and its radioactive metabolites as described elsewhere (11).
PET Data Analysis
Reconstruction
Emission PET scans were reconstructed using the iterative ordered-subset expectation-maximization algorithm correcting for attenuation, scatter, and dead time. The radioactivity was corrected for physical decay to the injection time and rebinned to 35 dynamic PET frames of 256 (left-to-right) × 256 (nasion-to-inion) × 207 (neck-to-cranium) voxels. The frame schedules were 4 × 15 s, 4 × 30 s, 3 × 1 min, 2 × 2 min, 5 × 4 min, and 12 × 5 min.
Volumes of Interest
A standard volume-of-interest template (13) was transferred to individual animals’ MR images according to spatial normalization parameters given by SPM5 (statistical parametric mapping; available at http://www.fil.ion.ucl.ac.uk/spm/software/spm5) (14), and then transferred to the baseline PET images using the coregistration parameters obtained with SPM5 (15) using the mutual information theory (16) and minimally adjusted for radioactivity distribution of the baseline scan for each subject. The individualized volume-of-interest template was transferred to the PET spaces of the blocking scans using PET-to-PET coregistration parameters given by the coregistration module of SPM5. Time–radioactivity curves of regions were obtained by applying the volumes of interest on PET frames.
Derivation of PET Outcome Variables
A set of standard plasma input methods was used to identify the optimal method for derivation of regional distribution volume (VT) for 18F-AZAN. The following 4 methods were tested: a 1-tissue-compartmental model with 3 parameters (K1 and k2′ (17) and v0, tissue vascular volume), 2-tissue compartmental models with 5 parameters (K1, k2, k3, k4, and v0 (18)), without and with constraining the K1–k2 ratio (nondisplaceable distribution volume, VND (19)) to the cerebellum estimate (TTCM and TTCM-C, respectively), and the plasma reference graphic analysis (PRGA) (20). Nondisplaceable binding potential (BPND) was given as the k3–k4 ratio in the TTCM and TTCM-C methods.
Occupancy of nAChRs by cytisine was obtained using regional VT values of PRGA as follows: first, VND was obtained using a scatterplot of ΔVT (i.e., baseline VT minus postdose VT) versus baseline VT (=x) of all regions (21,22). The prerequisite for this method was that regions show similar occupancies (i.e., a linear model was supported). When this condition was satisfied, VND was given as the x-intercept of the regression line, and occupancy is given as follows:
The effective dose (ED50) that caused 50% of the maximal occupancy (Omax) was determined in the thalamus by fitting the plot of occupancy versus the cytisine dose (mg/kg) using the following equation:
RESULTS
Radiochemistry
To meet the requirements for future clinical PET studies, the radiosynthesis of 18F-AZAN and its conditions for purification have been optimized relative to the original procedure (11). The final product was prepared as a sterile, apyrogenic solution in saline with a pH of 5.5–6.5, radiochemical purity greater than 99%, and specific radioactivity in the range of 296–1,739 GBq/μmol (8,000–47,000 mCi/μmol) at the time synthesis ended. The chemical purity of 18F-AZAN was within the conventional requirements for PET radioligand studies. Chromatography analysis of the final product demonstrated that concentration of the residual precursor (HPLC), and Kryptofix (thin-layer chromatography) did not exceed 0.1 μg/mL and 50 μg/mL, respectively. The concentration of the residual solvents (acetonitrile, 10–25 μg/mL; dimethyl sulfoxide, 0.5–12 μg/mL; and trimethylamine, 5–15 μg/mL) was determined by gas chromatography. The content of ethanol in the final product was 7.5%–8.5%.
Radioactive Metabolites and Plasma Time–Activity Curves
Total radioactive metabolites of 18F-AZAN increased after the injection (Fig. 1A), reaching about 50% of total radioactivity at 15 min, 80% at 30 min, and 90% at 90 min. The radioactive metabolites were all polar and were assumed not to enter the brain, as confirmed in our previous studies in rodents (11).

(A) Time profiles (mean with SD bars from 8 postcytisine scans) of total radioactive metabolites in plasma after bolus injection of 18F-AZAN. (B) Total and metabolite-corrected time–activity curves in plasma (mean from 4 baseline scans), expressed in percentage standardized uptake value (SUV). Inset shows early time points for clear visualization of peak.
Arterial plasma time–activity curves (expressed in percentage standardized uptake value = radioactivity [mCi/L]/[injected radioactivity dose (mCi)/body weight (kg)] × 100%) are shown in Figure 1B, as the mean of 4 baseline scans. Total plasma radioactivity peaked within a few seconds after the injection, decreased sharply, slowly increased, formed a trivial rebound around 20 min, and decreased slowly thereafter, whereas radioactive metabolite-corrected time–activity curves decreased monotonously after the peak. Plasma time–activity curves did not differ between baseline and postcytisine scans.
BPND Images and Tissue Time–Activity Curves
Figure 2 shows transaxial images of the BPND for 18F-AZAN for baseline and postcytisine (dose, 2.0 mg/kg) scans of baboon 459. Images of VT were generated first using PRGA to obtain BPND images as follows: BPND = VT/VND − 1, where VND is given by a plot of ΔVT. On visual inspection, the thalamus and lateral geniculate body showed the highest BPND values across baseline scans. Tissue time–activity curves for selected brain regions are shown as a mean of 4 baseline scans (Fig. 3A) and high-dose (≥0.7 mg/kg) postcytisine scans (Fig. 3B). In the baseline scans, the thalamus, which peaked at around 20 min (18.0 ± 6.9 min; mean ± SD of 4 baseline scans), showed the highest radioactivity, followed by the lateral geniculate body, cortical regions, and striatum, whereas the cerebellum showed the lowest radioactivity.

Transaxial images of BPND of baseline (left) and postcytisine (right; dose, 2 mg/kg) scans of 1 animal (baboon 459) after injection of 18F-AZAN, together with coregistered MR images (middle). PET images show 2 regions with highest radioactivity accumulations, namely thalamus (T; upper) and lateral geniculate body (+; lower). Nearly complete blockade of BPND of 18F-AZAN accumulation in postcytisine scan suggests that 18F-AZAN binding is mediated by α4β2-nAChR.

Time–activity curves of selected brain regions after bolus injection of 18F-AZAN in baseline (means of 4 baseline scans) (A) and postcytisine (means of 4 high-dose [≥0.7 mg/kg]) (B) scans, expressed in standardized uptake values (SUV) in percentage. Note minimal regional differences in time–activity curves in blockade scans. SD bars were shown for thalamus to indicate general magnitudes of SDs in regions.
Selection of Optimal Method for PET Outcome Variables
Stabilities of estimates of VT and BPND were examined adding later PET frames from 60 (i.e., using frames taken from 0 to 60 min) to 180 min in 2 animals at a baseline condition. In 1 animal (baboon 459), estimates of VT remained relatively stable after 90 min by TTCM-C in all regions but not by TTCM (Fig. 4). Another animal (baboon 15070) confirmed similar trends. Therefore, TTCM was rejected for 18F-AZAN for 90-min PET scans. A 1-tissue-compartmental model was also rejected because TTCM-C showed lower Akaike information criteria (AIC) (23) in all regions in baseline and postcytisine scans (P < 0.01, Bonferroni adjustment; with baseline and postcytisine scans pooled). TTCM-C and PRGA were tested for robustness of VT estimates at 60 and 90 min (using 20- to 60- and 20- to 90-min frames for PRGA), pooling all baseline and blocking scans. The scatterplot of TTCM-C (Fig. 5A) shows some scatter from the line of identity between the 60- and 90-min estimates, whereas PRGA yielded almost identical VT estimates at 60 and 90 min (5B). Therefore, the presence of outlying points from the line of identity in TTCM-C versus PRGA scatterplots at 90 min (5C) suggested that TTCM-C may suffer some uncertainty in VT estimates, especially in regions of low VT. After combining all the findings in this section, PRGA appears to be the optimal method for 18F-AZAN for 90-min scans in the baboon brain. However, TTCM-C may also be used because of its ability to provide BPND in a single scan.

Plots of estimates of VT (A) and BPND (B) of TTCM (thalamus only) and TTCM-C methods for selected baboon brain regions as functions of last PET frames included in derivation of PET variables in 1 baseline scan of baboon 459 (scanned for 180 min after injection of 18F-AZAN). Graph demonstrates that 18F-AZAN can yield regional VT and BPND values in baboons with 90-min PET scans.

Scatterplots of VT estimates at 60 vs. 90 min for TTCM-C (A) and PRGA (B). (C) Scatterplot of VT estimates of TTCM-C vs. PRGA at 90 min. Figure suggests that PRGA will yield stable estimates if scan duration is longer than 60 min.
Regional VT and BPND
Regional VT values given by PRGA and TTCM-C and BPND values given by TTCM-C are listed in Table 2. The thalamus has the highest BPND at 3.3 ± 0.5 (unitless), followed by lateral geniculate body, whereas cortical and subcortical regions have BPND values less than 1.
Regional VT and BPND Values of 18F-AZAN Baseline Scans (n = 4) by PRGA and TTCM-C Methods
In most of the PET experiments that are described here, the injected specific activity of 18F-AZAN was greater than approximately 300 GBq/μmol (8,000 mCi/μmol). The only baseline experiment that had a lower specific activity, 83 GBq/μmol (2,254 mCi/μmol), did not show a difference in the value of BPND in comparison with other baseline experiments with greater specific radioactivities.
Occupancy of nAChR by Cytisine
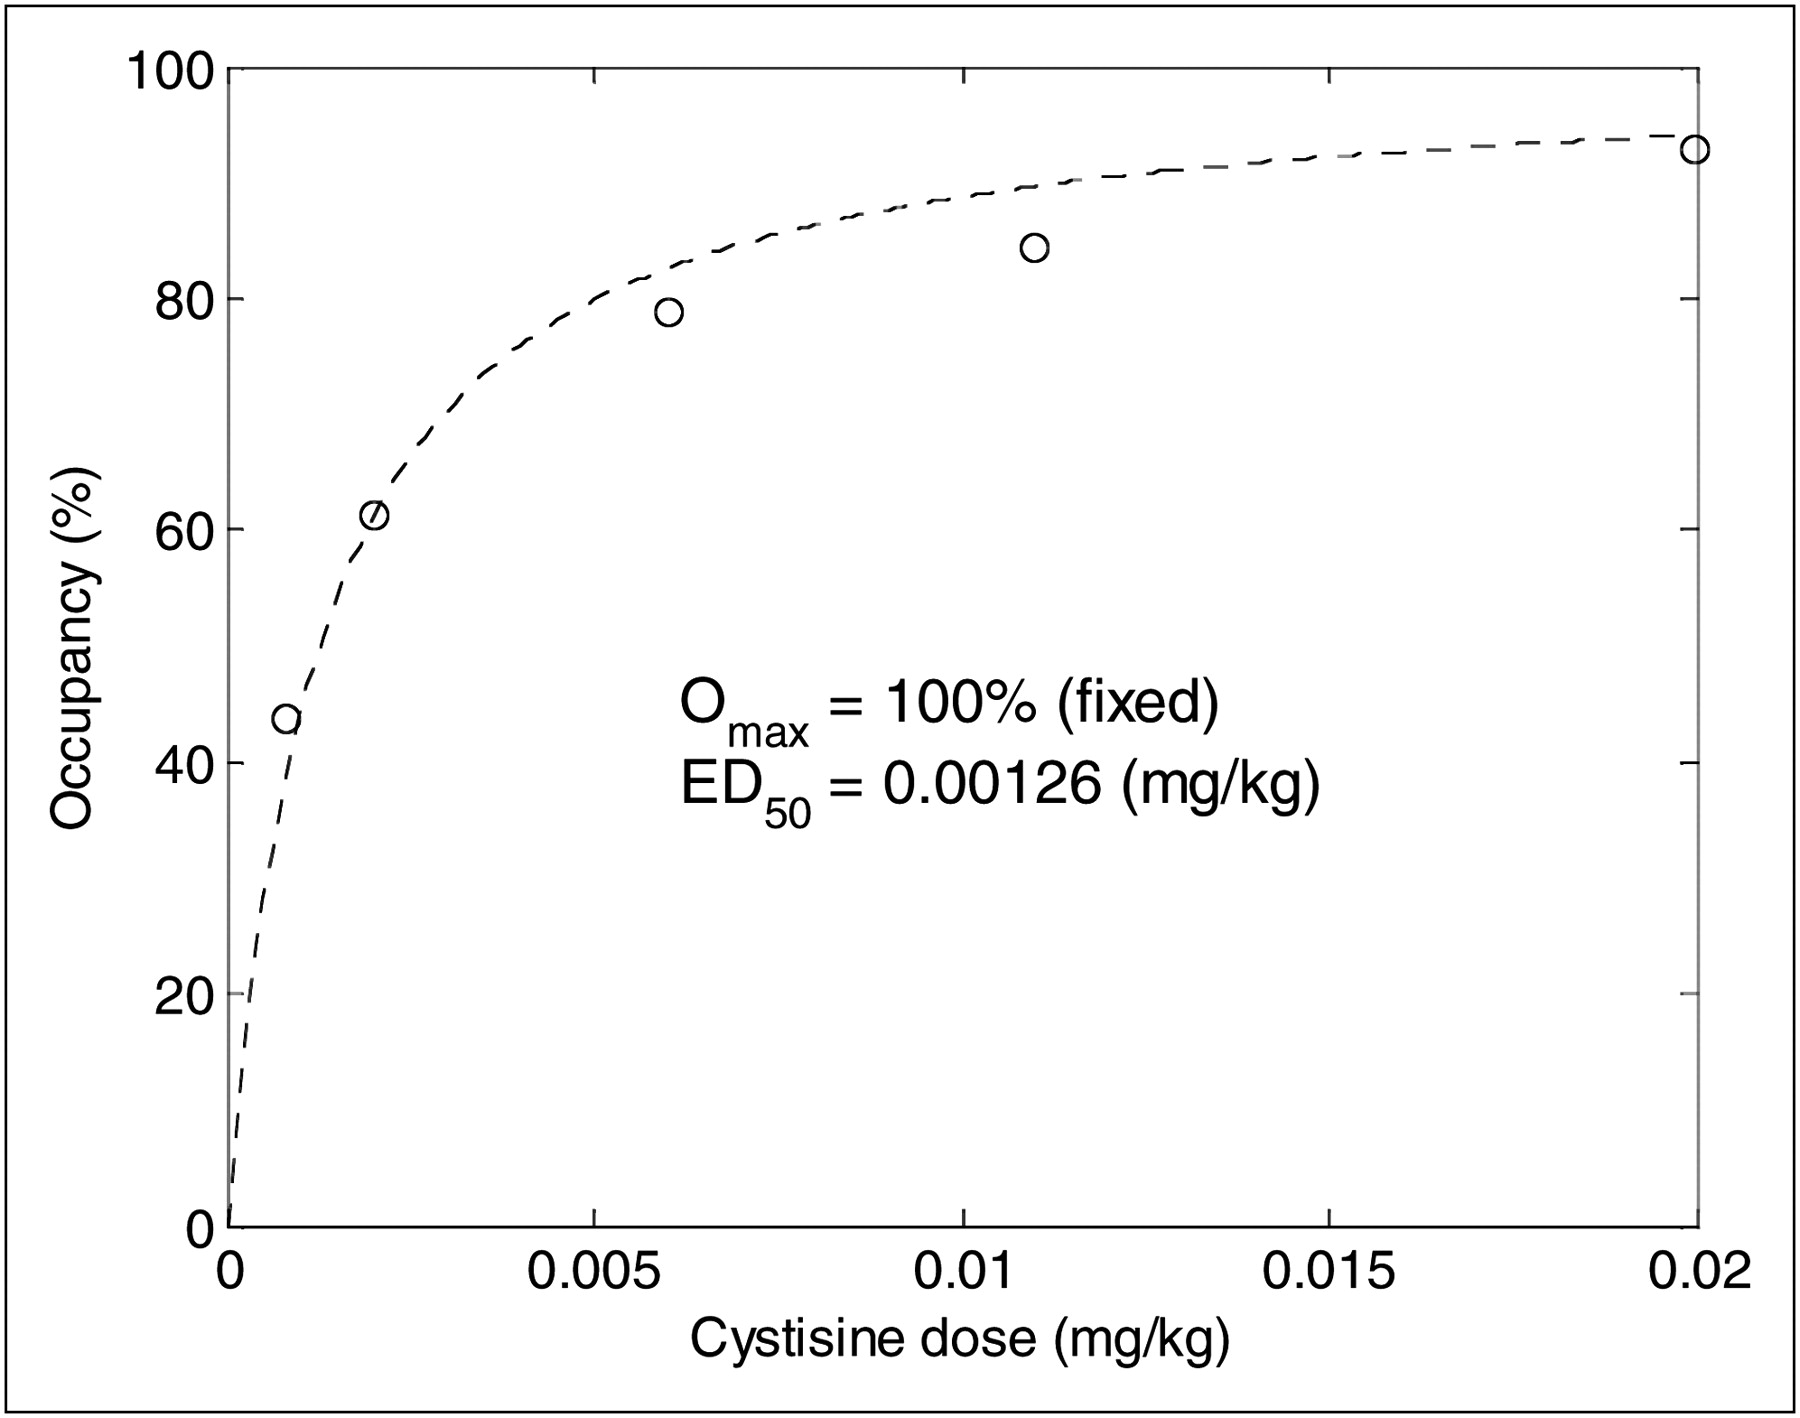
Scatterplots of ΔVT (baseline minus postcytisine) versus baseline VT (21,22) supported the linear model in all cases (R2 > 0.967), as exemplified in Figure 6. Thus, the prerequisite for using Equation 1 was satisfied. A plot of occupancy versus cytisine dose for the thalamus is shown in Figure 7. Four high-dose experiments were omitted from the figure to clearly visualize the lower-dose data. Occupancy estimates of high-dose experiments were 99.8% for 0.7 mg/kg and 98.3% ± 1.5% for 2.0 mg/kg (n = 3). An F test supported Equation 3 for thalamus over the no-correlation model (F1,3 = 96.92; P < 0.001) or the linear model (F1,3 = 56.69; P < 0.001). The estimate of ED50 was 0.0013 mg/kg for the thalamus. AIC did not support the estimation of both ED50 and Omax over estimating ED50 alone with Omax set at 100%. Equation 2 was not supported for other regions.

Scatterplot of changes in VT between baseline and postcytisine scans (ΔVT) vs. baseline VT of PRGA in 9 regions. x-intercept (i.e., no changes between baseline and postdose scans) of regression line identifies VND when linear model is supported, as was true (R2 = 0.995 and VND = 5.27 mL/mL) in this example.

Scatterplot of occupancy vs. cytisine dose for thalamus with data from all postcytisine studies pooled. Data of 4 higher-dose experiments were not shown (occupancy > 97%) to visualize lower dose data clearly, although they were included in estimation of ED50 using Equation 2 with Omax fixed at 100%. Dotted line indicates model prediction.
DISCUSSION
Because of the relatively low density of α4β2-nAChR, the main nAChR subtype in the human brain, the development of a quality PET radioligand for α4β2-nAChRs with high specific binding and sufficiently rapid brain kinetics is a challenge (2,5–9,24,25). More than 100 α4β2-nAChR PET radioligands have been developed. Unfortunately, most radioligands with desirably high values of binding potential (≥2) manifest slow brain kinetics in high-density brain regions, and conversely, the nAChR radioligands with sufficiently rapid brain kinetics exhibited low binding potential values (8,9). The nAChR radioligands with relatively rapid kinetics are 11C-Me-PVC (26), 18F-nifene (27), (−)-18F-NCFHEB (28), 18F-ZW-104 (29), and 18F-AZAN (11). In this study, 18F-AZAN exhibited the required combination of high specific uptake and rapid brain kinetics, as indicated in our previous study with a single baboon (11).
PET Scan Length for Stable Estimates of VT
A human study with 2-18F-FA (30) estimated that a PET scan duration of 240 min would be required to obtain unbiased estimates of VT in the thalamus. Although some PET ligands for nAChR showed more rapid kinetics in the brain (e.g., 11C-Me-PVC (26) and 18F-nifene (27)), they have not undergone extensive evaluations because of the relatively low BPND values (i.e., less than 2 in thalamus), as reviewed previously (8,9). Another nAChR radioligand, namely (−)-18F-NCFHEB, displayed excellent specific binding in the thalamus and a relatively fast equilibrium of specific binding. However, a comparatively long injection-to-peak duration (80 ± 19 min) (28) suggests that a 90-min scan might be insufficient for (−)-18F-NCFHEB to yield stable estimates of thalamic VT. It was claimed that a PET duration of 55 min was required to obtain unbiased estimates of VT in the thalamus with 18F-ZW-104 using PRGA (29). However, further confirmation is required for this preliminary finding because the radioligand peaked at 50–60 min and showed only minimal decline of radioactivity in the thalamus at 90 min after the injection. Therefore, it appears that 18F-AZAN is probably the first PET radioligand for nAChRs that allows estimation of VT in brain regions (including the thalamus) within an acceptable PET scan duration suitable for a research setting in humans (i.e., 90 min).
18F-AZAN showed relatively fast metabolism in the circulation, compared with 2-18F-FA and (−)-18F-NCFHEB. However, the high metabolites at later time points appeared not to be a real confounding factor for 18F-AZAN because the radioactivity in plasma was sufficiently high for accurate HPLC analysis of the parent 18F-AZAN and radiometabolites in 90-min scans. Because of this advantageous property, we could attain stable estimates of VT in the brain regions and stable estimates of occupancy in thalamus (Fig. 7).
Estimation of Regional BPND with 18F-AZAN
In TTCM-C, VND was obtained in the cerebellum as the K1–k2 ratio without the constraint (i.e., TTCM) in this study. The structure was selected for this purpose because of our previous findings that VND might be estimated accurately in a large region (i.e., less noise) with low receptor density (31). Probably for this reason, regional coefficients of variation remained similar between VT and BPND at least for high BPND regions (i.e., thalamus and lateral geniculate body).
For comparison of the several previously published radioligands with 18F-AZAN, we calculated pseudo-BPND as the thalamus-to-cerebellum VT ratio less 1 (32) using the cerebellum as the reference region. Pseudo-BPND values (unitless) of thalamus were estimated to be 1.5 in baboons for 2-18F-FA (33), 1.7 in pigs for (−)-18F-NCFHEB (28), 2.5 in baboons for 18F-ZW-104 (29), and 2.5 in baboons for 18F-AZAN (this study). Therefore, it is likely that 18F-AZAN exhibits BPND values that are comparable or preferable to existing PET ligands for nAChRs, ignoring potential species differences.
Although 18F-AZAN and 2-18F-FA (33,34), currently the most popular radioligand for α4β2-nAChRs, show closely matching regional distributions in the brain, a noticeable difference is a greater uptake of 18F-AZAN in the baboon lateral geniculate body (Fig. 2, lower panel). Colleagues from Orsay (personal communication with Dr. Héric Valette) observed some uptake of 2-18F-FA in the baboon geniculate nucleus, but this region and the thalamus were not clearly separated because of the relatively lower resolution of their PET scanner. The lateral geniculate nucleus is a part of the visual system, and a recent study demonstrated high expression of α6β2- and α4β2-nAChR subtypes in this region (35). Both radioligands, 18F-AZAN and 2-18F-FA, manifest high binding affinity at α4β2-nAChR with inhibition constant (Ki) values of 1.3 nM (2-18F-FA) and 0.26 nM (18F-AZAN) (11). The binding affinity of 2-18F-FA at the α6β2-nAChR is currently unknown, whereas 18F-AZAN exhibits high binding at α6β2-nAChR subtype (Ki, 0.95 nM) (11). This characteristic may contribute in part to the in vivo binding of 18F-AZAN in the lateral geniculate nucleus, which, in addition to α4β2-nAChR, also contains some α6* and α2α6β2*-nAChR (35).
Blockade PET Studies
In vivo specific binding of 18F-AZAN could be due to its picomolar binding affinities at several β2-containing nAChRs, whereas its binding affinity at the β4-containing nAChR is lower (11). The blockade of 18F-AZAN was performed by pretreatment with cytisine, a partial agonist of nicotine that is selective for β2/β4-containing nAChR subtypes versus α7-nAChR (36,37). Binding of 18F-AZAN was blocked by cytisine in a dose-dependent manner and approached full occupancy when the dose exceeded 0.07 mg/kg. The agreement of the observed occupancy–dose curve (Fig. 7) with Equation 2, a variation of Hill's equation with a coefficient of 1, suggested that 18F-AZAN and cytisine compete in the thalamus predominantly for a single binding site (α4β2-nAChRs); this finding agrees with presence in the thalamus of mostly the α4β2-nAChR subtype (1–3,35). However, the limited number of data points cannot exclude a fraction of additional binding sites, which would support the binding profile of AZAN. Because both cytisine and AZAN also bind at α6β2-nAChR, it is possible that blockade of 18F-AZAN in the geniculate body is fractionally due to this subtype. However, the α4β2-nAChR subtype is the major cerebral nicotinic subtype in most brain regions, including the geniculate body (1–3,35). Therefore, the fraction of the 18F-AZAN blockade that is associated with nicotinic subtypes other than the α4β2-nAChR subtype is likely to be low and potentially less measurable by our current PET methodology.
Methodologically, we chose to use PRGA for the occupancy estimation because of the robustness the method showed over TTCM-C for 90-min scans. The transposed Lassen plot (21,22) was used to overcome the fact that VND may not be accessible with PRGA when a reference region is not available for the receptor system. The regression line essentially hinged on 3 data points, namely the thalamus, lateral geniculate body, and the rest of regions, in all cases (Fig. 6).
The use of the plot was supported for 18F-AZAN for several reasons. First, the 3 groups of points were separated and aligned along the regression line in all cases. Second, the maximal difference in VND estimates in individual baboons (i.e., among multiple doses) was 1.5 mL/mL, compared with relatively high VT values in the thalamus (i.e., 26.7 ± 6.0 mL/mL). Errors of this magnitude would have resulted in occupancy estimates ranging from 57% to 66% in the thalamus for an occupancy estimate that was 61% (i.e., about 5% under- or overestimation). It is likely that errors in VND estimates in the plot for occupancy estimates were relatively small in the thalamus for 18F-AZAN, as was shown in a published error analysis study for other receptor ligands (22). Third, the plot yielded almost complete occupancy (>95%) in 4 cases of high doses (>0.7 mg/kg), as visually confirmed with images (Fig. 2) and tissue time–activity curves (Fig. 3).
CONCLUSION
This study demonstrates that 18F-AZAN can yield robust regional VT and BPND values with 90-min PET scans. It shows that regional BPND estimates of 18F-AZAN are comparable and preferable to existing PET ligands 2-18F-FA and 6-18F-FA for nAChRs that require twice or longer study durations. The blockade study with multiple doses of cytisine demonstrated that in vivo binding of 18F-AZAN in the baboon brain is mediated by β2-containing nAChRs, primarily by α4β2-nAChRs.
The unique kinetic properties of 18F-AZAN make it superior to all currently available clinical radioligands for PET of cerebral α4β2-nAChR. 18F-AZAN is currently being used in several approved human clinical studies of nAChRs.
DISCLOSURE STATEMENT
The costs of publication of this article were defrayed in part by the payment of page charges. Therefore, and solely to indicate this fact, this article is hereby marked “advertisement” in accordance with 18 USC section 1734.
Acknowledgments
We thank Drs. James Brasic, Anil Kumar, Jong Ho Kim, Maria Guevara, and Barbar Hussein for injecting baboons. We are grateful to Paige Finley and Matias Ballesteros for animal handling and study coordination, Robert C. Smoot for radiochemistry assistance, and David J. Clough and Karen Edmonds for PET scanner operation. We thank Judy W. Buchanan for editorial help. This research was supported by the NIH grant DA020777, Philip Morris Research, R24 DA 000412, and the Division of Nuclear Medicine, Johns Hopkins School of Medicine. No other potential conflict of interest relevant to this article was reported.
Footnotes
↵* Contributed equally to this work.
Published online Dec. 15, 2011.
- © 2012 by the Society of Nuclear Medicine, Inc.
REFERENCES
- Received for publication April 25, 2011.
- Accepted for publication August 17, 2011.


Jump to section
Related Articles
Cited By...
- 18F-ASEM, a Radiolabeled Antagonist for Imaging the {alpha}7-Nicotinic Acetylcholine Receptor with PET
- PET Imaging of High-Affinity {alpha}4{beta}2 Nicotinic Acetylcholine Receptors in Humans with 18F-AZAN, a Radioligand with Optimal Brain Kinetics
- PET Imaging of {alpha}4{beta}2* Nicotinic Acetylcholine Receptors: Quantitative Analysis of 18F-Nifene Kinetics in the Nonhuman Primate