
Main menu

  • Home
  • Content
    • Current
    • Ahead of print
    • Past Issues
    • JNM Supplement
    • SNMMI Annual Meeting Abstracts
    • Continuing Education
    • JNM Podcasts
  • Subscriptions
    • Subscribers
    • Institutional and Non-member
    • Rates
    • Journal Claims
    • Corporate & Special Sales
  • Authors
    • Submit to JNM
    • Information for Authors
    • Assignment of Copyright
    • AQARA requirements
  • Info
    • Reviewers
    • Permissions
    • Advertisers
  • About
    • About Us
    • Editorial Board
    • Contact Information
  • More
    • Alerts
    • Feedback
    • Help
    • SNMMI Journals
  • SNMMI
    • JNM
    • JNMT
    • SNMMI Journals
    • SNMMI

User menu

  • Subscribe
  • My alerts
  • Log in
  • Log out
  • My Cart

Search

  • Advanced search
Journal of Nuclear Medicine
  • SNMMI
    • JNM
    • JNMT
    • SNMMI Journals
    • SNMMI
  • Subscribe
  • My alerts
  • Log in
  • Log out
  • My Cart
Journal of Nuclear Medicine

Advanced Search

  • Home
  • Content
    • Current
    • Ahead of print
    • Past Issues
    • JNM Supplement
    • SNMMI Annual Meeting Abstracts
    • Continuing Education
    • JNM Podcasts
  • Subscriptions
    • Subscribers
    • Institutional and Non-member
    • Rates
    • Journal Claims
    • Corporate & Special Sales
  • Authors
    • Submit to JNM
    • Information for Authors
    • Assignment of Copyright
    • AQARA requirements
  • Info
    • Reviewers
    • Permissions
    • Advertisers
  • About
    • About Us
    • Editorial Board
    • Contact Information
  • More
    • Alerts
    • Feedback
    • Help
    • SNMMI Journals
  • View or Listen to JNM Podcast
  • Visit JNM on Facebook
  • Join JNM on LinkedIn
  • Follow JNM on Twitter
  • Subscribe to our RSS feeds
OtherBASIC SCIENCE INVESTIGATIONS

Parametric Images of Antibody Pharmacokinetics Based on Serial Quantitative Whole-Body Imaging and Blood Sampling

Katarina Sjögreen Gleisner, Mattias Nickel, Ola Lindén, Kjell Erlandsson, Karin Wingårdh and Sven-Erik Strand
Journal of Nuclear Medicine August 2007, 48 (8) 1369-1378; DOI: https://doi.org/10.2967/jnumed.107.039503
Katarina Sjögreen Gleisner
  • Find this author on Google Scholar
  • Find this author on PubMed
  • Search for this author on this site
Mattias Nickel
  • Find this author on Google Scholar
  • Find this author on PubMed
  • Search for this author on this site
Ola Lindén
  • Find this author on Google Scholar
  • Find this author on PubMed
  • Search for this author on this site
Kjell Erlandsson
  • Find this author on Google Scholar
  • Find this author on PubMed
  • Search for this author on this site
Karin Wingårdh
  • Find this author on Google Scholar
  • Find this author on PubMed
  • Search for this author on this site
Sven-Erik Strand
  • Find this author on Google Scholar
  • Find this author on PubMed
  • Search for this author on this site
  • Article
  • Figures & Data
  • Info & Metrics
  • PDF
Loading

Article Figures & Data

Figures

  • FIGURE 1. 
    • Download figure
    • Open in new tab
    • Download powerpoint
    FIGURE 1. 

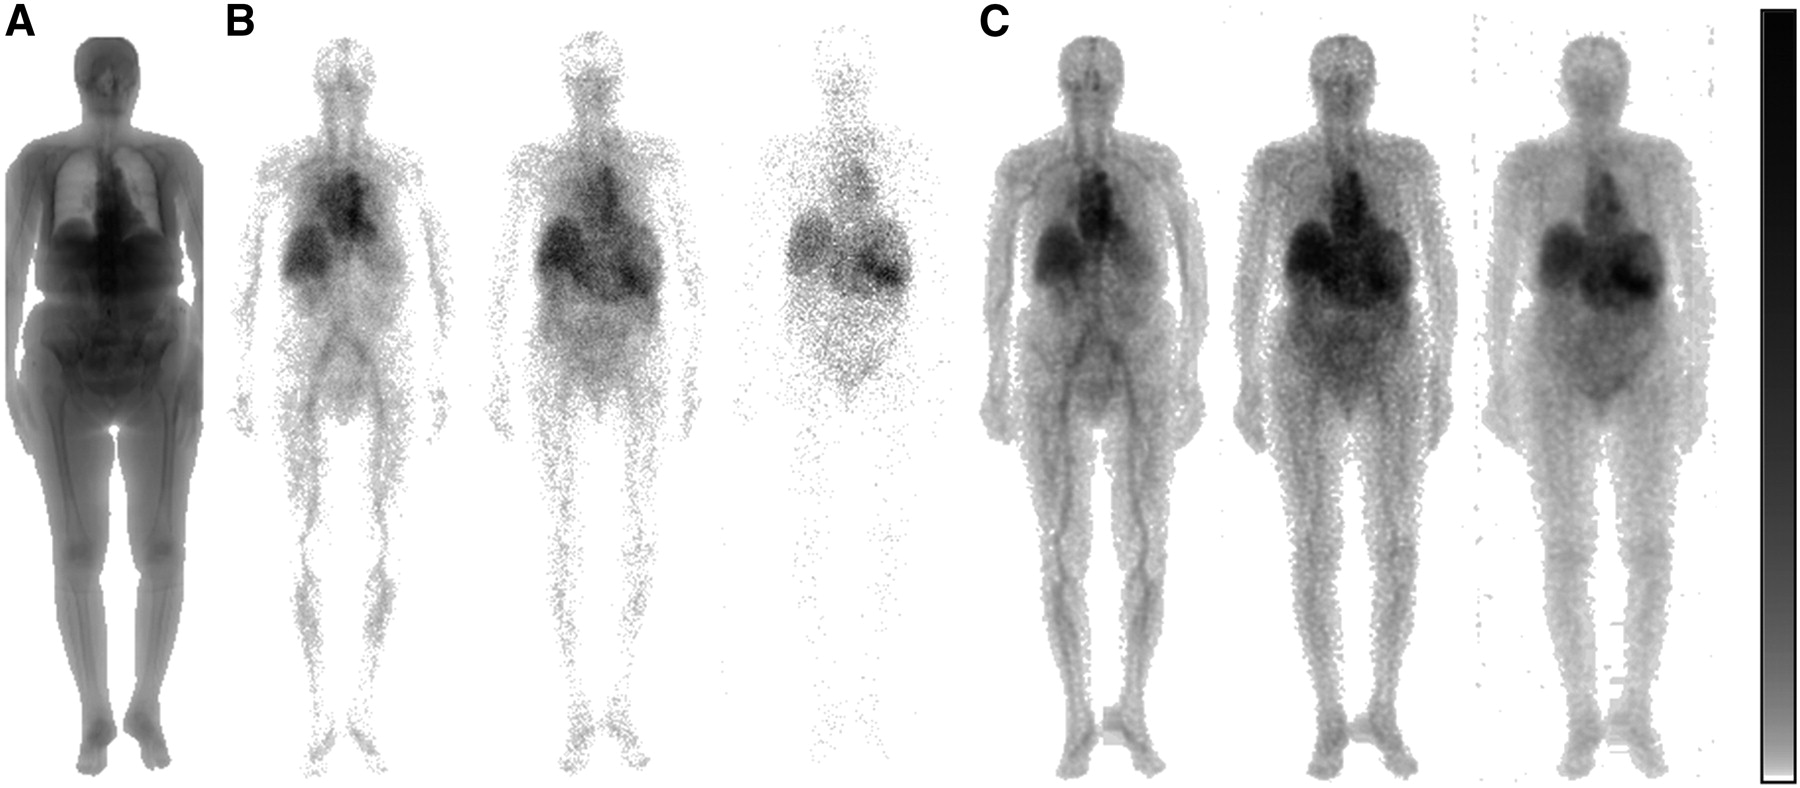
    Image data for patient 1. (A) Attenuation map obtained from CT scanogram image. (B) Geometric mean of anteroposterior raw-count images, showing 3 of total of 6 images, acquired at 1.5, 48, and 163 h after injection. (C) Quantitative images in units of MBq/pixel spatially registered to attenuation map.

  • FIGURE 2. 
    • Download figure
    • Open in new tab
    • Download powerpoint
    FIGURE 2. 

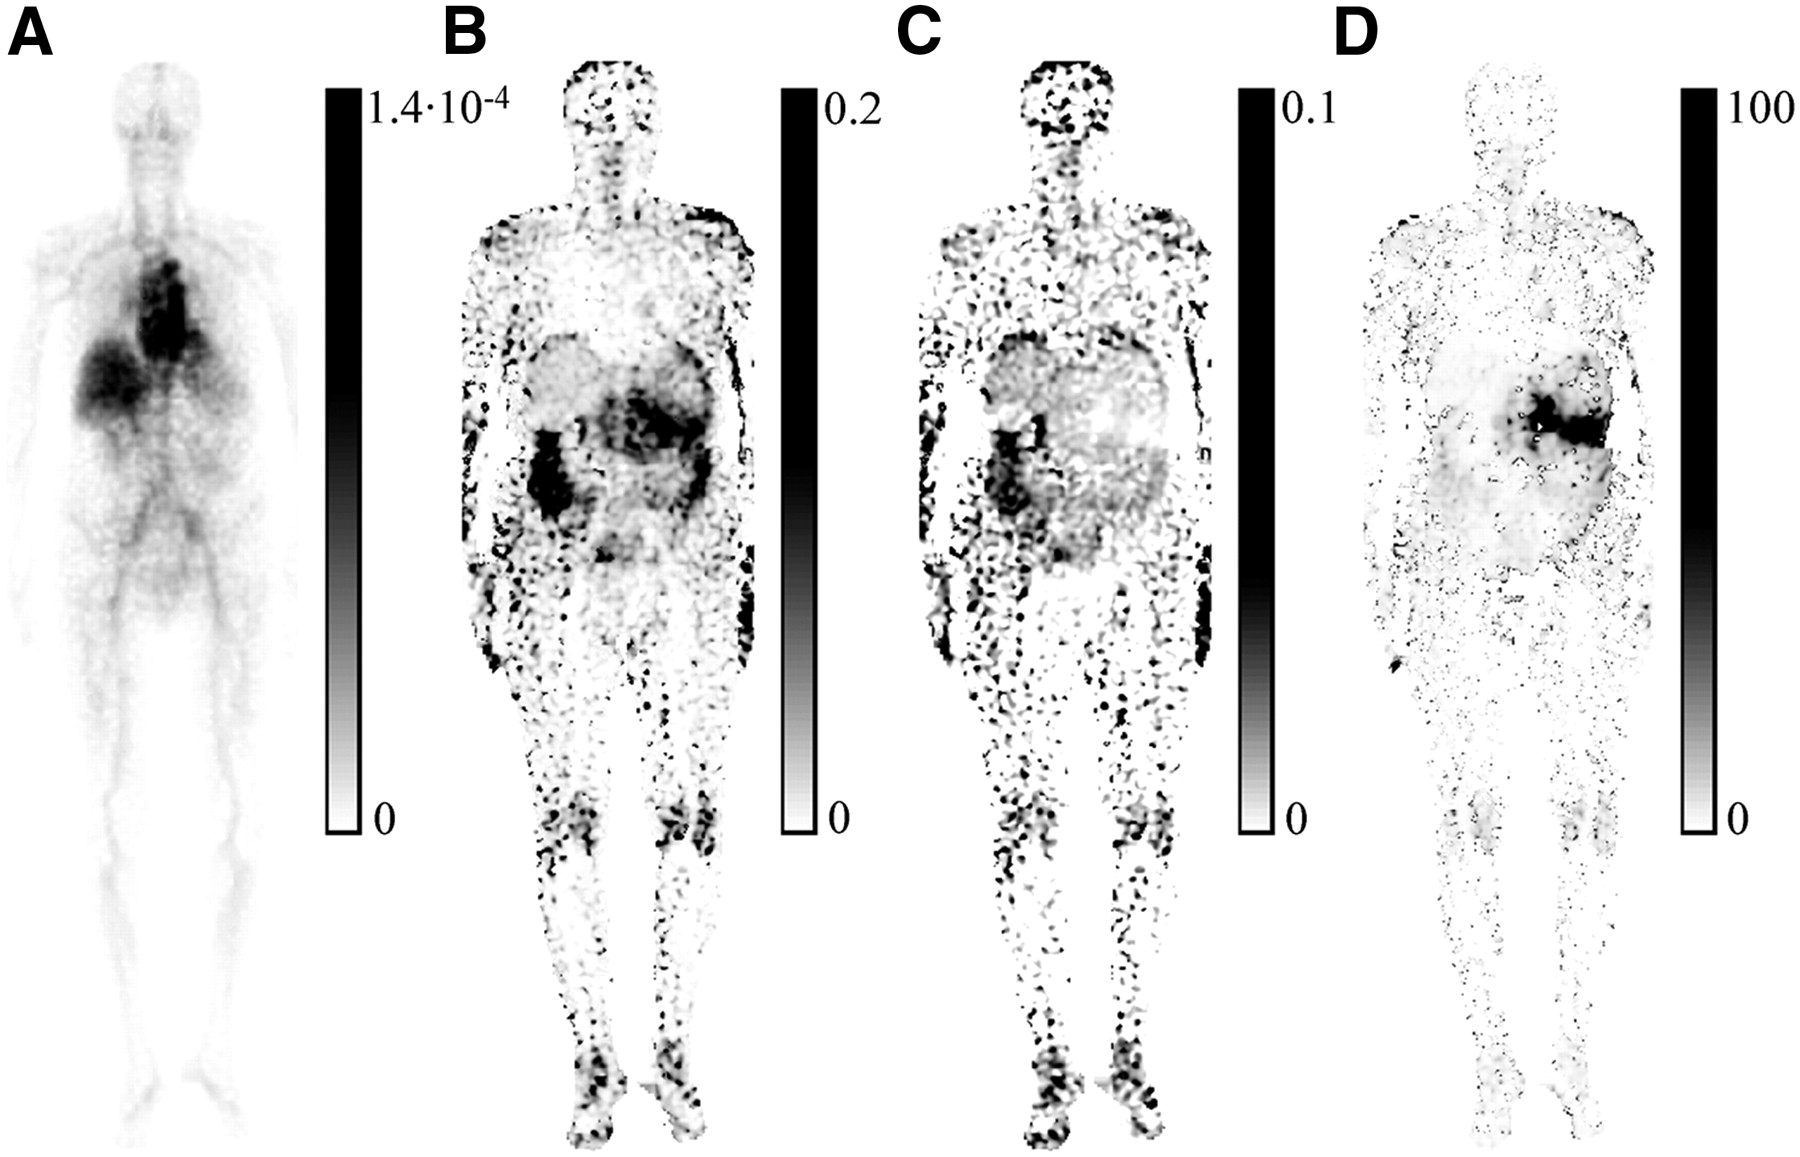
    Parametric images for patient 1. (A) α: fractional blood volume (−). (B) K′1: normalized extravasation rate constant (h−1). (C) k2: rate constant of washout from extravascular to vascular space (h−1). (D) V′d: extravascular-to-vascular activity ratio at equilibrium, equal to K′1/k2, and closely related to volume of distribution (−). Gray scales are to right of each image, with maximum and minimum values displayed. Patient 1 had tumor in abdomen, corresponding to high-contrast region on V′d image (D).
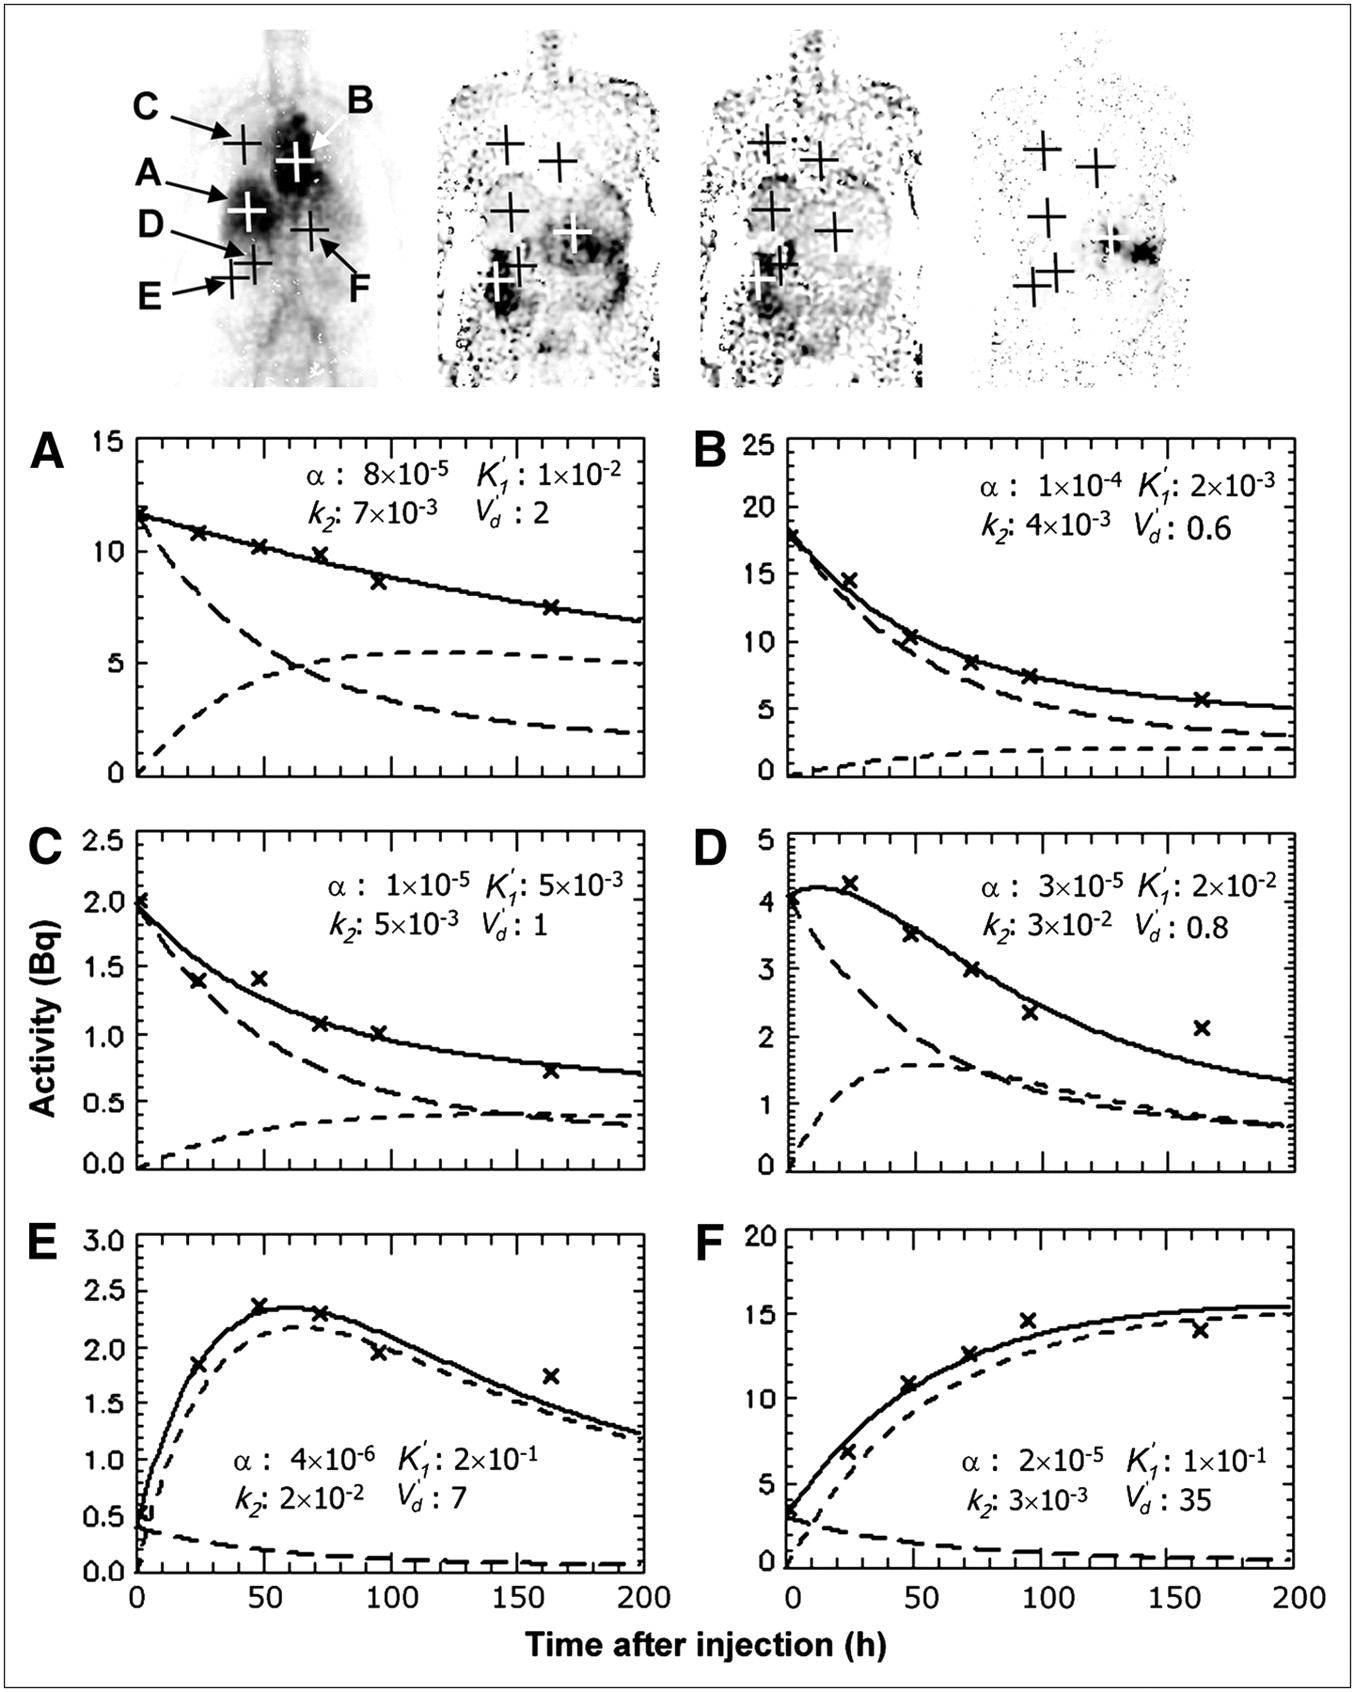
  • FIGURE 3. 
    • Download figure
    • Open in new tab
    • Download powerpoint
    FIGURE 3. 

    At top, from left to right, are the parametric images α, K′1, k2, and V′d, showing positions corresponding to time–activity curves for liver (A), heart (B), lung (C), kidney (D), intestinal tract (E), and tumor (F). Decay-corrected activity values from measured images are displayed as crosses. Solid line is fitted total-activity curve (ai(t)), long dashed line is vascular activity (av,i(t)), and short dashed line is extravascular activity (aev,i(t)). Correlation coefficient was between 0.97 and 0.99, and no filtering was used for the positions marked.
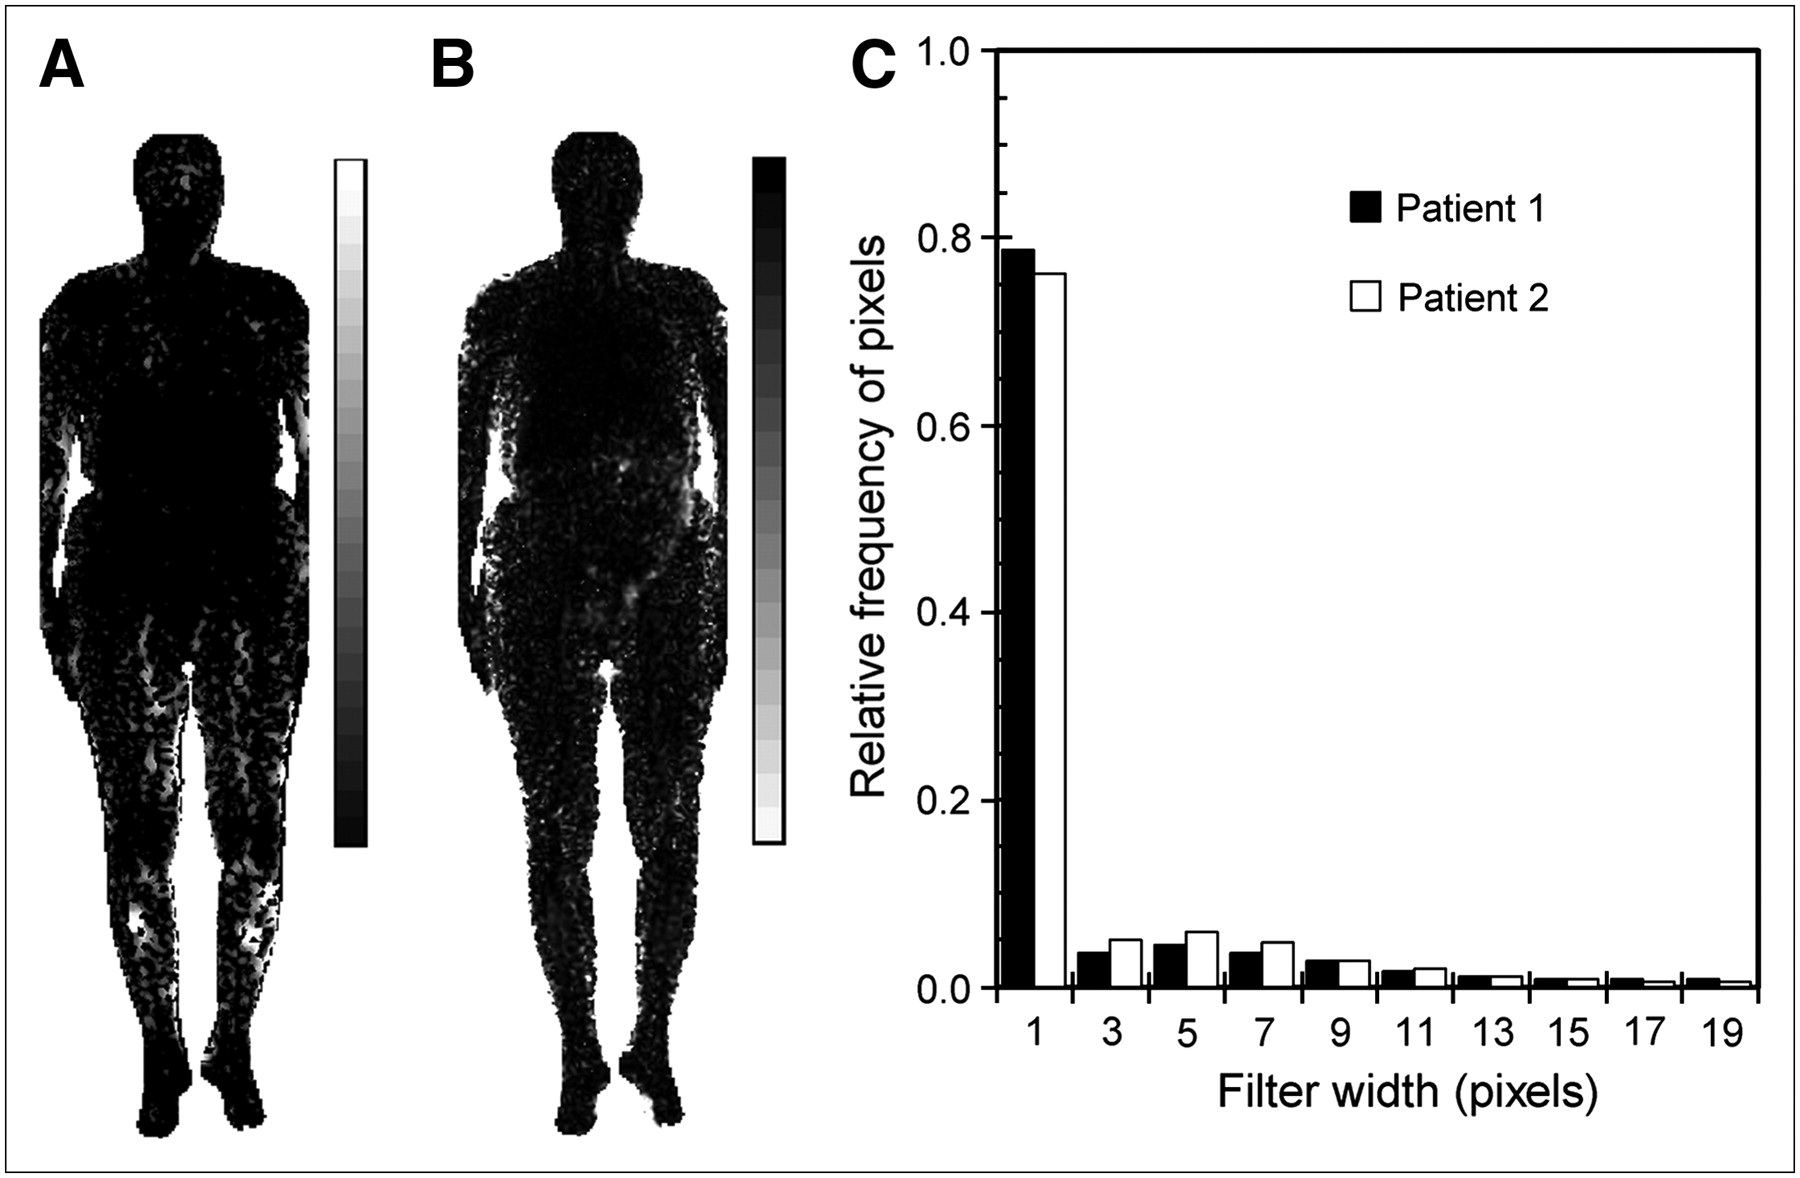
  • FIGURE 4. 
    • Download figure
    • Open in new tab
    • Download powerpoint
    FIGURE 4. 

    Distributions of measures of goodness of fit. (A) Filter width applied for successful optimization of patient 1. Black corresponds to no filtering, and white is maximum level applied (19-pixel-wide average filter). (B) Squared correlation coefficient between measured and fitted time–activity curves of patient 1; black implies high correlation. (C) Frequency histogram of filter width required for successful time–activity curve optimization of both patients.

  • FIGURE 5. 
    • Download figure
    • Open in new tab
    • Download powerpoint
    FIGURE 5. 

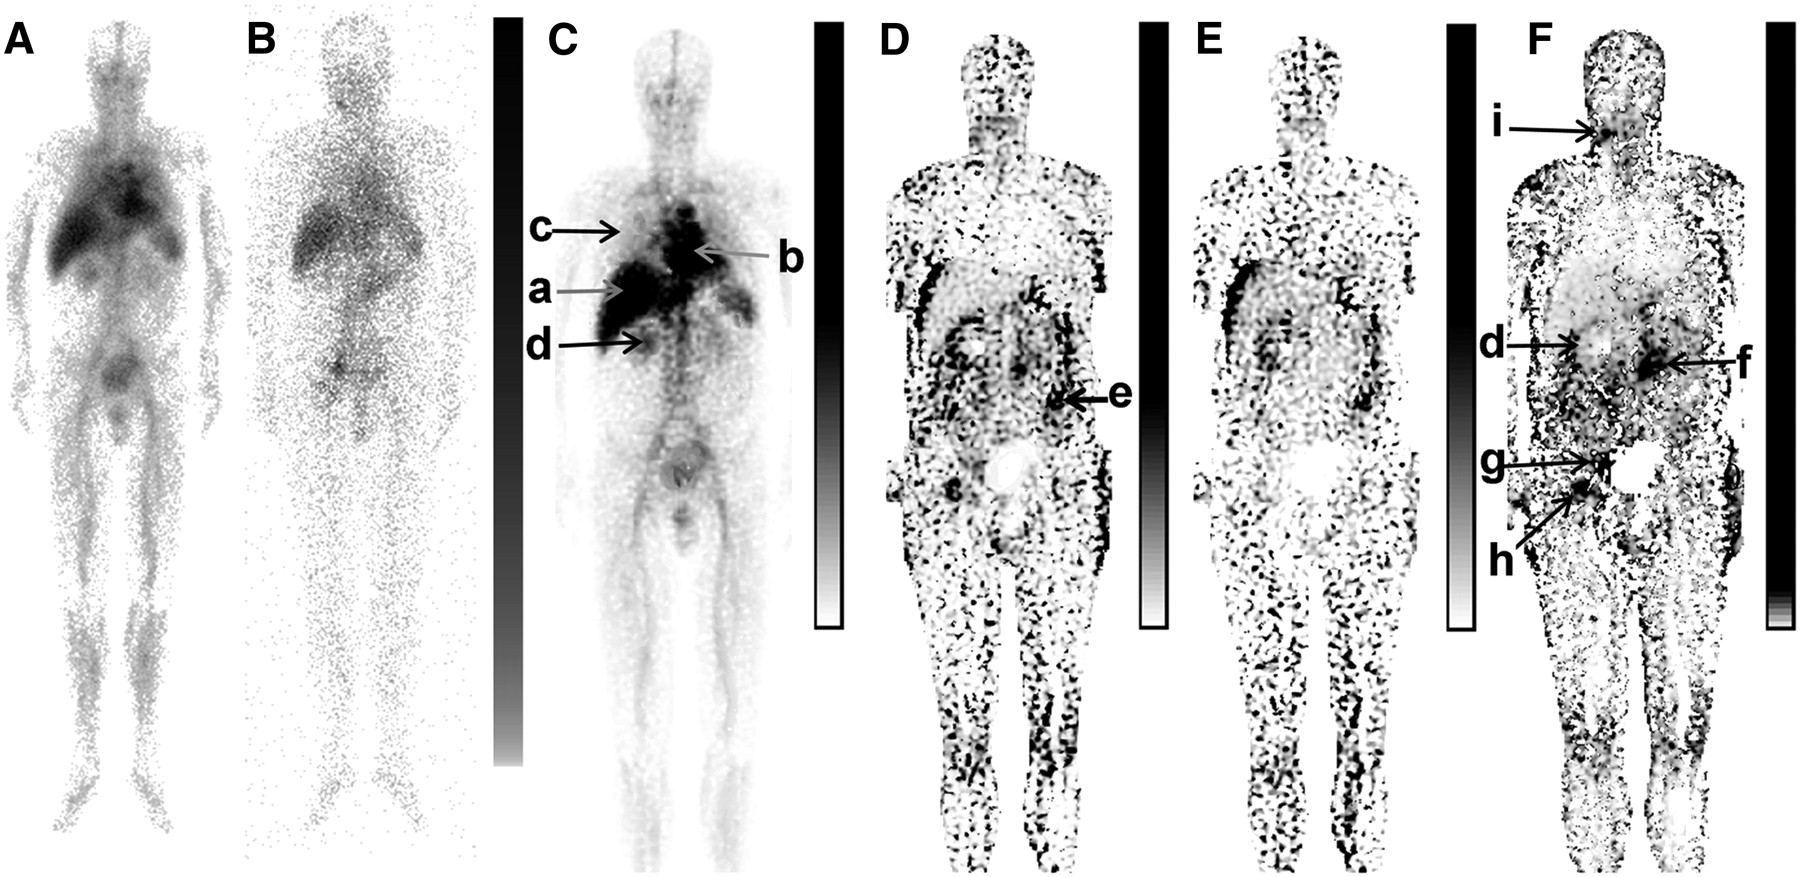
    Patient 2. (A and B) Raw-count geometric-mean images acquired at 1.1 and 164 h after injection. (C–F) Parametric images α (C), K′1 (D), k2 (E), and V′d (F), with lower limbs excluded for space reasons. Arrows a–i indicate positions at which parameter values were obtained: a = liver (α = 5 × 10⁻⁵, K′1 = 1 × 10⁻², V′d = 1.2), b = heart (α = 6 × 10⁻⁵, K′1 = 6 × 10⁻³, V′d = 0.6), c = lung (α = 1 × 10⁻⁵, K′1 = 4 × 10⁻³, V′d = 0.3), d = kidney (α = 2 × 10⁻⁵, K′1 = 3 × 10⁻², V′d = 1.4), e = intestinal tract (α = 7 × 10⁻⁶, K′1 = 8 × 10⁻², V′d = 3), f = paraaortic malignancy (α = 8 × 10⁻⁶, K′1 = 9 × 10⁻², V′d = 11), and g, h, and i = iliac, inguinal, and cervical nodes, respectively (α = 1 × 10⁻⁵, K′1 = 5 × 10⁻², V′d = 7–10).

  • FIGURE 6. 
    • Download figure
    • Open in new tab
    • Download powerpoint
    FIGURE 6. 

    Cumulated activity images in patients 1 (A–C) and 2 (D and E). (A) Total cumulated activity (only patient 1 shown). (B and D) Vascular component Ãv. (C and E) Extravascular component Ãev. Ãev images exhibits high contrast values in positions corresponding to confirmed malignant regions, for patient 1 (C) in abdomen and 2 locations in mediastinum, and for patient 2 (E) at cervical, paraaortic, iliac, and inguinal nodes.

PreviousNext
Back to top

In this issue

Journal of Nuclear Medicine: 48 (8)
Journal of Nuclear Medicine
Vol. 48, Issue 8
August 2007
  • Table of Contents
  • Table of Contents (PDF)
  • About the Cover
  • Index by author
Print
Download PDF
Article Alerts
Sign In to Email Alerts with your Email Address
Email Article

Thank you for your interest in spreading the word on Journal of Nuclear Medicine.

NOTE: We only request your email address so that the person you are recommending the page to knows that you wanted them to see it, and that it is not junk mail. We do not capture any email address.

Enter multiple addresses on separate lines or separate them with commas.
Parametric Images of Antibody Pharmacokinetics Based on Serial Quantitative Whole-Body Imaging and Blood Sampling
(Your Name) has sent you a message from Journal of Nuclear Medicine
(Your Name) thought you would like to see the Journal of Nuclear Medicine web site.
Citation Tools
Parametric Images of Antibody Pharmacokinetics Based on Serial Quantitative Whole-Body Imaging and Blood Sampling
Katarina Sjögreen Gleisner, Mattias Nickel, Ola Lindén, Kjell Erlandsson, Karin Wingårdh, Sven-Erik Strand
Journal of Nuclear Medicine Aug 2007, 48 (8) 1369-1378; DOI: 10.2967/jnumed.107.039503

Citation Manager Formats

  • BibTeX
  • Bookends
  • EasyBib
  • EndNote (tagged)
  • EndNote 8 (xml)
  • Medlars
  • Mendeley
  • Papers
  • RefWorks Tagged
  • Ref Manager
  • RIS
  • Zotero
Share
Parametric Images of Antibody Pharmacokinetics Based on Serial Quantitative Whole-Body Imaging and Blood Sampling
Katarina Sjögreen Gleisner, Mattias Nickel, Ola Lindén, Kjell Erlandsson, Karin Wingårdh, Sven-Erik Strand
Journal of Nuclear Medicine Aug 2007, 48 (8) 1369-1378; DOI: 10.2967/jnumed.107.039503
Twitter logo Facebook logo LinkedIn logo Mendeley logo
  • Tweet Widget
  • Facebook Like
  • Google Plus One
Bookmark this article

Jump to section

  • Article
    • Abstract
    • MATERIALS AND METHODS
    • RESULTS
    • DISCUSSION
    • CONCLUSION
    • APPENDIX
    • Acknowledgments
    • Footnotes
    • References
  • Figures & Data
  • Info & Metrics
  • PDF

Related Articles

  • This Month in JNM
  • PubMed
  • Google Scholar

Cited By...

  • No citing articles found.
  • Google Scholar

More in this TOC Section

  • Tumor Uptake of Anti-CD20 Fabs Depends on Tumor Perfusion
  • How Sensitive Is the Upper Gastrointestinal Tract to 90Y Radioembolization? A Histologic and Dosimetric Analysis in a Porcine Model
  • 11C-Methionine PET of Myocardial Inflammation in a Rat Model of Experimental Autoimmune Myocarditis
Show more Basic Science Investigations

Similar Articles

SNMMI

© 2025 SNMMI

Powered by HighWire