


Article Figures & Data
Figures
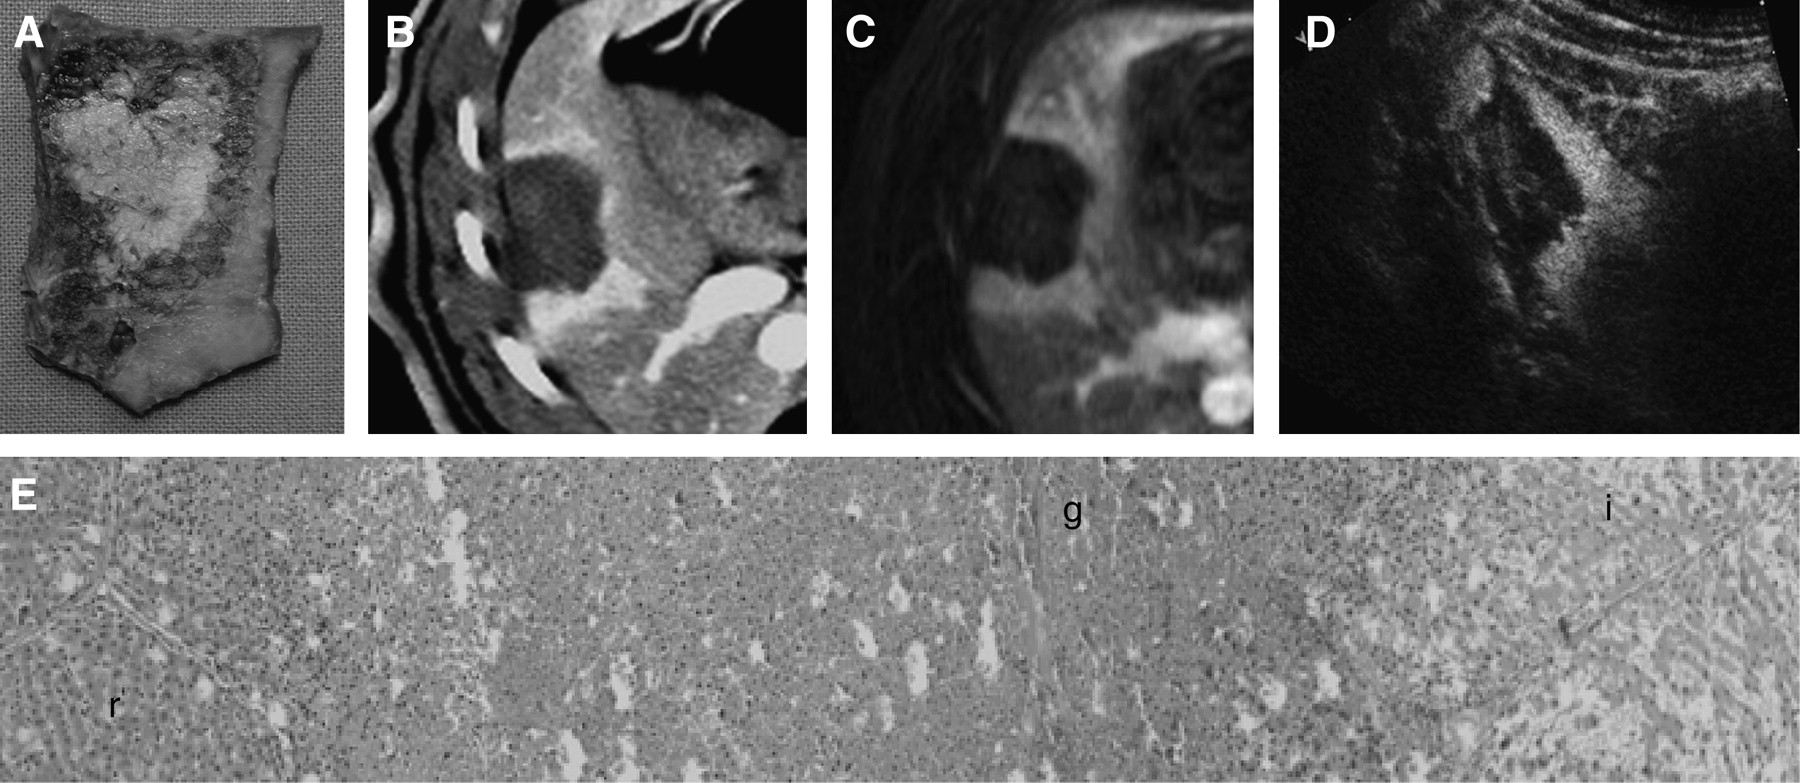
- FIGURE 1.
Macroscopic tissue sample (A) obtained 3 d after radiofrequency ablation further shows blood-filled sinusoids and extent of reactive changes in periphery of necrosis, compared with tissue samples sectioned immediately after radiofrequency ablation. Morphologic imaging (CT [B], MRI [C], and ultrasound [D]) depict pronounced and extended enhancement in periphery of necrosis. Enhancement corresponded on histopathology images (E) to mixture of engorged sinusoids and beginning inflammatory reaction, with granulation and hyperemia. Regenerating liver tissue (r) surrounds zone of necrotic liver tissue, with focal granulocytic infiltrate (g) and inner zone of necrosis (i).
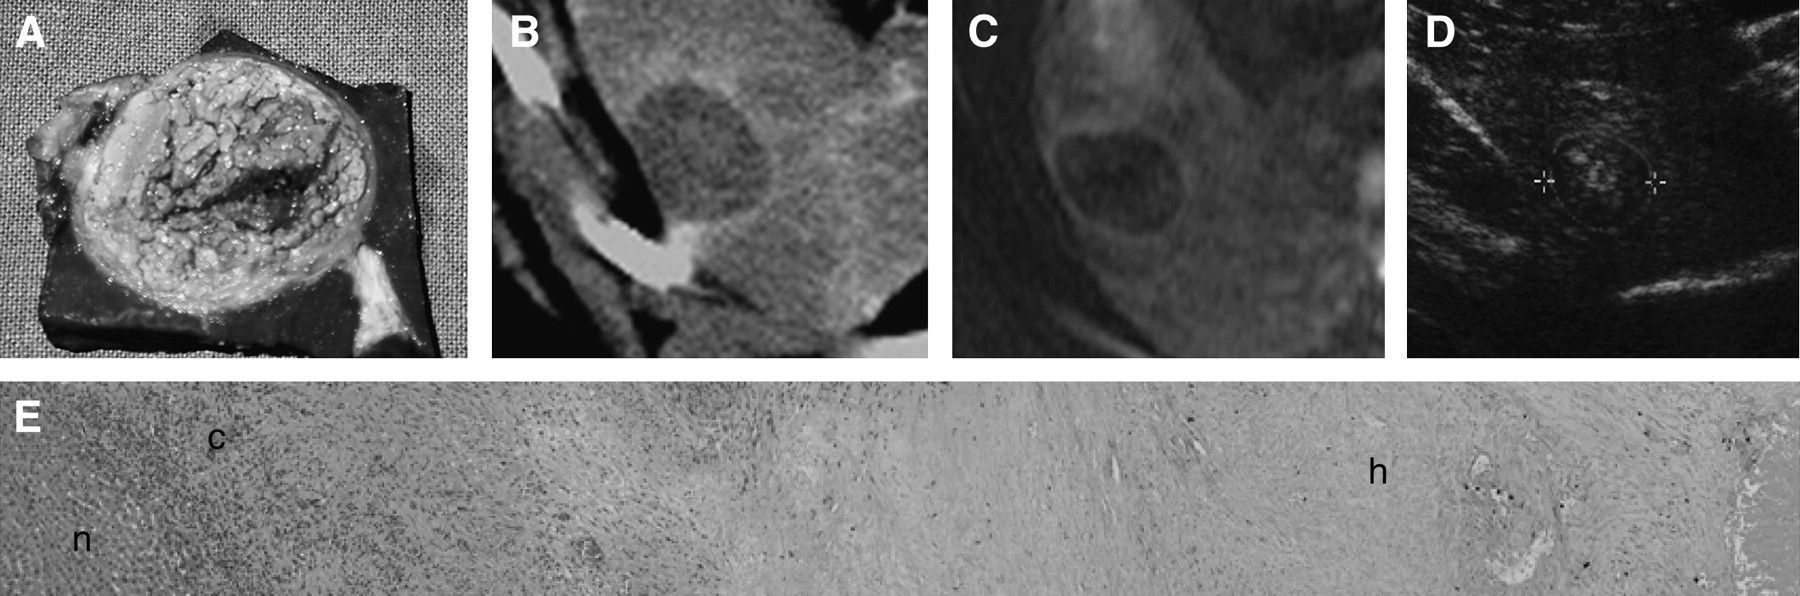
- FIGURE 2.
Macroscopic tissue sample (A) obtained 6 mo after radiofrequency ablation demonstrates well-defined capsule surrounding necrosis, with maximum diameter of 3 mm, corresponding to thin-rim peripheral enhancement on morphologic images (CT [B], MRI [C], and ultrasound [D]) and fibrosis on histopathology images (E). Normal liver (n) surrounds cellular scar tissue (c) transforming into hypocellular scar tissue (h) and central necrosis.
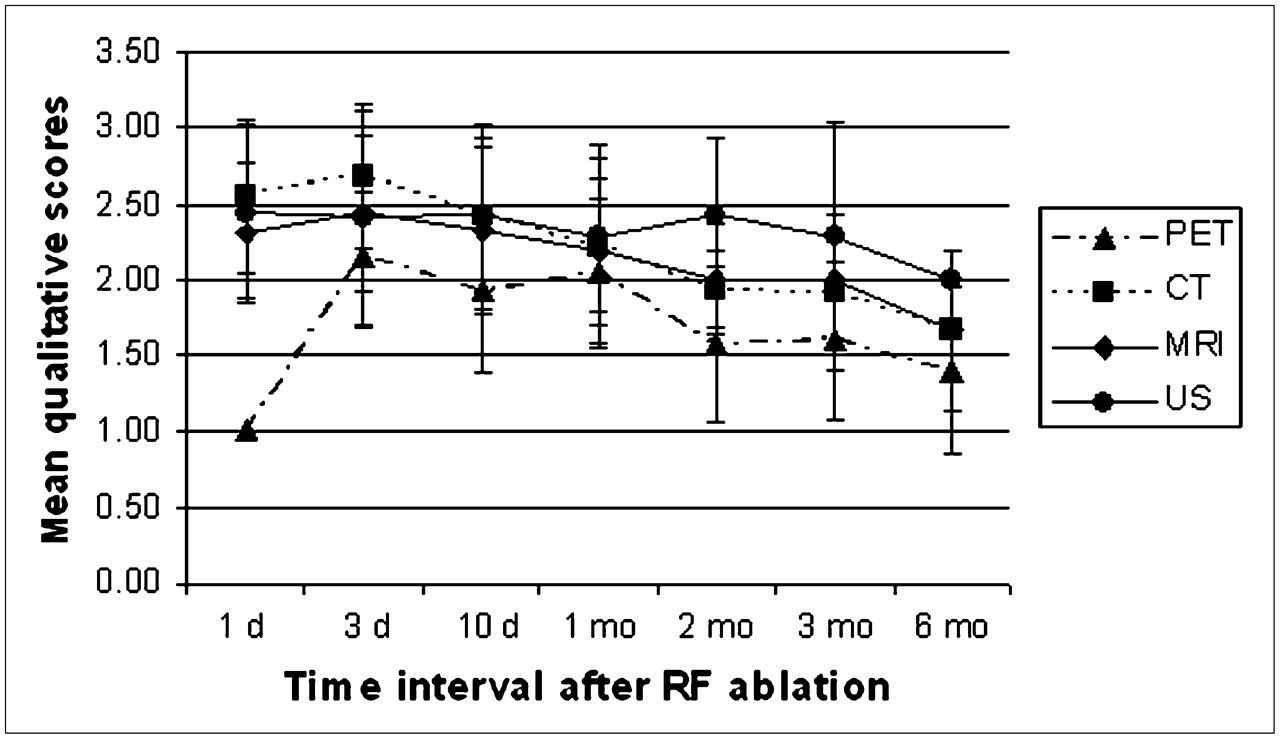
- FIGURE 3.
Qualitative image analysis according to 3-score scale revealed increased enhancement in periphery of induced necrosis, compared with normal liver parenchyma, on all morphologic imaging modalities. Decrease in intensity can be seen on follow-up-imaging. On PET, no increase in glucose metabolism was found immediately after radiofrequency ablation, leading to score of 1 in all 40 lesions. Peak enhancement surrounding lesions can be seen at 3 d to 1 mo after radiofrequency ablation. Error bars represent SD. US = ultrasound.
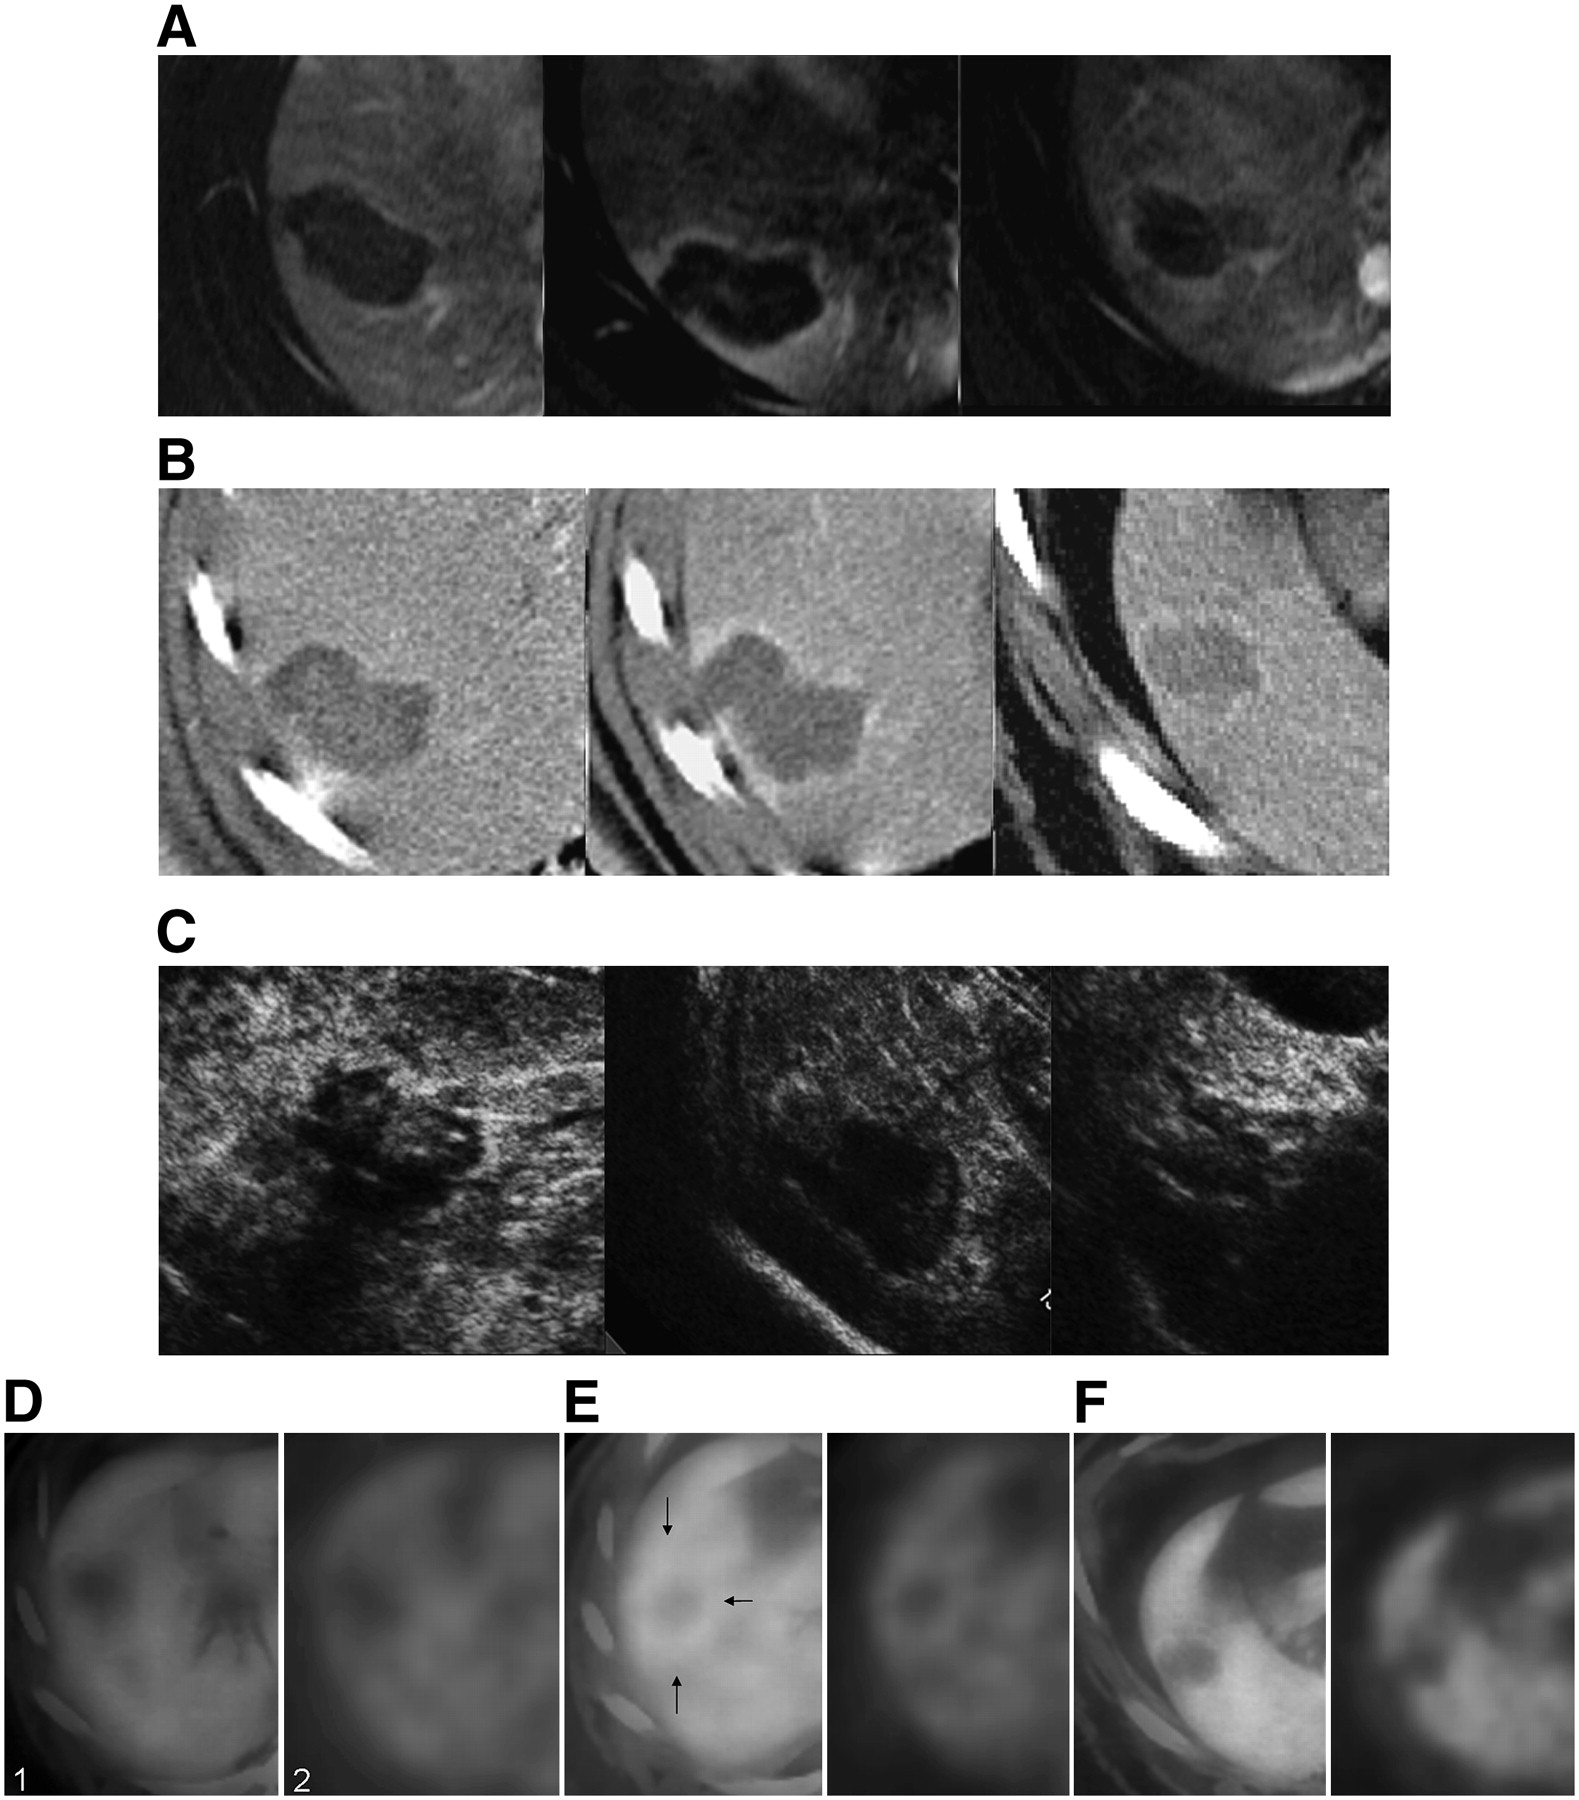
- FIGURE 4.
Transverse images acquired immediately, 10 d, and 6 mo after radiofrequency ablation demonstrate peripheral enhancement in arterial phase at all follow-up intervals on MRI (A), CT (B), and ultrasound (C). Extent and intensity of enhancement show decay within 6 mo. Functional data provided by PET/CT (1) and PET (2) demonstrate area of decreased 18F-FDG uptake surrounded by homogeneous tracer distribution immediately after radiofrequency ablation (D). Tissue regeneration with proliferative activity induced increased glucose metabolism (arrows) from 3 d (E) to 3 mo after radiofrequency ablation. Six months after interventional procedure, homogeneous tracer distribution can be found again (F).
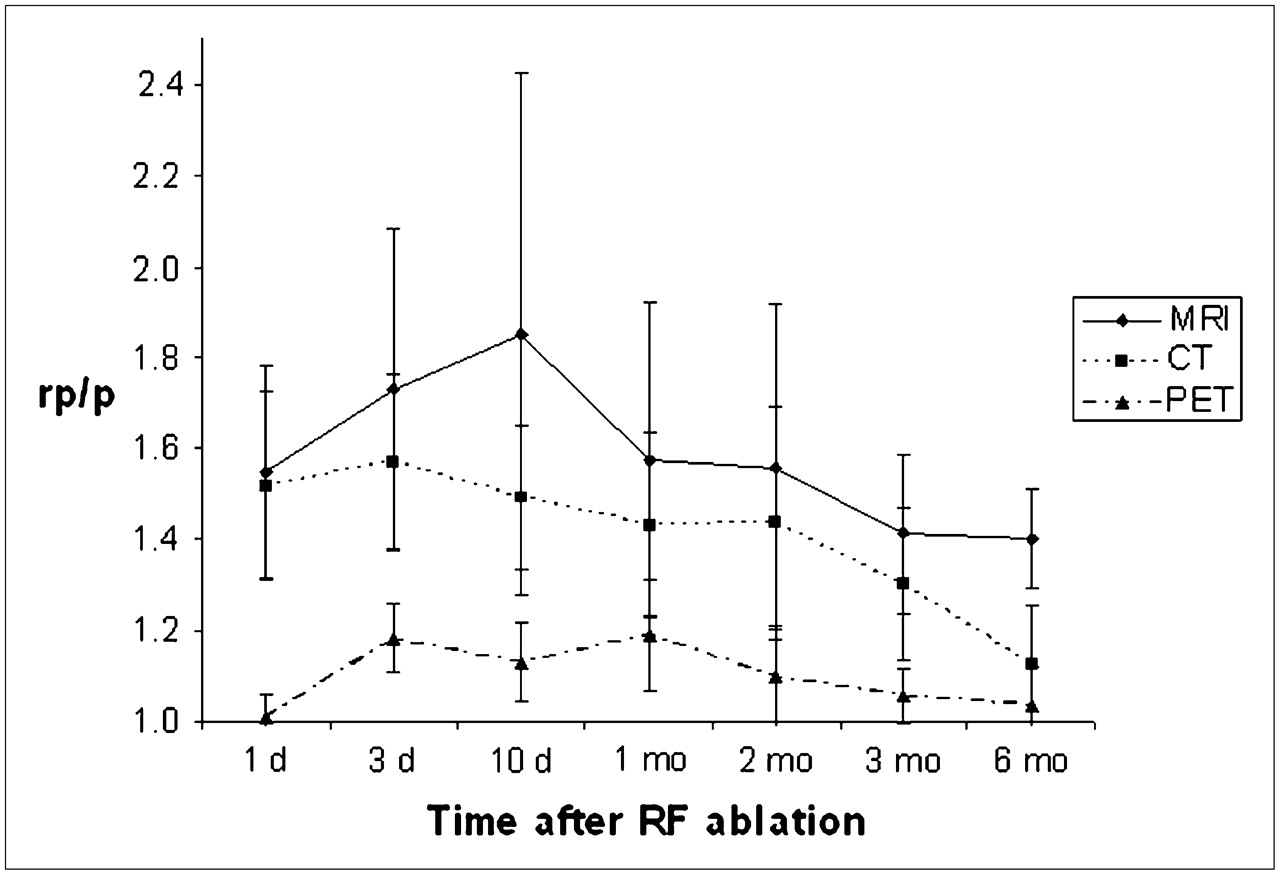
- FIGURE 5.
Graph shows mean enhancement ratio of lesion periphery to normal liver parenchyma for CT and MRI as well as mean ratio of activity concentration of lesion periphery to activity concentration of normal liver parenchyma on PET. Because of rimlike increase in enhancement at periphery of coagulation, ratios are elevated for morphologic imaging modalities, with slow decay beginning at follow-up interval of 1 mo. Homogeneous tracer distribution on PET leads to mean ratio of 1.01 for functional data analysis immediately after radiofrequency ablation, whereas ratio increase of nearly 20% can be seen between 3 d and 1 mo after interventional procedure. At 6 mo, interval mean ratio approaches baseline values. Error bars represent SD.
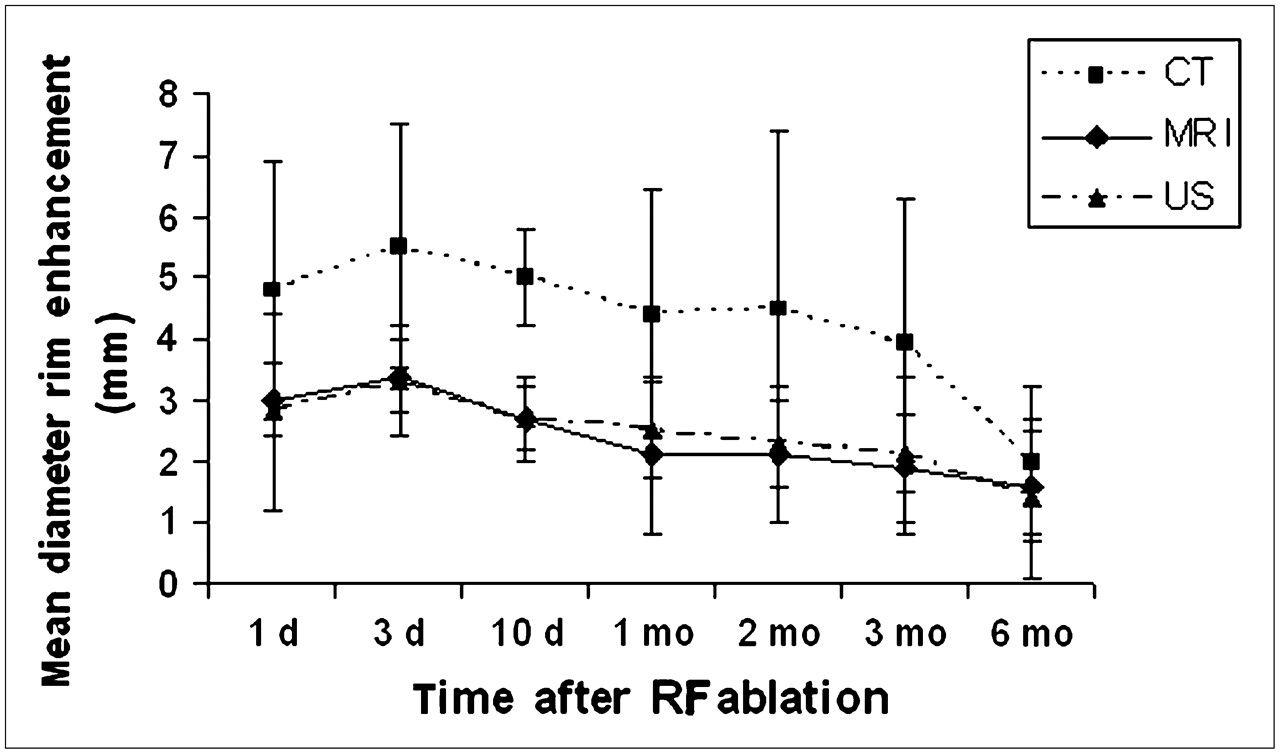
- FIGURE 6.
Graph shows mean extent of enhancement in periablational region for MRI, CT, and ultrasound (US). Three to 10 d after radiofrequency ablation, enhancement along ablated tissue became more prominent than immediately after radiofrequency ablation; consequently, slow decay of extent of arterial enhancement can be seen.


Tables
- TABLE 1
Morphologic Measurements of Coagulation on All Imaging Modalities, Compared with Standard of Reference
Imaging modality 3 h 3 d 10 d 1 mo 2 mo 3 mo 6 mo CT n 40 34 28 22 17 12 6 Longitudinal diameter (cm) 4.00 ± 0.50 4.00 ± 0.64 3.54 ± 0.56 3.03 ± 0.61 2.53 ± 0.54 2.37 ± 0.56 2.16 ± 0.83 Transverse diameter (cm) 2.52 ± 0.50 2.53 ± 0.64 2.38 ± 0.51 1.95 ± 0.37 1.78 ± 0.33 1.76 ± 0.50 1.54 ± 0.69 MRI n 40 34 28 22 17 12 6 Longitudinal diameter (cm) 4.15 ± 0.63 4.05 ± 0.69 3.67 ± 0.69 3.03 ± 0.54 2.67 ± 0.52 2.53 ± 0.57 2.40 ± 0.83 Transverse diameter (cm) 2.56 ± 0.56 2.56 ± 0.61 2.37 ± 0.53 1.93 ± 0.39 1.79 ± 0.37 1.76 ± 0.46 1.64 ± 0.60 Ultrasound n 40 34 28 22 17 12 6 Longitudinal diameter (cm) 3.80 ± 0.69 3.77 ± 0.49 3.71 ± 0.61 3.06 ± 0.60 2.66 ± 0.62 2.63 ± 0.66 2.36 ± 1.00 Transverse diameter (cm) 2.52 ± 0.47 2.44 ± 0.48 2.29 ± 0.49 2.00 ± 0.39 1.77 ± 0.37 1.78 ± 0.46 1.54 ± 0.59 PET/CT n 40 34 28 22 17 12 6 Longitudinal diameter (cm) 3.97 ± 0.82 3.94 ± 0.76 3.45 ± 0.86 3.09 ± 0.60 2.65 ± 0.46 2.57 ± 0.58 2.44 ± 0.63 Transverse diameter (cm) 2.48 ± 0.46 2.47 ± 0.43 2.36 ± 0.51 2.05 ± 0.48 1.94 ± 0.32 1.86 ± 0.47 1.95 ± 0.62 Standard of reference n 6 6 6 5 5 6 6 Longitudinal diameter (cm) 3.86 ± 0.51 3.93 ± 0.61 3.56 ± 0.49 2.91 ± 0.62 2.31 ± 0.28 2.34 ± 0.36 2.0 ± 0.74 Transverse diameter (cm) 2.27 ± 0.26 2.25 ± 0.28 2.13 ± 0.27 1.86 ± 0.22 1.71 ± 0.21 1.86 ± 0.30 1.60 ± 0.59 Values are mean ± SD. n is number of lesions evaluated in each group. Animals that were going on through the longer follow-up period underwent all examinations planned immediately and at the different intervals until planned sacrifice date. Three minipigs were sacrificed after each follow-up imaging procedure. In 2 pigs (1-mo and 2-mo control groups), only 1 radiofrequency ablation could be performed because of hypoplastic left hepatic lobe.


