


Abstract
Mutations in the p53 gene, often resulting in loss of wild-type (WT) p53 expression, are found at high frequencies in several cancer types. High uptake of 18F-FDG detected using 18F-FDG PET has been associated with a poor prognosis. To determine whether high 18F-FDG uptake may be related to decreased expression of WT p53, we examined 18F-FDG uptake in cells transfected with dominant negative p53 constructs that abrogate WT p53 function. Methods: Two clones of MCF-7 breast cancer cells were stably transfected with a dominant negative p53 construct. 18F-FDG uptake, hexokinase (HK) activity, and glucose transport were measured in each clone and in the control WT cells from which the clones had been derived. The expression of glucose transporters, HKs, and glucose-6-phosphatase was determined using microarray technology. Results: Microarray experiments revealed that glucose transporters 1, 8, and 10 were expressed in MCF-7 cells, whereas glucose-6-phosphatase was absent. HK I was the principal HK in MCF-7 cells but was not differentially expressed at the messenger RNA level in the dominant negative p53 clones, compared with WT cells. However, increased HK activity was observed in both dominant negative p53 clones, compared with WT MCF-7. 18F-FDG uptake was increased in both clones expressing the dominant negative p53 constructs. Conclusion: These data suggest that abrogation of p53 in breast cancer is associated with specific changes in glucose metabolism detected by PET.
p53 is essential in determining the cellular response to DNA damage. For example, low levels of p53 induce DNA repair whereas high levels direct the cell to undergo apoptosis (1). Mutations in the p53 gene, often resulting in loss of wild-type (WT) p53 expression, are found at high frequencies in several types of cancer. For example, in small cell lung carcinomas (2), the p53 gene has a mutation frequency of about 70%, and about 30% of breast tumors (3) have the mutant p53 gene. Mutations in the p53 gene have been shown to be associated with resistance to some (1,4) but not all chemotherapy agents (5).
Exploiting the enhanced glucose use exhibited by tumor cells, compared with normal cells, 18F-FDG PET is becoming a routine procedure for tumor detection (6). The increased 18F-FDG incorporation by tumor cells is due to high rates of glucose uptake by glucose transporters (GLUTs) and phosphorylation by hexokinase (HK) and low activity of the dephosphorylating enzyme glucose-6-phosphatase in tumor cells, compared with normal cells.
Several studies have shown that a high standardized uptake value for 18F-FDG before treatment is associated with a poor prognosis (7–11). Because a number of clinical studies (12,13) have reported that 18F-FDG uptake correlates with p53 expression, the enhanced levels of 18F-FDG uptake by tumors with a poor prognosis may at least partly reflect their abnormal expression of p53. Further, WT p53 has been shown to downregulate GLUT-1 and GLUT-4 (14), and binding sites for mutant p53 have been demonstrated on the promoter region of HK II (15). Taken together, these findings suggest that p53 expression may influence the incorporation of 18F-FDG into tumor cells. Overexpression of p53 is generally considered to be a marker of inactivated mutant p53 (16). Therefore, we have examined 18F-FDG uptake in 2 clones of MCF-7 breast cancer cells stably transfected with a dominant negative p53 construct that abrogates WT p53 activity (17).
MATERIALS AND METHODS
Chemicals
Unless otherwise stated, all chemicals and enzymes were obtained from Sigma-Aldrich.
Cell Lines
MCF-7 breast carcinoma cells (American Type Culture Collection) were transfected with a dominant negative (DDp53) construct that abrogates p53 WT function (17). Stable transfectants were selected in hygromycin (150 μg/mL), and 2 clones displaying a stable phenotype were propagated as cell lines DD1 and DD2. All cells were maintained in Dulbecco's Modified Eagle Medium (Invitrogen) supplemented with fetal bovine serum (10% v/v) (Invitrogen) and penicillin streptomycin (100 units of each per milliliter). Additionally, cell lines DD1 and DD2 were maintained in hygromycin (150 μg/mL). The stability of the 2 DDp53 clones was checked periodically (typically monthly) by performing Western blotting for p53.
Gene Expression Analysis
Cells were seeded in 10-cm dishes at densities of 2.8 × 10⁵ cells/mL (MCF-7) and 2.3 × 10⁵ cells/mL (DD1 and DD2) and grown for 16 h. The medium was then removed, rinsed with phosphate-buffered saline (PBS), and replaced with fresh medium without hygromycin. After a further 23 h, cells were harvested and total RNA was isolated using the RNeasy kit (QIAGEN). RNA quality was checked using a model 2100 bioanalyzer (Agilent Technologies). Complementary DNA was synthesized from 10 μg of total RNA using Superscript II reverse transcriptase (Invitrogen) and purified using the GeneChip sample cleanup module (Affymetrix). Complementary RNA was then synthesized using the BioArray high-yield RNA transcript labeling kit (Enzo Diagnostics) and purified using the GeneChip sample cleanup module. Fifteen micrograms of complementary RNA were fragmented according to the manufacturer's instructions (Affymetrix) and hybridized to human genome U133A and U133B arrays. The arrays were then washed and stained using a GeneChip fluidics station 400 according to the manufacturer's instructions (Affymetrix). Arrays were scanned using the GeneChip scanner 2500 (Affymetrix) and quantitated using microarray software (MAS, version 5.0; Affymetrix) to give present/absent calls. The signal intensity values presented here were obtained after background adjustment and normalization using RMAExpress software (University of California, Berkeley) (18).
18F-FDG Uptake
Cells were seeded in 25-cm2 tissue culture flasks. In one set of flasks from each subline, colchicine (125 nmol/L) was added 24 h before determination of 18F-FDG uptake. 18F-FDG uptake was determined on confluent cells by incubation of the cells for 20 min at 37°C with fresh medium containing 37 kBq of 18F-FDG per milliliter. The cells were washed 5 times with 5 mL of ice-cold PBS and harvested with trypsin. After addition of medium to neutralize the trypsin, 0.2 mL was prepared for cell cycle analysis, 0.8 mL of cell suspension was transferred into Eppendorf tubes, and uptake of 18F-FDG was determined in a well counter. The cells were then centrifuged and washed with 1 mL of PBS; the pellet was dissolved in 0.1 mL of NaOH (1 mol/L); and, after neutralization with 0.1 mL of HCl, protein content was determined.
Glucose Transport
Flasks of cells were seeded as for 18F-FDG uptake. Medium was removed and replaced with Dulbecco's modified Eagle medium containing 37 kBq of 3H-o-methylglucose (OMG) (GE Healthcare) for 10 s (initial experiments showed 3H-OMG uptake to be linear for 30 s) at 37°C (the medium contains 5 mmol of glucose per liter, which is about the same as the concentration in human plasma). The incubation was ended by rapid addition of 5 mL of ice-cold PBS containing the glucose transport inhibitor phloretin (200 μmol/L) followed by 3 further rapid washes. Cells were then trypsinized, half of them were added to 5 mL of Optima Gold scintillation fluid (Perkins-Elmer), and 3H-OMG uptake was determined in a scintillation counter. The remaining cells were prepared for protein assay.
HK Activity
Following the method of Miccoli et al. (19), cells were grown to confluence in 75-cm2 flasks with regular medium changes; harvested by trypsinization; and, after the addition of medium, collected into Eppendorf tubes. They were then washed with PBS and centrifuged at 10,000g for 1 min, and the pellet was then resuspended in 0.2 mL of homogenization buffer (Tris/HCl [10 mmol/L, pH 7.7], sucrose [0.25 mmol/L], dithiothreitol [0.5 mmol/L], aminohexanoic acid [1 mmol/L], and phenylmethylsulfonyl fluoride [1 mmol/L]) and homogenized in a 1-mL homogenizer at 4°C. The homogenized cells were then transferred to an Eppendorf tube and centrifuged at 1,000g for 10 min to remove cell debris. The supernatant was transferred to a new Eppendorf tube, the pellet was washed with 0.2 mL of homogenization buffer, and the supernatant was pooled. The protein content of the homogenate was determined on a 20-μL sample.
Enzyme activity was determined by the addition of 100 μL of homogenate to 0.9 mL of assay medium consisting of Tris/HCl (100 mmol/L, pH 8.0), glucose (10 mmol/L), nicotinamide adenine dinucleotide phosphate (NADP+) (0.4 mmol/L), MgCl2 (10 mmol/L), adenosine triphosphate (5 mmol/L), and 0.15 unit of glucose-6-phosphate dehydrogenase in a cuvette at 37°C. The reaction was followed by monitoring the change in absorbance at 340 nm due to the formation of reduced nicotinamide adenine dinucleotide phosphate. Enzyme activity was expressed as mU/mg protein using the extinction coefficient for reduced nicotinamine adenine dinucleotide phosphate (NADPH) of 6.3×10³ mol−1 cm−1.
Cell Content of 18F-FDG
Using a modification of Whitesell et al. (20), we incubated the cells with 18F-FDG for 30 min and then washed them 5 times with ice-cold PBS. They were then lysed by the addition of 1 mL of ice-cold 1% Triton X100 and left on ice for 5 min, and the lysate was collected and placed in an Eppendorf tube. One-half milliliter of CHCl3 was added, and the mixture was vigorously mixed and then centrifuged at 12,000g for 1 min. The aqueous phase was then passed through a preconditioned anion exchange cartridge (Alltech). Nonphosphorylated 18F-FDG was washed through with 10 mL of H2O (addition of 18F-FDG showed that this wash removed all 18F-FDG from the cartridge). Activity in the wash and cartridge was determined using a well counter.
Flow Cytometry
Cells collected for flow cytometry were centrifuged at 1,000g for 5 min, and after removal of the supernatant, the pellet was washed with PBS, fixed by the slow addition of 1 mL of ice-cold 70% ethanol, and left at −20°C for at least 24 h. The fixed cells were then washed with PBS containing 1% serum and then resuspended in staining buffer at 4°C for at least 20 min before analysis. The cell number was adjusted to 1 × 10⁶ cells in a volume of 0.5 mL of propidium iodide/ribonuclease staining buffer, and the suspension was incubated for 15 min at room temperature. The stained nuclei were kept at 4°C and protected from light. Flow cytometry was performed using a 488-nm laser light on a FACSCalibur flow cytometer (Becton Dickinson) and CellQuest software (Becton Dickinson) equipped for fluorescence detection, forward 90° light scatter, and doublet discrimination.
Protein Assay
After the cell pellets had been dissolved overnight in 1 mol of NaOH per liter at 37°C, the samples were neutralized by the addition of 1 mmol of HCl per liter, and protein content was determined using the bicinchoninic acid protein assay kit.
Statistical Procedures
Statistical differences between means were determined using the Student t test.
RESULTS
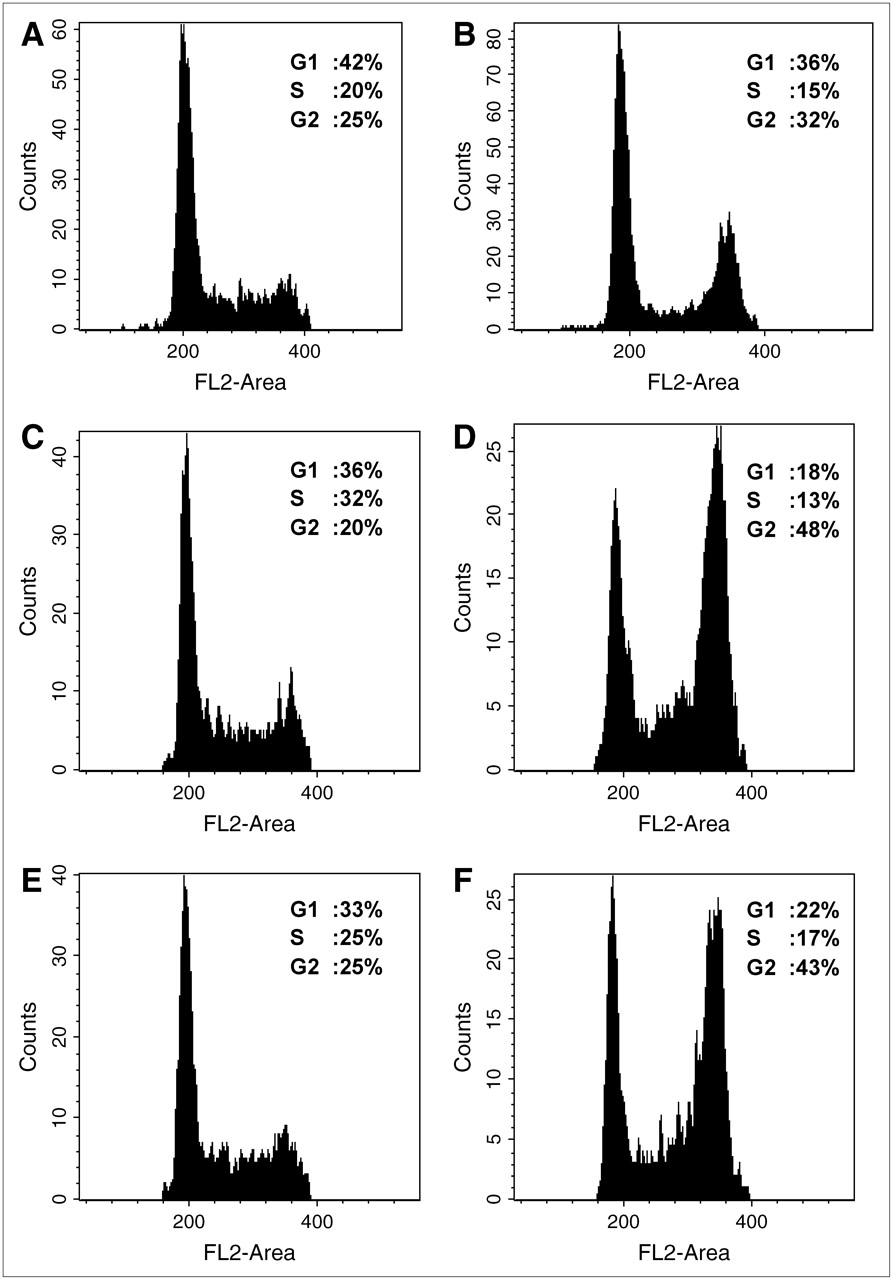
Figure 1 shows 18F-FDG uptake by WT and the 2 MCF-7 clones containing the dominant negative 53 construct (DD1 and DD2). 18F-FDG was significantly increased by 90% in DD1 (t = 12.45, P < 0.001) and by 110% in DD2 (t = 6.42, P < 0.001), compared with WT MCF-7 cells. A cell cycle distribution from each subline is shown in Figure 2. The proportion of proliferating cells (in S phase) was higher in the clones than in the WT cells. To determine the effect of cell cycle distribution on 18F-FDG uptake, we treated each cell line with colchicine for 24 h, resulting in a G2 block. Despite the change in cell cycle distribution, 18F-FDG uptake did not significantly differ between treated and untreated cell lines (WT colchicine-treated vs. control: t = 1.36, P > 0.1; DD1 colchicine-treated vs. control: t = 2.14, P > 0.05; DD2 colchicine-treated vs. control: t = 1.2, P > 0.1), suggesting that 18F-FDG uptake by these cell lines is not influenced by cell cycle phase.
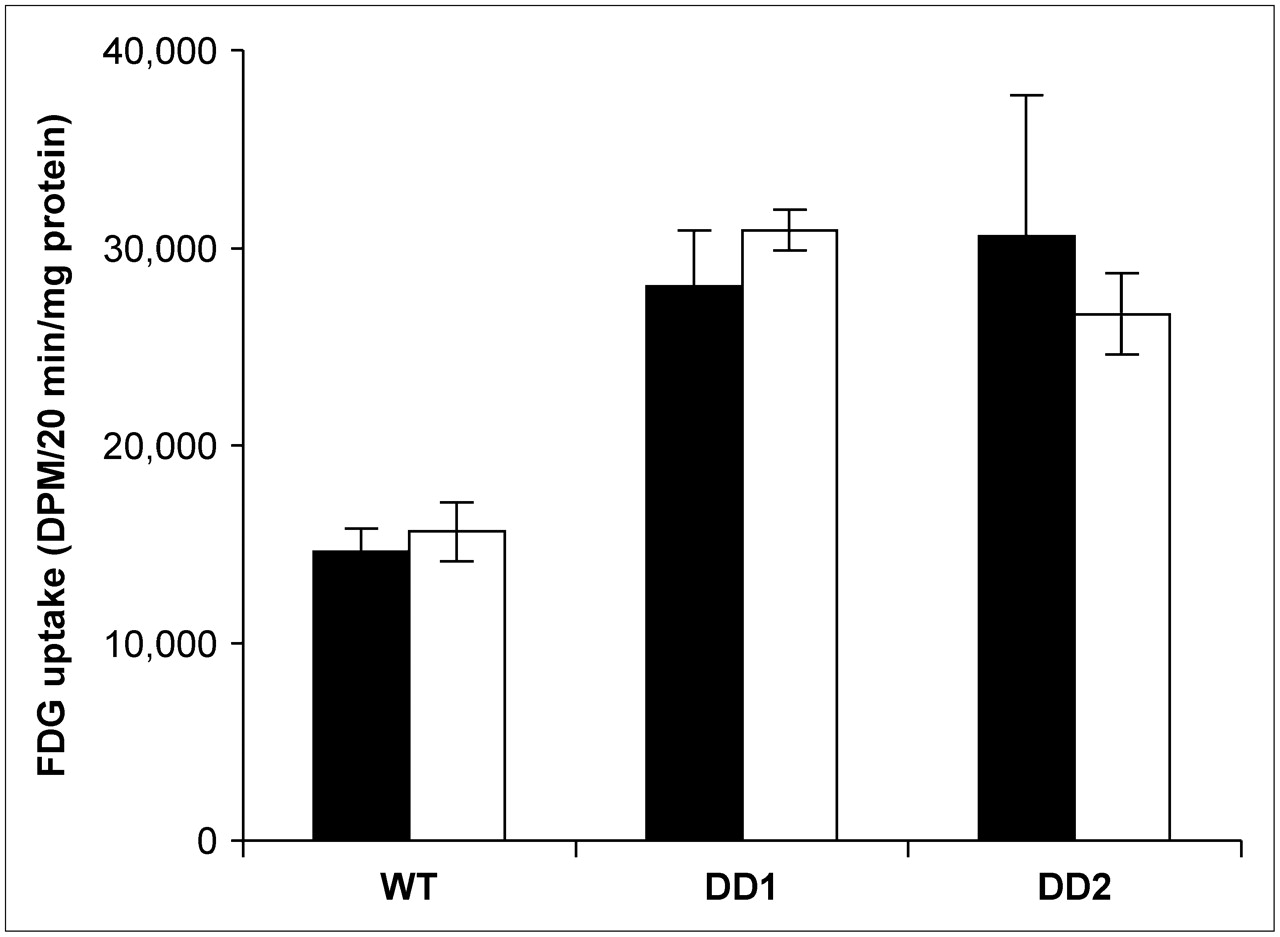
18F-FDG uptake (disintegrations per minute [DPM] per 20 min per milligram of protein) by WT MCF-7 cells and 2 clones (DD1 and DD2) of MCF-7 cells with dominant negative p53 constructs. White columns = untreated cells (n = 8); black columns = 24 h of colchicine treatment (n = 5).

Typical cell cycle distribution histograms from control and colchicine-treated WT MCF-7 cells and MCF-7 cells containing dominant negative p53 constructs: WT (A [untreated] and B [treated]), DD1 (C [untreated] and D [treated]), and DD2 (E [untreated] and F [treated]). Mean percentages of cells in G1, S, and G2 phases, determined using flow cytometry, in untreated and colchicine-treated cells are shown with each histogram.
18F-FDG incorporation was also determined in SKNSH, neuroblastoma cells transfected with a dominant negative construct that abrogates p53 expression (SKNSH-DD), and were compared with SKNSH cells with a sham construct. Cells containing both the sham and the dominant negative construct were selected using neomycin. In common with the MCF-7 cells, in which p53 expression was attenuated, the incorporation of 18F-FDG was greatly enhanced in SKNSH-DD cells (54,294 ± 2,865, n = 6) (t = 14.1, P < 0.0005), compared with the sham transfected cells (33,893 ± 2,088, n = 6).
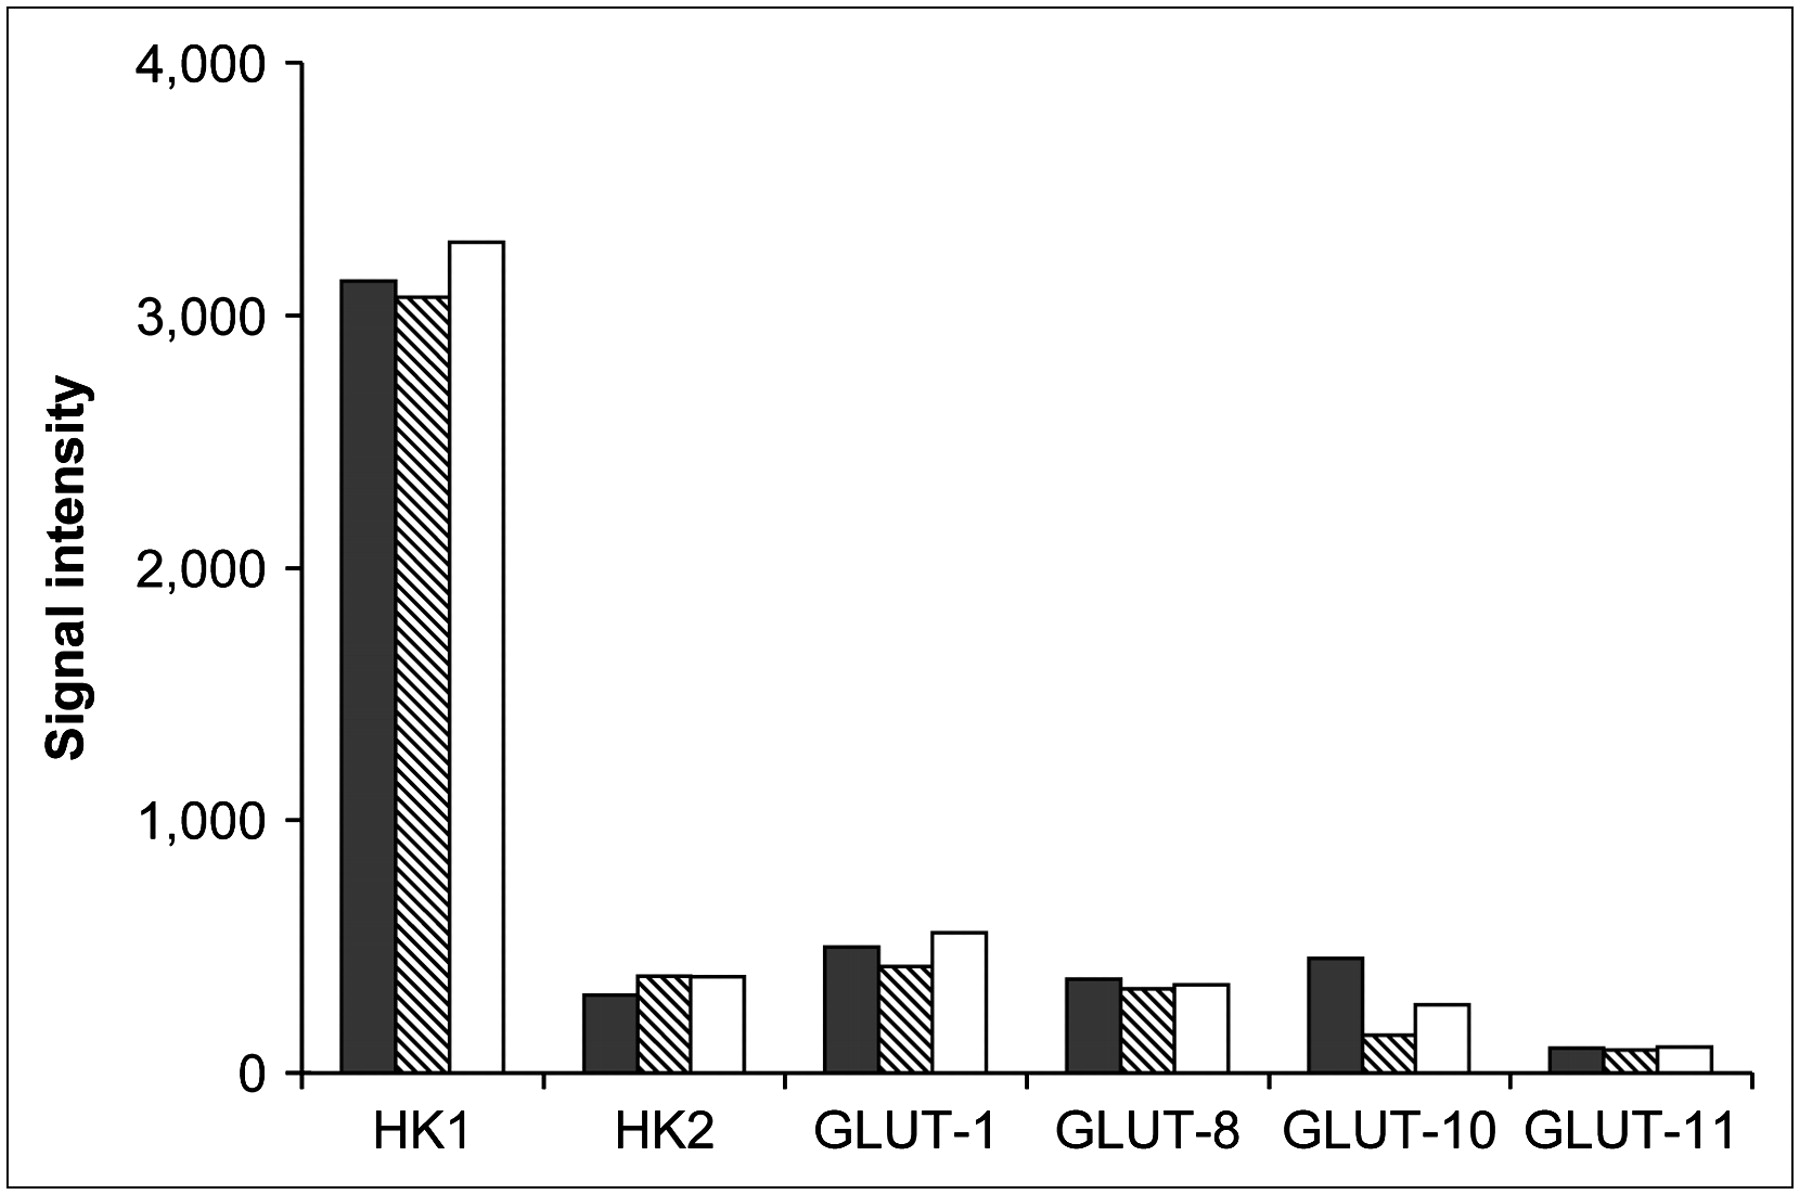
GLUT and HK gene expression are shown in Figure 3. GLUT-1, -8, -10, and -11 were expressed in the WT, DD1, and DD2 cells. The predominant HK expressed was HK I, and its expression in DD1 and DD2 was similar to that in the WT cells. Glucose-6-phosphatase was absent from all cell lines.

GLUT and HK gene expression in WT (black bars), DD1 (hatched bars), and DD2 (white bars) cells.
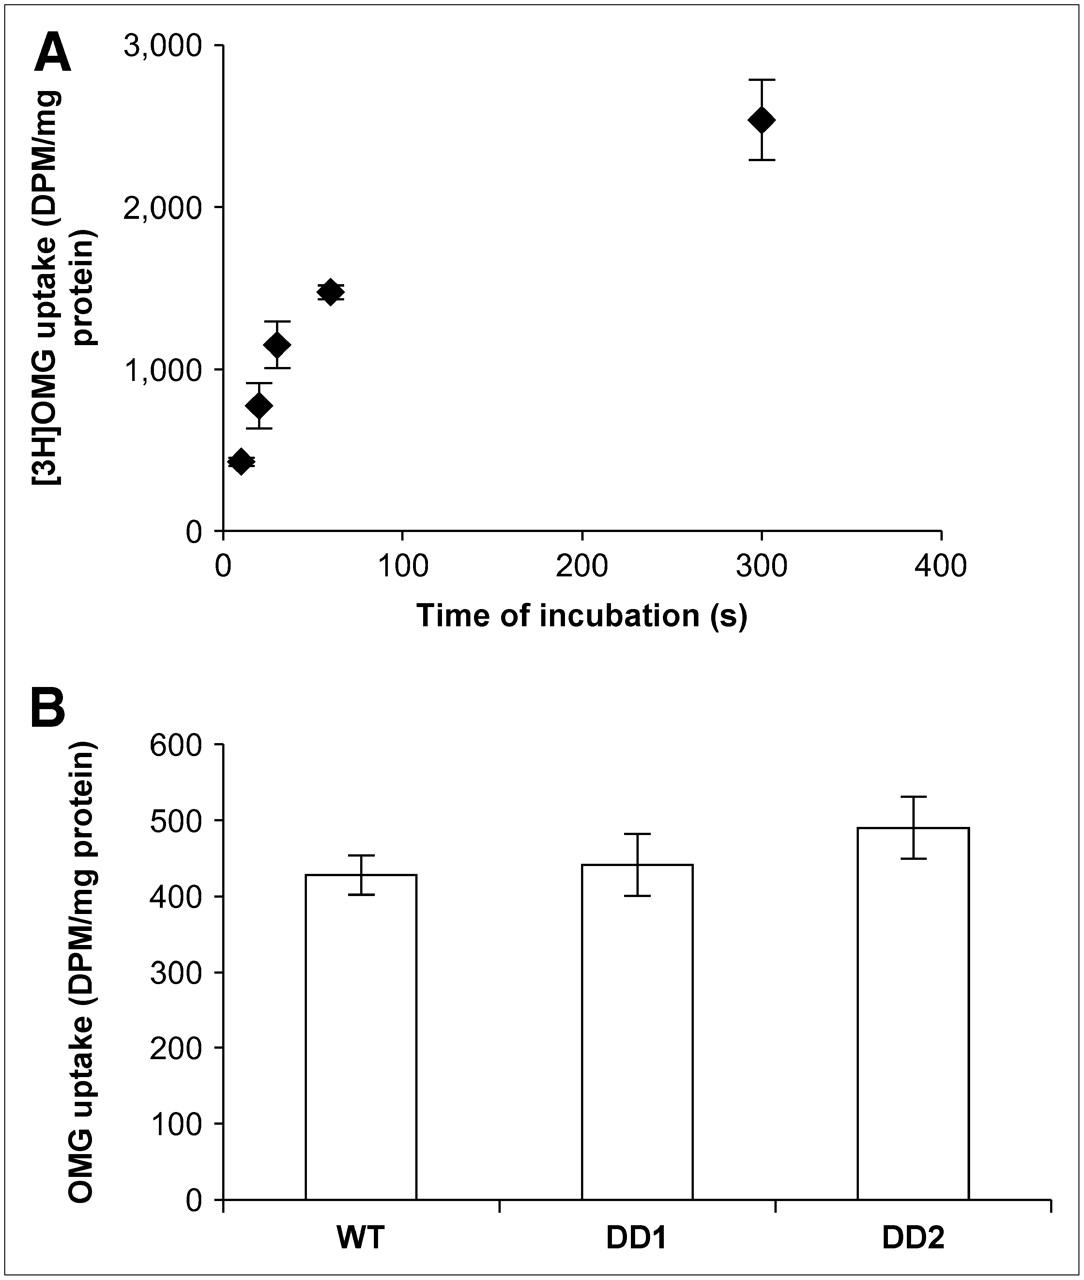
Glucose transport was measured by incubating cells with 3H-OMG and measuring 3H-OMG after 10 s (Fig. 4A shows that the uptake was linear for 30 s). The results are shown in Figure 4B for each subline. Glucose transport did not significantly differ between WT and DD1 cells (t = 0.58, P > 0.1), but a significant increase of 14% in transport by DD2 cells, compared with WT cells (t = 2.59, P < 0.05), was found.

(A) Uptake of 3H-OMG by MCF-7 cells. Cells were incubated with 3H-OMG for 10, 20, 30, 60, and 300 s and then washed rapidly with ice-cold PBS containing 100 μmol of phloretin per liter (n = 3 or more per time point). (B) Uptake of 3H-OMG by WT MCF-7 cells and MCF-7 cells containing dominant negative p53 constructs (DD1 and DD2) incubated with 3H-OMG for 10 s (n = 4 replicates). DPM = disintegrations per minute.
HK activity, shown in Figure 5, was significantly higher in DD1 and DD2 than in WT cells—by 33% (t = 2.37, P < 0.05) and 53% (t = 2.81, P < 0.01), respectively. Not all the 18F activity in the cell was necessarily phosphorylated; some was still 18F-FDG, depending on the rapidity of phosphorylation. Consistent with the higher level of HK activity in the 2 clones, the amount of nonphosphorylated 18F-FDG was significantly lower in DD1 (5.2 ± 0.55, P < 0.05) and DD2 (6.7 ± 0.87, P < 0.05) than in WT (10.9 ± 1.56) MCF-7 cells. The remaining 18F-FDG in the cell was in the phosphorylated form.
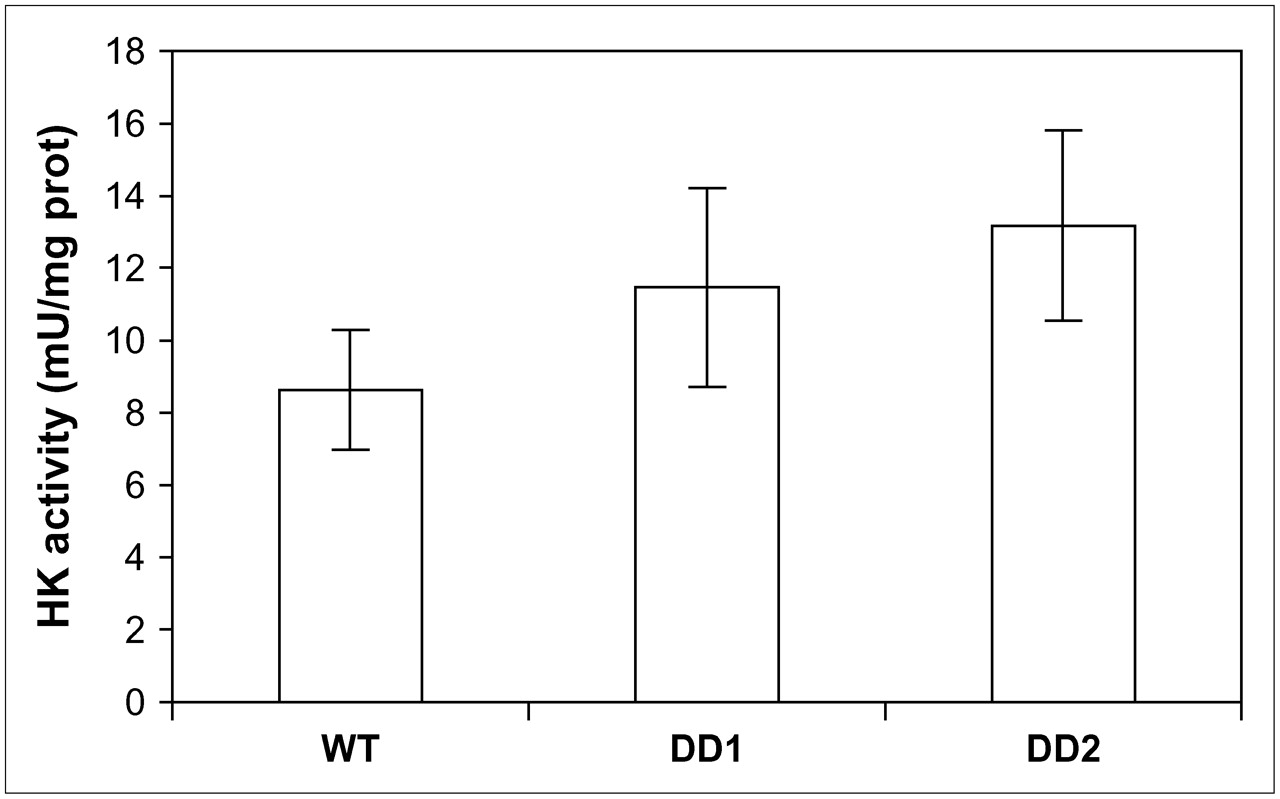
HK activity in homogenates of WT MCF-7 cells and MCF-7 cells containing dominant negative p53 constructs (DD1 and DD2). Units are per milligram of protein (n = 8 or more replicates). DPM = disintegrations per minute.
DISCUSSION
18F-FDG uptake was higher in 2 MCF-7 clones containing a dominant negative p53 construct than in WT MCF-7 cells, and HK activity was significantly higher in both cell lines than in WT cells. Glucose transport was slightly increased in DD2 but not in DD1, compared with the WT cell line. We also observed increased 18F-FDG incorporation in SKNSH neuroblastoma cells transfected with a dominant negative p53 construct, compared with sham transfected cells, suggesting that 18F-FDG incorporation is associated with p53 function.
There are now known to be 14 facilitative GLUTs (GLUT-1 to -14) (21). Using microarray technology, we found that MCF-7 cells expressed GLUT-1, -8, -10, and -11 genes. All other GLUTs were absent. A previous study (22) showed that the insulin-sensitive transporter GLUT-12 was expressed by MCF-7 cells. However, in contrast to the present study, Rogers et al. (22) added insulin to their MCF-7 cultures, and the insulin may have induced expression of the GLUT-12.
Schwartzenberg-Bar-Yoseph et al. (14) showed that WT p53 represses GLUT-1 and GLUT-4 gene expression in human osteosarcoma cells. In contrast, we found that the expression of GLUT-1 in DD1 and DD2 did not differ significantly from that in WT MCF-7 cells, whereas GLUT-4 was not detectable in these cells. We did observe a small, though significant, increase in glucose transport in DD2, compared with WT MCF-7 cells, possibly reflecting small differentials in expression of other GLUTs and in glucose-metabolizing enzymes between the 2 clones. Alternatively, the differences may be due to the fact that p53 expression is suppressed but not diminished below a threshold for GLUT downregulation and that alternative mechanisms for regulating GLUT expression exist in these breast cancer cell lines. These alternatives may include changes in the intracellular location of GLUT protein (23). Because the change in glucose transport between the WT and DD2 cells was only small, and because no change was observed in the DD1 cells, we did not pursue this possibility further.
The rate-limiting step for 18F-FDG incorporation into tumor cells is dependent on cell type (24). The significantly higher HK activity in the 2 clones, compared with the WT cells, consistent with higher 18F-FDG uptake, would suggest that HK activity is rate limiting for 18F-FDG incorporation into MCF-7 cells. HK activity has previously been shown to be the rate-limiting step for 18F-FDG incorporation into breast tumors in a clinical PET study. Thus, Torizuka et al. (25) showed that in untreated primary breast carcinomas, but not lung tumors, k3, the kinetic rate constant for 18F-FDG phosphorylation, correlated strongly with tumor standardized uptake value.
The promoter region of HK II has been shown to possess elements functionally responsive to several forms of mutant P53 (15). However, no studies have indicated responsive elements on HK genes to normal p53. Further, the results of this study indicated that decreased p53 levels do not influence the expression of HK genes, suggesting that the higher activity of HK in DD1 and DD2 is due to posttranscriptional processes such as mitochondrial binding (19).
Although the S-phase fraction was higher in the cells containing the dominant negative p53 construct than in the WT cells, this difference is unlikely to account for their higher uptake of 18F-FDG because the differences in cell cycle distribution between the 3 cell types were small and colchicine did not affect uptake of 18F-FDG by these cells despite altering the cell cycle distribution. Further, a study (26) that examined 18F-FDG incorporation into 3 tumor cell lines found that 18F-FDG uptake did not correlate with proliferative fraction.
Several studies have shown that a high standardized uptake value for 18F-FDG before treatment is associated with a poor prognosis (7–11). Two studies—of 162 (8) and 51 (7) patients with non–small cell lung carcinoma—found that the standardized uptake value and maximum standardized uptake value, respectively, were independent predictors of overall survival and treatment response. Similar findings have been observed in studies of 18F-FDG uptake by breast (9), gastrointestinal (10), and cervical tumors (11). A number of clinical studies have reported that 18F-FDG uptake correlates with p53 expression. Thus, 18F-FDG uptake has been shown to be higher in sarcomas (12) and breast carcinomas (13) exhibiting abnormal expression of p53 than in tumors expressing normal p53 levels. However, a more recent PET study (27) of prognostic indicators in breast cancer found that p53 status was not associated with 18F-FDG uptake in the patient group. Breast tumors are a highly heterogeneous tumor group (28), and trends between 18F-FDG uptake and biologic parameters may in some cases be obscured by intratumoral heterogeneity and so may not be apparent in all studies.
The findings of the present study showed that decreased expression of WT p53 resulted in increased 18F-FDG uptake by tumor cells, suggesting that the high levels of 18F-FDG uptake on pretreatment 18F-FDG PET scans of patients with a poor prognosis may be due to tumor expression of mutant p53 and consequent loss of WT p53 expression.
CONCLUSION
We have shown that transfection of MCF-7 cells with a dominant negative p53 gene construct that reduces the expression of p53 protein is associated with increased HK activity and enhanced 18F-FDG uptake.
Acknowledgments
This work was funded by grant 04-300 from the Association of International Cancer Research.
Footnotes
-
COPYRIGHT © 2006 by the Society of Nuclear Medicine, Inc.
References
- Received for publication February 3, 2006.
- Accepted for publication June 12, 2006.


Jump to section
Related Articles
Cited By...
- Inhibition of Glycolytic Enzymes Mediated by Pharmacologically Activated p53: TARGETING WARBURG EFFECT TO FIGHT CANCER
- 18F-FDG Uptake in Lung, Breast, and Colon Cancers: Molecular Biology Correlates and Disease Characterization
- Colorectal Tumor Cells Treated with 5-FU, Oxaliplatin, Irinotecan, and Cetuximab Exhibit Changes in 18F-FDG Incorporation Corresponding to Hexokinase Activity and Glucose Transport
- Tumor Cell Metabolism Imaging
- Treatment of Breast Tumor Cells In Vitro with the Mitochondrial Membrane Potential Dissipater Valinomycin Increases 18F-FDG Incorporation