


Abstract
The aim of the study was to provide dosimetric data on intrahepatic 111In-diethylenetriaminepentaacetic acid (DTPA)-d-Phe1-octreotide therapy for neuroendocrine tumors with overexpression of somatostatin receptors. Methods: A dosimetric protocol was designed to estimate the absorbed dose to the tumor and healthy tissue in a course of 48 treatments for 12 patients, who received a mean activity of 5.4 ± 1.7 GBq per session. The patient-specific dosimetry calculations, based on quantitative biplanar whole-body scintigrams, were performed using a Monte Carlo simulation program for 3 male and 3 female mathematic models of different anatomic sizes. Thirty minutes and 2, 6, 24, and 48 h after the radionuclide infusion, blood-sample data were collected for estimation of the red marrow radiation burden. Results: The mean absorbed doses per administered activity (mGy/MBq) by the critical organs liver, spleen, kidneys, bladder wall, and bone marrow were 0.14 ± 0.04, 1.4 ± 0.6, 0.41 ± 0.08, 0.094 ± 0.013, and (3.5 ± 0.8) × 10−3, respectively; the tumor absorbed dose ranged from 2.2 to 19.6 mGy/MBq, strongly depending on the lesion size and tissue type. Conclusion: The results of the present study quantitatively confirm the therapeutic efficacy of transhepatic administration; the tumor–to–healthy-tissue uptake ratio was enhanced, compared with the results after antecubital infusions. Planning of treatment was also optimized by use of the patient-specific dosimetric protocol.
- neuroendocrine tumors
- dosimetry
- 111In-DTPA-d-Phe1-octreotide
- peptide therapy
- hepatic artery catheterization
The radiopharmaceutical 111In-diethylenetriaminepentaacetic acid (DTPA)-d-Phe1-octreotide (OctreoScan; Mallinckrodt Medical BV) is a somatostatin analog that binds mainly to somatostatin receptors (subtypes 2 and 5) with high affinity. Somatostatin receptor imaging is considered an important technique for the localization and staging of neuroendocrine tumors (1). The use of 111In-DTPA-d-Phe1-octreotide for therapeutic purposes is also well established (2–4), because of the radioligand cellular internalization and the short tissue penetration of the emitted Auger and internal conversion electrons (0.02–10 μm and 200–550 μm, respectively), allowing a direct DNA catastrophe. In our institution, radionuclide infusions are performed by a nuclear physician via an angiographic catheter (5) that has been inserted in the hepatic artery by a radiologist. By this application method, uptake of radiopharmaceutical by the tumor is enhanced, compared with uptake after antecubital administration, because of the high concentration of activity that reaches the target tissue. The aim of this study was to estimate the absorbed dose to the tumor and to healthy tissues after this infusion technique and to compare the data with corresponding existing data on antecubital administration. For this purpose, a dosimetric protocol that included the following steps was designed and implemented: patient-specific S-value calculation, quantitative scintigraphic imaging, dead-time correction, residence time calculation, and absorbed dose estimation.
MATERIALS AND METHODS
Patients
The study comprised 48 111In-DTPA-d-Phe1-octreotide transhepatic infusions performed on 12 adult patients (9 men and 3 women; age range, 28–77 y) after they gave informed consent. The patient characteristics are summarized in Table 1. To be included in the therapeutic cycle, the patient had to have a histologically confirmed exclusively neuroendocrine tumor, normal kidney function (serum creatinine ≤ 1.2 mg/dL), and somatostatin receptor overexpression of the tumor lesions, as scintigraphically assessed after antecubital application of 3.3 MBq of 111In-DTPA-d-Phe1-octreotide. After selective catheterization of the hepatic artery, the patients received a mean activity of 5.4 ± 1.7 GBq per infusion of 111In-DTPA-d-Phe1-octreotide, administered through an angiographic catheter (5). Afterward, the patients were obliged to remain in an isolated shielded room in the hospital for 48 h to protect others from radiation and, on the day of their release, received written instructions designed to constrain the radiation dose to the public and to the patient's family.
Patient Characteristics
In patient 5, 2 of 5 administrations were applied antecubitally and not after a transhepatic catheterization, for clinical purposes. Consequently, the dosimetry from the 2 different injection modes could be directly compared.
Radiopharmaceutical
Both constituents, DTPA-octreotide and 111In-InCl3 (DRN 4901, 370 MBq/mL in HCl, pH 1.5–1.9), were obtained from Mallinckrodt Medical BV. DTPA-d-Phe1-octreotide was radiolabeled with 111In as previously reported (2).
γ-Scintigraphy
Scintigraphy was performed at 30 min, 24 h, and 48 h after injection. Planar views were acquired using a large-field-of-view single-head camera (APEX SPX4; Elscint) equipped with a medium-energy all-purpose parallel-hole collimator. Scatter radiation was reduced using a 20% energy window centered on the 247-keV 111In photopeak, consequently reducing the count loss due to dead time.
Anterior and posterior scintigraphic images were obtained and digitally stored in a matrix of 256 × 256 pixels. The scintigraphic/dosimetric study, after the first infusion, was considered a treatment-guiding session for planning the number of infusions and the amount of administered activity.
Dead-Time Correction
The high dose rate from the patient's body (>0.1 mSv/h at 1 m) might cause a significant error in quantitative measurements because of the dead-time count loss (>10%) (6). The relationship between radioactivity concentration and recorded counting rate was studied using a series of 10-mL vials placed 0.5 m from the center of the collimator and filled with 111In-InCl3 activities ranging from 185 to 2,220 MBq. Because the presence of a scattering medium enhances dead time (6), a cubic tank (0.1 × 0.3 × 0.3 m) filled with 6.3 × 10⁻³ m3 of water was placed on the examination bed, simulating the patient's body. Data were acquired in a 256 × 256 matrix with a 20% energy window centered on 247 keV. The range of activities resulted in a total counting rate of 2–40 kilocounts per second (kcps). The activity in each vial was measured in a well-type scintillation counter (Curiementor 3, model 12001; PTW).
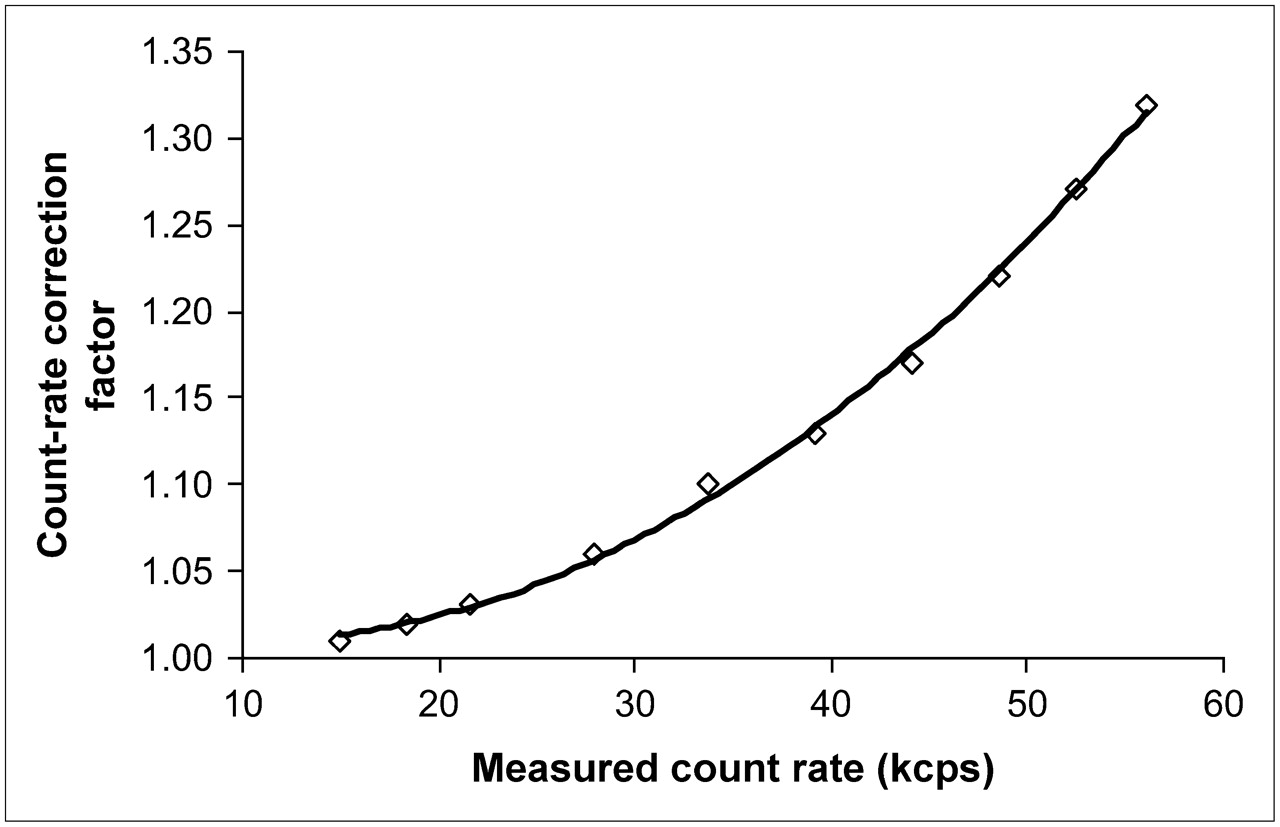
A linear fit function was applied to correlate the measured kcps with the corresponding vial activity, which ranged from 111 to 703 MBq. For these activities, the dead-time loss was found to be insignificant (<1%). A second-degree polynomial function was introduced in all the measurements. The true counting rate (TCR) and the measured counting rate (MCR) were calculated using the linear function and the polynomial function, respectively. The TCR/MCR ratio corresponds to the counting rate correction factor (CRCF). The CRCF and MCR were graphically presented, and the fitting process resulted in a second-degree polynomial.
Patient-Specific Dosimetry
Absorbed doses per cumulated activity (S values) were calculated using the Monte Carlo radiation transport code (version MCNP-4C; Los Alamos National Laboratory). Liver, spleen, kidneys, and bladder contents were considered target organs because they showed significant radiopharmaceutical uptake on the scintigrams. Three different Monte Carlo runs were performed for every target organ. In the first run, the primary photons were simulated on the basis of the 111In emission spectrum. In the second and the third runs, the Auger electrons and internal conversion electrons, respectively, were simulated, taking into account the source as the only target organ (self-dose distribution). The calculations were performed simulating 50 million and 1 million histories per photon and electron (Auger and internal conversion), respectively, emitted by 111In.
The Monte Carlo runs were performed on 3 male and 3 female mathematic phantoms of different heights (male heights: 160, 170, and 180 cm; female heights: 150, 160, and 170 cm). The mathematic phantoms were developed in our laboratory and designed according to the anthropometric data published by Clairand et al. (7). In that study, the organ masses (heart, kidneys, liver, lungs, pancreas, spleen, testes, and thyroid) were derived as a function of body height, using statistical analysis of anthropometric data gathered from 684 forensic autopsy cases (8). The mathematic formulas describing the Oak Ridge National Laboratory models (9) were applied for the description of all organs.
The mass and position of organs with no available height-specific mass data, as well as the skeletal components, were linearly adapted to fit the body size of each anthropomorphic model. For simplicity, the heart was represented as a sphere and the thyroid gland as 2 ellipsoids. The models contained media of 3 different densities: 1.04 g/cm3 for soft tissue, 0.296 g/cm3 for lung, and 1.4 g/cm3 for bone.
Tumor Dosimetry
Tumor S values were calculated using a Monte Carlo simulation. Tumors were represented as spheres of various masses composed of soft tissue (9) in which the distribution of radiopharmaceutical was assumed to be uniform. Three Monte Carlo runs were performed separately to simulate the primary photons, the Auger electrons, and the internal conversion electrons.
Measurement of Radioactivity in Blood and Urine
The radioactivity of the urine samples was measured using a well-type scintillation counter (Curiementor 3, model 12001), whereas the corresponding blood measurements were performed using scintigraphic imaging with a calibration source of known activity.
Blood samples were collected 30 min and 2, 6, 24, and 48 h after the radionuclide infusion. The blood residence time was calculated for the reference man taking into account the patient's body mass.
Urine samples were collected during the 48-h hospitalization of the patient. The radioactivity measurements of the urine samples were used to calculate the bladder-voiding interval and the biologic excretion half-time.
Biodistribution and Dosimetry
To evaluate biodistribution, we analyzed whole-body images according to the conjugated view method, described in MIRD Pamphlet No. 16 (10). Regions of interest were manually drawn over the tumors and over normal organs that showed significant radiopharmaceutical uptake (liver, spleen, and kidneys). Background regions of interest were placed close to the regions of interest by implementing the simple background subtraction method (10). Parts of organs showing tumor infiltration or organ superimposition were excluded from the evaluation of activity uptake. Activity as a function of time curves was drawn for each region of interest. The cumulative activity, in MBq·s, for every target organ was calculated by integrating the biexponential function that was introduced during the fitting process.
The organs with insignificant radiopharmaceutical uptake were considered as a single target organ and called remainder of the body. Radioactivity in the remainder of the body as a function of time was determined by subtracting the activity in the kidneys, spleen, and liver from the injected activity and by determining the effective half-life as calculated by exponential decay of the dose rate measured 1 m from the patient's body.
The absorbed dose to the bladder wall was estimated using the residence time for the bladder contents (τBLC), calculated by applying the dynamic urinary bladder model proposed by MIRD (11) based on the observed biologic half-life and the voiding interval.
Red Marrow Dosimetry
The residence time for red marrow (τRM) was found from the residence time for blood (τblood) under the assumption of a nonspecific uptake of radioligand in bone marrow (12). A uniform activity distribution and an equivalent clearance in red marrow and blood were assumed. Because of the small size of the radiolabel, the specific activity in bone marrow was considered to be 60% of the specific activity in blood (12), according to the following formula:
mRM and mblood express the red marrow mass and blood mass, respectively. The masses of the blood and marrow were assumed to be 5.2 kg and 1.5 kg, respectively (13). The absorbed dose per cumulative activity (S value) for the red marrow as target and source organ (SRM←RM) was taken to be 5.63 × 10⁻⁶ mGy/MBq·s from MIRD Pamphlet No. 11 (13).
For organ self-irradiation (source and target organ are the same), S factors are approximately inversely proportional to organ mass. Because most of the self-dose to any organ is contributed by nonpenetrating radiation that is completely absorbed locally, absorbed dose is inversely proportional to organ mass (14). Therefore, for a normal organ (an organ without tumor), S factors adjusted for the difference in mass between the patient organs and the reference man organs may be applied to specific patients for calculating the self-absorbed dose contribution:
Because changes in the marrow mass data with body height were not available, the following formula proposed by Marinelli et al. (15) was used in the present study to calculate the patient-specific S value:
RESULTS
Dead-Time Count Loss Correction
The relationship between the activity in each vial and the MCR is presented in Figure 1. For counting rates up to 20 kcps, the count loss due to dead time is negligible, so a linear function was used to correlate (r = 0.99) the activity to the counting rate (solid line in Fig. 1). As activity increases, the dead-time count losses diminish the counting efficiency of the γ-camera. This relationship is represented with a second-degree polynomial function (r = 0.99) (dashed line in Fig. 1). The derived equations were as follows: Eq. 1
Eq. 1 Eq. 2where
 and C is the activity, in MBq.

Counting rate with (true) and without (ideal) dead-time loss.
Using Equations 1 and 2, we calculated the CRCF. The values for TCR, MCR, derived CRCF, and percentage count loss are shown in Table 2. The interrelationship of the CRCF to the MCR is presented in Figure 2. A second-degree polynomial function (r = 0.99) was introduced in the above dataset, as follows: where
where

Second-degree polynomial fit to CRCF in relation to MCR.
TCR, MCR, CRCF, and Count Loss
Absorbed Dose per Cumulated Activity (S Values)
The Monte Carlo simulations produced S-value tables for every model height and for every source–target pair. The percentage variation of every S value with changes in the male model height (i.e., from 160 to 170 cm, from 170 to 180 cm, and from 160 to 180 cm), where the liver is the only source organ, is listed in supplemental Table 1 (supplemental data are available online only at http://jnm.snmjournals.org).
Biodistribution of 111In-DTPA-d-Phe1-Octreotide
The activity uptake by the critical organs and the tumor as a percentage of the administered activity with time is presented in Table 3. The residence time of every source organ was calculated for every patient and is shown in Table 4. The residence times of the liver of patient 3 and of the kidneys of patients 10 and 11 were excluded from the mean value calculation because of tumor infiltration. Because of organ–tumor superimposition, the tumor residence time of patients 6 and 10 could not be calculated either. Dosimetric data on the spleen of patient 10 were unavailable because the subject had undergone splenectomy.
Changes in Radioactivity with Time
Mean Residence Time After Transhepatic Infusion of 111In-DTPA-d-Phe1-Octreotide
Dosimetry Study
Data on the internal organs of the male and female anthropomorphic models are shown in supplemental Figures 1 and 2, respectively. The relationship between the total S value and the tumor radius (r) using linear regression was derived from the following function: where S is in mGy/MBq·s and r is in cm. The correlation coefficient (r = 0.997) indicates a strong correlation between the values of ln(S) and ln(r) (16). The tumor dose depends strongly on the size of the lesion and the tissue histotype as far as the corresponding residence time is concerned.
The mean residence time in the blood was tBlood = (0.70 ± 0.27) h. The application of the MIRD dynamic bladder model using a half-life of 6 h and a voiding interval of 4 h resulted in a bladder residence time of 0.982 h.
The mean dose (MD) per administered activity received by the target organs and the tumor for each patient was calculated using the S values derived by the Monte Carlo runs and the corresponding target-organ residence time. The results are shown in supplemental Table 2 for patients 1–6 and in supplemental Table 3 for patients 7–12. In Table 5 are classified the mean doses per administered activity, in mGy/MBq and rad/mCi, as well as the SD. In patient 5, 2 of 5 administrations were applied antecubitally. The derived dosimetry data were compared with those corresponding to the antecubital infusions and are shown in Table 6. The red marrow residence time was calculated to be τRM = (0.22 ± 0.04) h, resulting in an absorbed dose per unit administered activity of DRM←RM = (3.5 ± 0.8) μGy/MBq per administered activity.
Estimated Dose After Transhepatic Infusion of 111In-DTPA-d-Phe1-Octreotide
Dose and Tumor-to-Organ Absorbed Dose Ratio After Antecubital and Transhepatic Infusions
DISCUSSION
This study dealt with the design and application of a patient-specific dosimetric protocol in which the Monte Carlo method was used to estimate the radiation burden from 111In.
In contrast to diagnostic radiopharmaceuticals, therapeutic radiopharmaceuticals engender much smaller risk–benefit ratios and therefore markedly less tolerance for inaccuracies in dose estimations based on the reference man model of the MIRD schema. Because specific patients deviate from the biokinetic and anatomic averages, individualized dosimetry is required (14). The necessity of a patient-specific dosimetric protocol is outlined by the results shown in Table 4.
111In S values were calculated using mathematic anthropomorphic models of different heights. When the height of the model increases, the distance between the source and target organs increases and photon attenuation increases, leading to a decrease in the calculated S value. The decrease is less important for target organs near the source organs. The S-value variations we found (supplemental Table 1) agree with those published by Clairand et al. (7) for 131I, whose study considered stomach and urinary bladder as the source organs.
The SDs of S values were higher for tumors than for the liver, spleen, or kidneys—a fact that can be attributed to the differences in size and tumor histotype, significantly affecting uptake and residence time.
Quantitative image acquisition using a 20% window centered on the 247-keV photopeak alone constrains the count loss due to dead time. The CRCF equation enables the user to correct the MCR for the dead-time count loss using the recorded counting rate as the only input datum.
Application of the described patient-specific dosimetric protocol indicates that use of transhepatic administration had a 2-fold result: The radiopharmaceutical solution reaches the target tissue as a huge bolus, undergoing a first-pass extraction by the tumor before being diluted in the blood circulation, enhancing the ratio of tumor to normal-tissue uptake, and consequently optimally protecting the kidneys, which are the critical organs in peptide therapies (17). External-beam radiation therapy studies have shown a 5% risk of the development of renal failure within 5 y after uniform irradiation of two thirds of the kidneys with 27 Gy (18). Because the therapeutic cycle consists of a maximum of 12 infusions with a mean administered activity of 5,550 MBq, the dose constraint per infusion for the kidneys can be calculated as 27 Gy/(12 × 5,550 MBq) ≈ 0.405 mGy/MBq. The mean kidney dose (Table 5) is comparable to this value, reflecting the expected finding that in none of the 12 patients did radiotoxicity of any kind occur. The results in Table 6 underline the contribution of transhepatic administration to the decrease in dose to healthy tissue. Actually, the observed tumor-to-kidney dose ratios after antecubital and transhepatic administration—22.4 and 35.2, respectively—indicate that for the same administered activity, the tumor would absorb a radiation dose 1.57 times greater through transhepatic infusion than after antecubital administration.
Our result indicating that the organ receiving the highest dose after transhepatic radiopharmaceutical infusion is the spleen does not agree with other studies (19–22; Table 7). The reason is hemodynamic: The radiopharmaceutical reaches the spleen in high concentrations when infused but not when applied antecubitally. This reasoning is also supported by the results presented in Table 6, which shows mean doses calculated for the same patient implementing both methods of administration. However, the tumor-to-spleen ratio was higher in transhepatic than in antecubital administration.
Comparison of Studies: Dose After Antecubital and Transhepatic Infusions
The higher dose in the liver observed in our study, in comparison with other studies, can be explained by the presence of multiple lesions, which enhanced the residence time and uptake of the radiopharmaceutical. However, compensating for this factor was the higher tumor-to-liver ratio already mentioned.
The great differences in red marrow dose estimated herein are due to the applied dosimetric model and the different SRM←RM value used. The estimated dose received by the kidneys after intraarterial infusion in our study was lower than that after antecubital administration in other studies (19–22). The dose estimation reported by Fjälling et al. (21) was performed for only 1 patient after a single administration; thus, a comparison with those results lacks statistical significance.
CONCLUSION
The results of the present study quantitatively confirm the potent therapeutic efficacy of transhepatic administration. Indeed, it enhances uptake of radiopharmaceutical by tumor, consequently reducing the radiation burden to healthy organs. The patient-specific dosimetric protocol introduced here helps optimize the planning of transhepatically administered radioisotope therapy, which is in accordance with international basic safety standards (23).
Acknowledgments
The project was cofinanced within Operational Programme Education of the European Social Fund and through national resources (IRAKLEITOS program grant 70/3/7166).
Footnotes
-
COPYRIGHT © 2006 by the Society of Nuclear Medicine, Inc.
References
- Received for publication February 10, 2006.
- Accepted for publication June 8, 2006.


