


Abstract
Major depression (MD) is the most frequent psychiatric disorder with a predicted increase within the next decade. The understanding of the neurobiologic basis of its cause, antidepressive treatment effects, and identification of treatment outcome predictors is of crucial importance to warrant efficient medical care. The aim of our study was to investigate differences of regional cerebral blood flow (rCBF) in MD between responders and nonresponders in the beginning and differences during the course of treatment. Methods: 99mTc-Labeled d,l-hexamethylpropyleneamine oxime brain scans under resting conditions were performed on 65 patients with MD. All patients were treated with citalopram as an antidepressive monotherapy. SPECT scans were performed 2 times, at the beginning (t1) and after 4 wk of medication (t2). Voxel-by-voxel analyses were performed using SPM. Unpaired t test, paired t test, and multigroup analysis were used on a significance threshold of P < 0.005 (uncorrected) to identify significant differences in rCBF between responders and nonresponders at t1, within both groups over time of treatment (t2–t1), as well as a group × time interactions. Results: Thirty-five patients responded after 4 wk of treatment. Distinct differences between responders and nonresponders were found at the beginning of treatment and also relating to changes in rCBF during treatment. Responders showed a higher posterior cingulate activity at t1. Furthermore, an opposite direction of rCBF changes during treatment could be observed in this area. Conclusion: The differences in rCBF in responders and nonresponders in the posterior cingulate at t1 and the opposite directed changes in rCBF in both groups during treatment in this region suggest that the posterior cingulate function plays a key role in the pathophysiology of depression and may have a predictive value for antidepressive treatment outcome.
The posterior cingulate function plays a key role in the pathophysiology of depression and may have a predictive value for antidepressive treatment outcome. Depression is the most frequent psychiatric disorder in modern society. According to calculations performed by the World Health Organization, a clear-cut increase in the relative importance of major depression (MD) on global burden of disease is predicted (1). The understanding of the neurobiologic basis of its cause, pathophysiologic mechanisms, antidepressive treatment effects, and identification of treatment outcome predictors is of crucial importance to warrant efficient medical care. Over the last 2 decades neuroimaging has contributed to the understanding of neurobiology of MD.
Key foci of neuroimaging studies in major depression disorders (MDD) have been on baseline differences of regional cerebral blood flow (rCBF) or metabolism compared with healthy controls (2,3) and antidepressant treatment effects (4–7).
A large body of neuroimaging studies in MDD has consistently demonstrated brain dysfunctions in cortical an subcortical regions. One of the most consistent findings in neuroimaging studies is the reduced activity in the prefrontal cortex (PFC), especially in the dorsolateral and medial frontal cortex in comparison with healthy controls (4,8–11). Other prefrontal regions, such as the ventrolateral and orbitofrontal cortex, are reported to show an elevated activity (2,7,12,13). Several studies demonstrated the resolution of abnormalities in the PFC after successful treatment (4,6) but not all investigators have found a “normalization” of brain activity in these regions (14,15).
Similar findings have been reported relating to the anterior cingulate cortex (ACC), where a reduced activity was found in depressed patients (8,10,11,16–18), which increased after remission (6,19). The ACC activity has also been reported to have a predictive value for treatment response. Some studies showed an increased activity before treatment in responders compared with nonresponders and healthy controls in the ACC (20,21) and a decrease after successful treatment (14,20,21). However, controversial findings have shown that a pretreatment lower metabolism in the left ventral anterior cingulate gyrus was associated with better treatment response (22) or that treatment responders showed an increase of activity in the ACC (7). Besides the ACC, the posterior cingulate gyrus has also been reported to show response-dependent changes in MDD. Some studies found a decrease of activity after successful treatment (6,13).
rCBF or metabolic abnormalities in other regions, such as the amygdala, hippocampus, or basal ganglia, have been less consistently reported. Findings of imaging data thus far are very heterogeneous with regard to localization and polarity. However, the findings implicate a dysfunctional interconnection of neural circuits involving these regions, which are hypothesized to play a role in the pathogenesis of depressive symptoms. The variation in localization and polarity of observed changes in regional brain activity during antidepressant treatment might be a result of different imaging modalities, study designs, patient populations, and differences in antidepressant medication.
On the basis of inconsistent findings of previous studies, we used 99mTc-labeled d,l-hexamethylpropyleneamine oxime (99mTc-HMPAO, Ceretec; Amersham Healthcare) SPECT to investigate rCBF patterns in patients with MD, responding or not responding to a 4-wk monotherapy with citalopram.
MATERIALS AND METHODS
Patients
Currently depressed adult subjects (age, >18 y) who met the criteria of the Diagnostic and Statistical Manual of Mental Disorders (DSM-IV) for a major depressive episode consecutively admitted to the Department of Psychiatry and Psychotherapy, University of Bonn, between 2001 and 2004 were included in our study after complete description of the study protocol and having given written informed consent. Patients underwent a thorough medical and psychiatric examination to record comorbidity, physical disorders, and general medical conditions. Patients with axis-I comorbidity according to DSM-IV other than anxiety and somatoform disorders, as well as patients with severe medical conditions, neurodegenerative disorders, known cerebral lesions, head trauma with loss of consciousness, or a previous stroke, were excluded.
All patients received a standardized antidepressant pharmacologic treatment as administered within an internal quality assurance program according to clinical guidelines:
(a) citalopram (precondition: no severe agitation);
(b) fixed dosage after day 4 up to day 36;
(c) stepwise increase of dosage to 20, 30, or 40 mg citalopram from day 1 to day 4 (dosage by clinical decision);
(d) as adjunct psychotropic treatment only, lorazepam up to 3 mg with fixed dose from day 4 to day 36 (other psychotropic medication was not allowed).
Patients dropped out of the study protocol if a change of medication was required after the initiation of citalopram treatment because of side effects or worsening of psychopathology or withdrawal of consent. From the initially included 87 patients, 65 patients completed the whole study protocol and were included in the final analysis.
Severity of depressive symptoms and clinical improvement were assessed using the 17-item Hamilton Rating Scale for Depression (HRSD) (23) after initiation of citalopram treatment (t1) and 4 wk after t1 (t2). The 4-wk treatment interval was chosen in accordance with the standardized antidepressant pharmacologic treatment program, which is used at the Department of Psychiatry, University of Bonn, following clinical guidelines of the German Association of Psychiatrists, which recommend a 4- to 6-wk treatment before evaluation of response. In the case of nonresponse after 4 wk of consequent treatment with an adequate dose, a switch of medication becomes necessary in most cases for reasons such as patient's requirements and cost-effectiveness. The criterion for response was at least a 50% reduction of psychopathologic symptoms measured by HRSD or a HRSD ≤ 8 points at t2.
For the demographic and clinical characterization of both groups we also recorded age, sex, age at onset of major depressive disorder, lifetime number of previous major depressive episodes (MDE), and comedication of lorazepam.
This study was part of a larger study protocol, which was approved by a medical internal review board. All patients gave written informed consent after description of the study. The associated imaging and the analyses comply with accepted medical research standards.
Radiopharmaceutical and SPECT
The following SPECT procedure was performed twice on each patient: the first scan was obtained 5−7 d after initiation of citalopram treatment when a steady state of medication was achieved (t1). The second scan was performed 28 ± 2 d after the first scan (t2) to avoid effects of the proceeding medication or swapping of medication.
After 20 min of standardized resting conditions according to procedure guidelines of the European Association of Nuclear Medicine (24), 550−600 MBq of stabilized 99mTc-HMPAO were injected intravenously and scans were obtained 20−30 min after injection. For SPECT acquisition we used an annular brain-dedicated SPECT system (CERASPECT; Digital Scintigraphic Inc.) with an axial field of view of 10.7 cm and a transaxial resolution of ∼7- to 8-mm full width at half maximum. The system works with 3 collimators rotating within a single crystal system iodide ring detector and acquires 3 views from 3 angles simultaneously. Studies were acquired for 30 min in step-and-shoot mode (120 steps, 3° steps, 15 s per step) using a symmetric window of 20% centered around 140 keV and a 128 × 128 matrix. Images were reconstructed using a bidimensional Butterworth filter (cutoff = 1.0 cm−1; order = 10) and were corrected for attenuation, assuming uniform attenuation within the skull, applying a zero-order attenuation factor (0.120 cm−1) and Chang's algorithm. Sixty-four transaxial slices of 1.67 × 1.67 × 1.67 mm were obtained.
Image Analysis
Voxel-by-voxel analyses were performed using the 1999 version of SPM (SPM 99; Welcome Department of Cognitive Neurology, London, U.K.) implemented in Matlab 6.0 (The MathWorks) on a personal computer workstation (25). Images of relative tracer distribution were spatially normalized in the stereotactic Montreal Neurological Institute (MNI) space to a predefined SPECT template available in SPM99 (voxel size, 2 × 2 × 2 mm), using a 12-parameter linear affine transformation, and smoothed with a gaussian filter of 12 mm to account for individual gyral differences and brain anatomy. Images were globally normalized using proportional scaling to 50 mL/min per 100 g (26) to remove confounding effects due to global CBF changes, with a threshold masking of 80% of maximum intensity. In quantitative studies, proportional scaling allows adjustment of the data by scaling each scan to have the same global CBF (27). If qualitative “counts” measurements of relative activity are used as an indicator of rCBF, as in the present study, then changes in the global activity reflect changes in the administered dose and head fraction as well as changes in global CBF. In these cases, proportional scaling also allows stabilization of the variance in the regional activity (27).
Statistical Analysis
We performed 4 voxel-by-voxel analyses. A 2-sample t test was used to investigate differences of rCBF between responders and nonresponders in the beginning of treatment (t1). Changes in rCBF over time in both groups were tested by paired t test in each group (t2−t1), and a group-by-time interaction analysis was performed to reveal opposite directed courses of rCBF changes between both groups.
For all analyses the significance threshold was set at P < 0.005 uncorrected for multiple comparison, and k > 100 voxels for cluster extent. The MNI coordinates were transformed to Talairach coordinates using Matthew Brett's set of linear transformation (www.mrccbu.cam.ac.uk/Imaging/mnispace.html).
Continuous variables for the demographic and clinical characterization of both groups were compared by the Student unpaired t test. Categoric variables were compared by the Pearson χ2 analysis. P < 0.05 was considered statistically significant. All P values were 2-tailed. All statistical analyses were performed using SPSS statistical package 10.0 (SPSS Corp.).
RESULTS
Sixty-five of the initially included 87 patients completed the whole study protocol and were included in the analyses. Thirty-five of these 65 patients met the response criterion of at least 50% reduction of psychopathologic symptoms measured by HRSD or an outcome score ≤ 8 points, whereas 30 patients were nonresponders to this criterion after 4 wk of citalopram treatment. Both groups did not differ significantly with regard to their clinical feature, including HRSD scores in the beginning of treatment (Table 1).
Demographic and Clinical Features of Sample
Differences Between Nonresponders and Responders at t1
The comparison of rCBF of 35 responders and 30 nonresponders at t1 by voxel-by-voxel analysis revealed a significantly higher perfusion in responders compared with nonresponders: left hemispheric in the superior frontal cortex (Brodmann area [BA] 10), the left insula region (BA 13/putamen), the left inferior frontal cortex (BA 47); right hemispheric in the posterior cingulate (BA 23/BA 30) and also inferior frontal cortex (BA 45) (Table 2; Fig. 1). No regions with lower cerebral perfusion compared with nonresponders were found.

Statistical parametric Z maps (height threshold, P < 0.005; voxel threshold, k > 100) show cluster of significant lower rCBF in responders compared with that of nonresponders in beginning of treatment (t1). See Table 2 for details of Talairach coordinates.
Differences in rCBF Between Responders and Nonresponders at t1
Changes in rCBF in Nonresponders and Responders over Time
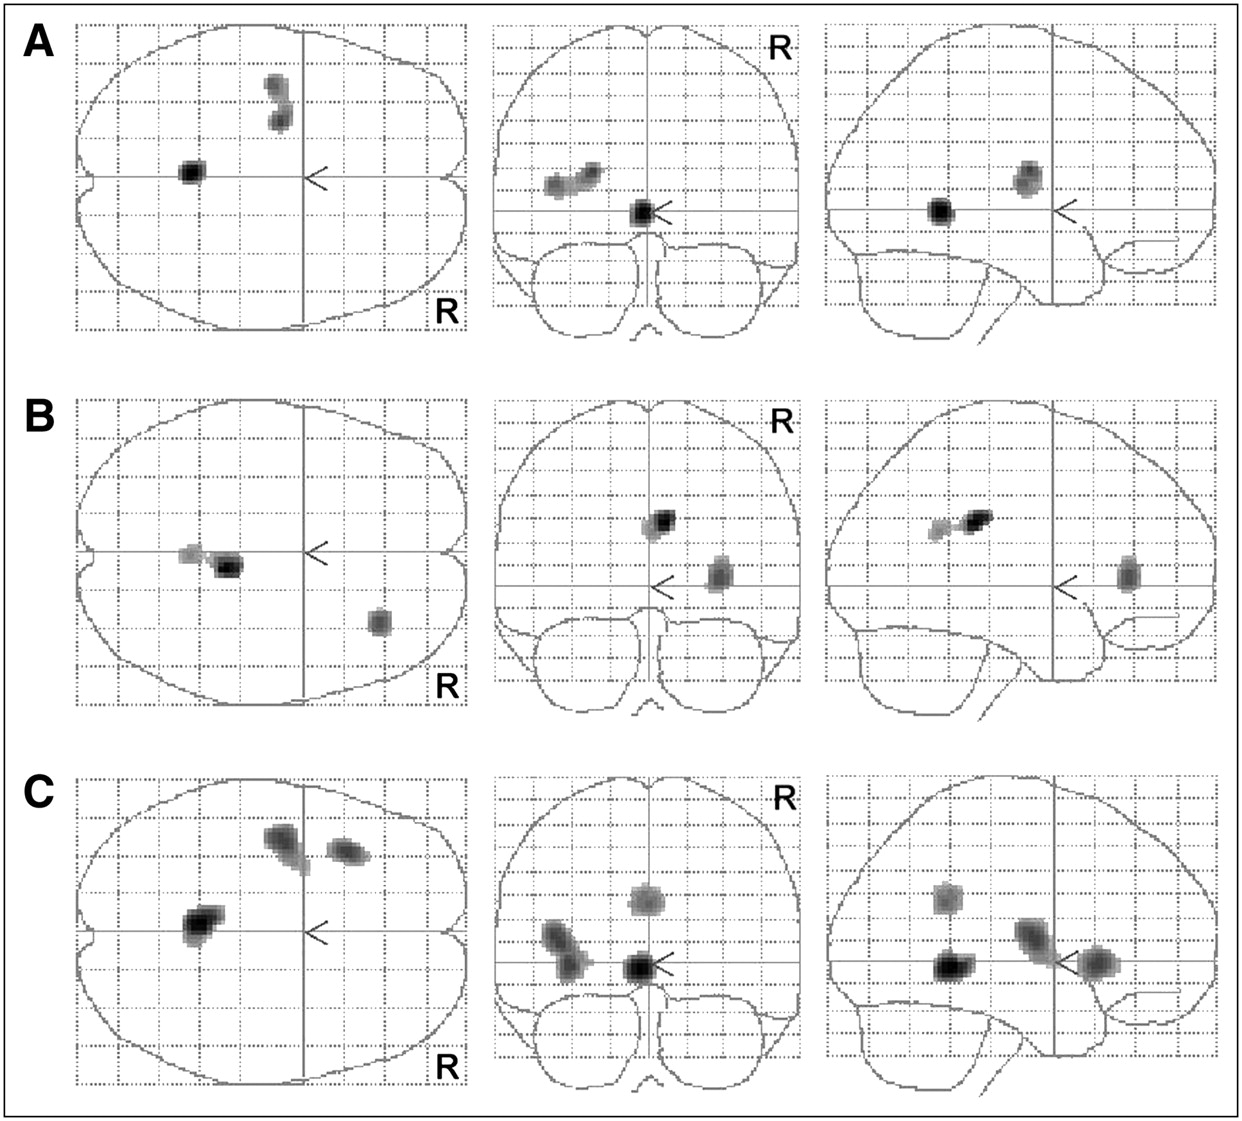
The paired t test comparing scans performed at t1 and t2 in the group of nonresponders found a significant increase in rCBF in the left posterior cingulate (BA 29) and the left putamen (nucleus lentiformis/BA 13) after 4 wk of treatment (Table 3; Fig. 2A). The opposite contrast testing for rCBF decreases over time found no areas on the same significance threshold level.

Changes in rCBF after 4 wk of treatment (t2) (height threshold, P < 0.005; voxel threshold, k > 100). (A) Cluster of significant increase in rCBF in nonresponders. (B) Clusters of significant decrease in rCBF in responders. (C) Cluster of significant opposite directed courses in rCBF in both groups. See Tables 3–5⇓ for details of Talairach coordinates.
Changes in rCBF in Nonresponders After 4 Weeks of Treatment
In contrast to the findings in the nonresponder group the paired t test found no areas of rCBF increase after 4 wk in the responder group. The voxel-by-voxel analysis found only regions with a rCBF decrease in the right hemisphere in the posterior cingulate (BA 23) and the inferior frontal cortex (BA 47) (Table 4; Fig. 2B).
Changes in rCBF in Responders After 4 Weeks of Treatment
Group-by-Time Analysis
The group-by-time analysis found significant opposite directed courses of rCBF changes with a decrease in the responder group and an increase in the nonresponder group in the posterior cingulate BA 29 and BA 31, the left inferior frontal gyrus (BA 47), and the left insula region (BA 13/putamen) (Table 5; Fig. 2C).
Multigroup Analysis of Course of rCBF Changes over Time
DISCUSSION
To the best of our knowledge, this is the largest study published so far investigating rCBF changes in depressed patients during constant antidepressive treatment conditions. By choosing a homogenous monotherapy with citalopram and setting the baseline (t1) at a time point where steady-state medication level was already reached, we tried to exclude the direct initial pharmacologic effect of antidepressant treatment to map mainly response-dependent differences in rCBF.
We found distinct significant differences between responder and nonresponder to this treatment at baseline and also significant differences between both groups during the course of treatment. In the beginning of treatment responders compared with nonresponders showed an increased rCBF in the posterior cingulate as well as in the prefrontal pronounced in the medial frontal cortex as well as in the ventrolateral prefrontal cortex.
After 4 wk of antidepressant monotherapy with citalopram, responders showed only decreases in rCBF in the posterior cingulate (BA 23) and the inferior frontal cortex (BA 47), whereas nonresponders showed only increases in rCBF in the left posterior cingulate (BA 29) and the left putamen (nucleus lentiformis/BA 13). Comparison of the course of change over time revealed significantly different changes in rCBF in the posterior cingulate BA 29 and BA 31, the left inferior frontal gyrus (BA 47), and the left insula region (BA 13/putamen), with a decrease in the responder group and an increase in the nonresponder group, respectively, in these regions.
The key findings of our data are the differences of posterior cingulate activity in responders and nonresponders at t1 and the significantly opposite directed course of both groups in the posterior cingulate. However, in the group of nonresponders we found an increase in a more rostral part of the posterior cingulate but close to the cluster in which both groups differed on the first scan.
The database thus far, on prediction of successful outcome and antidepressant treatment effects, is very heterogeneous with regard to localization and polarity of brain activity changes (3,5,22,28). Baseline differences between responders and nonresponders have been investigated previously in several studies to find potential predictors of treatment response. Mayberg et al. (20) reported in 1997 that responders had an increased regional cerebral glucose metabolism in the ACC (BA 24) compared with nonresponders and healthy controls. Despite the small sample size this might be the most influential study with regard to response prediction in depression. Pizzagalli et al. (21) was later (2001) able to replicate these findings with electroencephalograph source location. In contrast, Brody et al. (22), in 1999, found opposite directed results in treatment responders.
In our data we did not find any rCBF differences in the ACC between responders and nonresponders but we did find significant differences in the posterior cingulate. These significant differences suggest a predictive value for these regions for treatment response. Our findings of opposite directed courses of rCBF changes in the posterior cingulate emphasize the predictive value of this region and also suggest a crucial role of the posterior cingulate in the pathophysiology of the MDD.
Concordant with our findings, abnormally increased metabolism in the posterior cingulate in depressed patients has been reported by several groups (6,13,16) and Buchsbaum et al. (6), in 1997, also reported a decrease in this region after sertraline treatment. Bench et al. (16) also reported that the elevated activity in this region correlated positively with high loadings of anxiety. Increased activity in the posterior cingulate cortex before treatment was significantly correlated with a positive response to surgical (cingulotomy) or medical (fluvoxamine) treatment for obsessive–compulsive disorder (29) but a predictive value of the posterior cingulate activity in MDD has not been postulated yet. However, in contrast, recent studies also reported that increased activation in BA 23 and BA 31 were associated with remission after pharmacologic treatment (5,19) or interpersonal therapy (30).
The posterior cingulate cortex is suggested to play a crucial role in the modulation of memory. It is linked by reciprocal pathways to prefrontal and anterior cingulate cortices, and the anterior and lateral thalamic nuclei, and might serve to connect the dorsolateral prefrontal cortex with the hippocampal formation. These connections are consistent with lesion and imaging evidence that the posterior cingulate is involved in memory function (31,32). Several studies reported that memory function is enhanced for emotional stimuli or events arousing (33,34). Activation of the posterior cingulate by emotional stimuli may reflect an interaction between emotion and memory, such as the enhancement of memory for emotional information (35). The posterior cingulate also seems to be involved in perception of somatic discomfort and pain where increased activity was found after adverse stimulation (36).
Because of our partially converging findings with recent literature we performed an unpaired t test of all 17 HRSD items of the first symptom assessment in the beginning of therapy to find an explanation for the elevated rCBF in responders compared with nonresponders and the opposite directed courses of rCBF changes in both groups (significance level was set to P < 0.01 after α-adjustment for multiple testing). Interestingly, we found significant differences in only 1 item between both groups: Responders had a significantly higher load in somatic anxiety (item 11; P < 0.004). All other items showed no significant differences between both groups. Additionally, there was a trend in work and activity impairment (item 7; P < 0.03) with a higher load in the nonresponder group. Considering the functional anatomy of the posterior cingulate and its role in emotional processing and anxiety, we hypothesize that our findings could be the functional correlate of the higher load of somatic anxiety in the responder group.
In comparison with our findings of an increased activity in the left prefrontal cortex in responders compared with nonresponders at t1, in 2003 Saxena et al. (37) also reported similar findings in responders to treatment with paroxetine. We did not find any significant changes in the left PFC in either group. The discrepancy among prior reports and our results could be explained by different clusters of depressive symptom profiles and variation among differing patient groups depending on predominant symptom factors (16,38). In line with histopathologic findings of a reduction in density of glia cells in the PFC in subjects with major depressive disorders, which reflects aberrant neurodevelopment or cellular plasticity (39,40), our findings support the hypothesis that alterations of prefrontal activity might be more of a trait than a state marker for mood disorders.
The comparability of our findings might be limited because most recent neuroimaging studies in MDD have been performed by 18F-FDG PET, which has a better resolution. Taking the limited spatial resolution into consideration, to avoid type I errors, we chose a high voxel threshold of k > 100 voxels.
Also, the fact that all patients were not drug naive on the first scan and psychopathologic testing at t1 must be taken into consideration. As mentioned earlier, the setting of the baseline was chosen at a time point where the steady-state medication level was already reached, to investigate response-dependent differences in rCBF and not the initial pharmacologic effect of antidepressant treatment. It was possible to scan all patients within the first week of treatment when steady state of medication was achieved. HRSD scores could show that the load of depressive symptoms was high at this point.
The statistical analyses were performed using SPM99 on a significance threshold of P < 0.005 uncorrected for multiple testing, which makes the analyses susceptible for type I errors. The investigation was designed as an exploratory study for hypotheses generation. Having only 1 scan per condition limits the degrees of freedom in SPM analyses and correspondingly leads to a fairly conservative testing (26). Therefore, we did not correct for multiple testing to avoid type II errors.
CONCLUSION
The differences in rCBF in responders and nonresponders in the posterior cingulate in the beginning of treatment and the opposite directed course of rCBF in both groups over time in this region suggest that the posterior cingulate function plays a key role in the pathophysiology of depression and may have a predictive value for antidepressive treatment outcome.
Footnotes
-
COPYRIGHT © 2006 by the Society of Nuclear Medicine, Inc.
References
- Received for publication December 9, 2005.
- Accepted for publication April 21, 2006.


Jump to section
Related Articles
Cited By...
- Convergent functional effects of antidepressants in major depressive disorder: a neuroimaging meta-analysis
- "Less is more": a dose-response account of intranasal oxytocin pharmacodynamics in the human brain
- Effects of route of administration on oxytocin-induced changes in regional cerebral blood flow in humans
- Investigating resting brain perfusion abnormalities and target-engagement by intranasal oxytocin in women with bulimia nervosa and binge-eating disorder and healthy controls