


Article Figures & Data
Figures
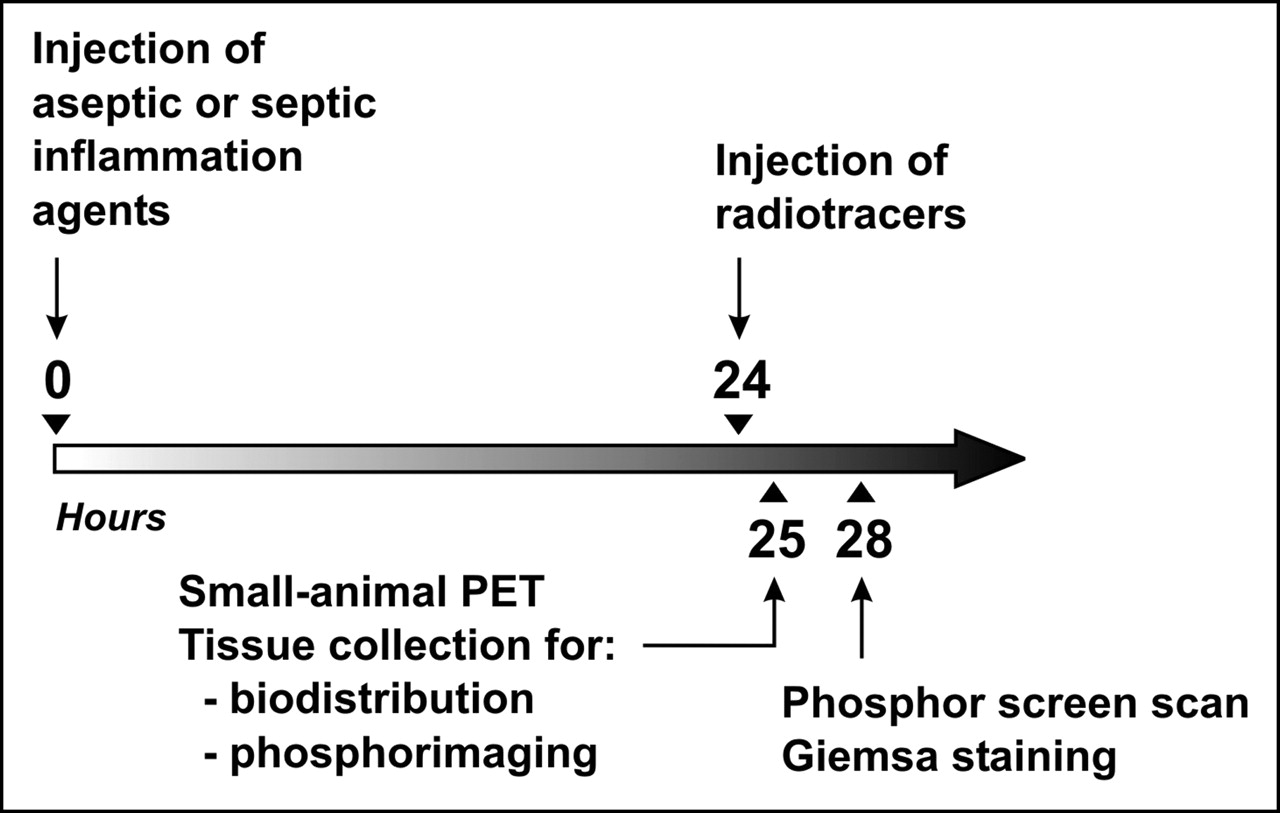
- FIGURE 1.
Outline of experimental design.
- FIGURE 2.
(A) Time course retention of 18F-FDG in WBCs incubated in 0.9% NaCl for extended periods at 37°C. Percentage cell-bound activity (labeling) is expressed as pellet activity/total activity ratio. (B) TLRC at 90 min after WBC labeling. Dotted lines indicate retention factor, Rf = 0 (left) and Rf = 1 (right). Center panel: 18F-FDG (Rf = 0.37) contains trace of 18F-fluoride not migrating with the mobile phase. Right panel: Lysed 18F-FDG–WBCs (similarly as 18F-fluoride, 18F-FDG-6P used as standard does not migrate with the mobile phase).
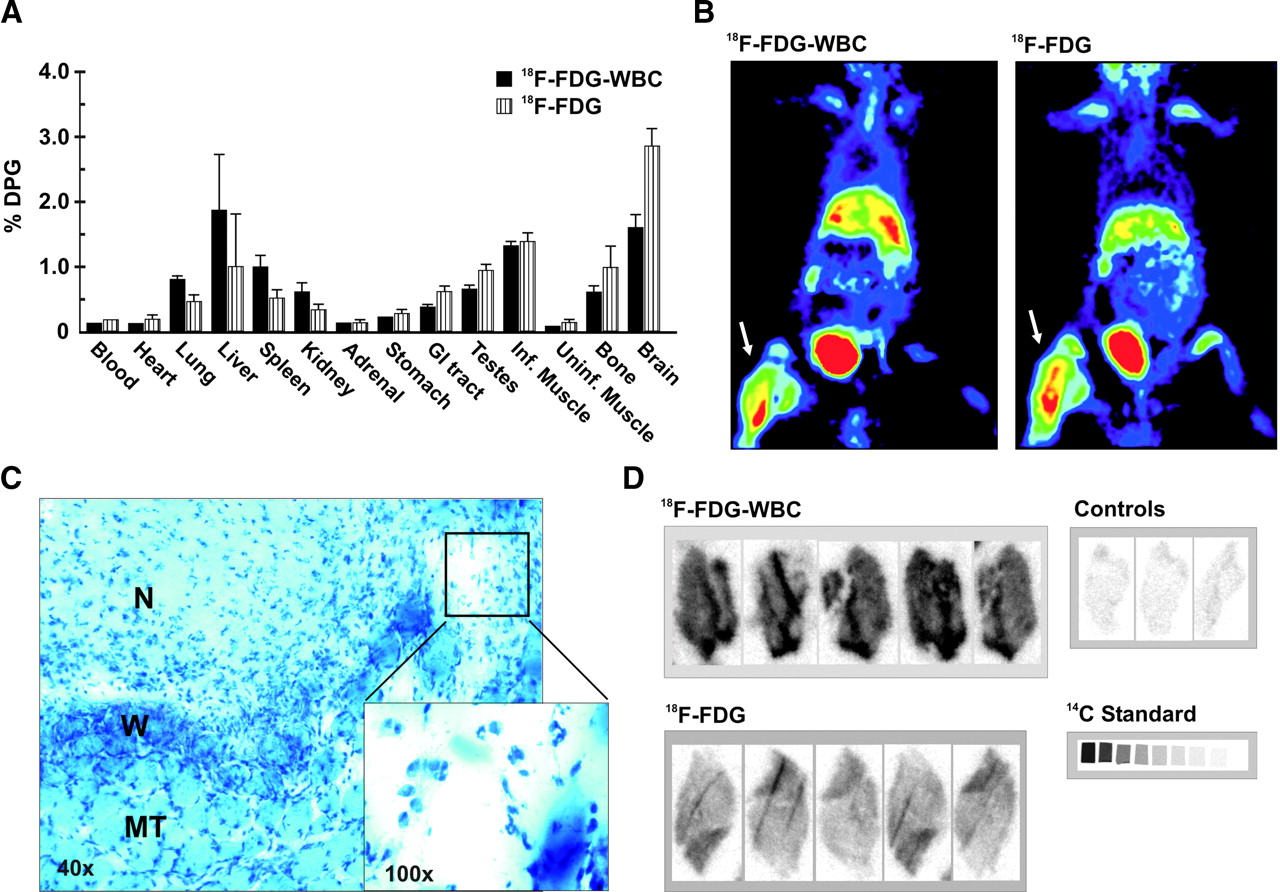
- FIGURE 3.
(A) Tissue biodistribution of 18F-FDG–WBCs and 18F-FDG in turpentine model 1 h after radiotracer injection. Values are expressed as % DPG (mean ± SE). (B) Coronal images of turpentine model obtained 1 h after radiotracer injection. Arrow indicates inflammation site (animals positioned prone on imaging table). (C) Microscopic images of Giemsa-stained sterile inflamed muscle sample, collected 1 h after radiotracer injection. Abscess is characterized by central necrosis (N) and a surrounding wall (W) mainly consisting of granulocytic cells and normal muscle tissue (MT). (D) Phosphorimaging of frozen section from turpentine-injected muscle (IM) and normal muscle (NM), collected 1 h after radiotracer injection. Standard: 14C standard activity values were converted to 18F activity in MBq/g by using a calibration curve. Control: NM 18F-FDG–WBC, tissue uptake = 0.22 kBq/g. 18F-FDG–WBC: IM 18F-FDG–WBC, tissue uptake = 8.14 kBq/g. 18F-FDG: IM 18F-FDG, tissue uptake = 3.07 kBq/g. DPG = (injected dose/gram of tissue) × 100; GI = gastrointestinal; Inf. = infected; Uninf. = uninfected.
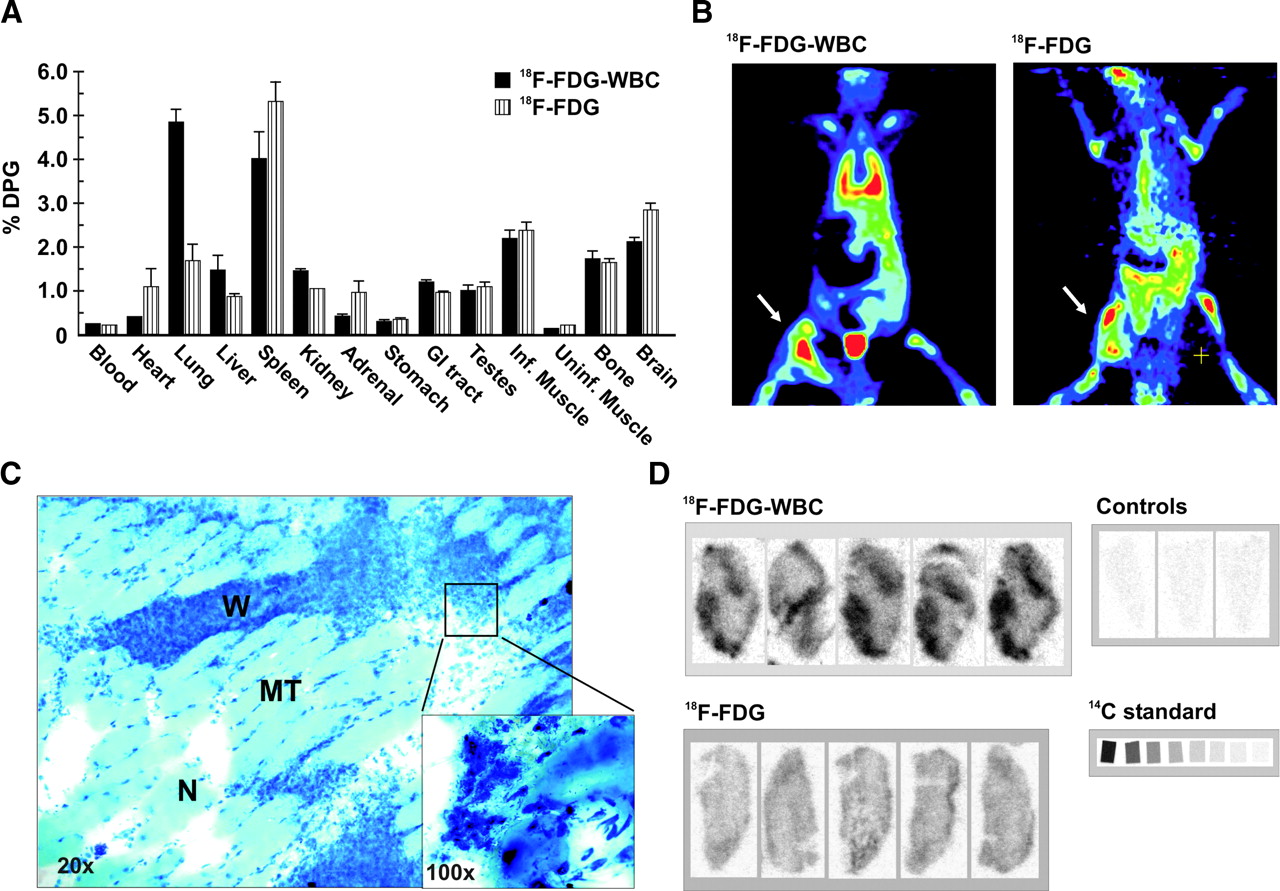
- FIGURE 4.
(A) Tissue biodistribution of 18F-FDG–WBCs and 18F-FDG in E. coli model 1 h after radiotracer injection. Values are expressed as % DPG (mean ± SE). (B) Coronal images of E. coli model obtained 1 h after radiotracer injection. Arrow indicates infection site (animals positioned prone on imaging table). (C) Microscopic images of Giemsa-stained E. coli-injected septic muscle sample, collected 1 h after radiotracer injection. Necrosis (N) and abscess architecture showed a different organization compared with the sterile model. Numerous inflammatory cells were present in surrounding wall (W) infiltrating muscle tissue (MT). E. coli can be seen in the higher magnification. (D) Phosphorimaging of frozen section from E. coli-infected muscle (IM) and normal muscle (NM), collected 1 h after radiotracer injection. Standard: 14C standard activity values were converted to 18F activity in MBq/g by using a calibration curve. Control: NM 18F-FDG–WBC, tissue uptake = 0.1 kBq/g. 18F-FDG–WBC: IM 18F-FDG–WBC, tissue uptake = 2.035 kBq/g. 18F-FDG: IM 18F-FDG, tissue uptake = 0.99 kBq/g. DPG = (injected dose/gram of tissue) × 100; GI = gastrointestinal; Inf. = infected; Uninf. = uninfected.
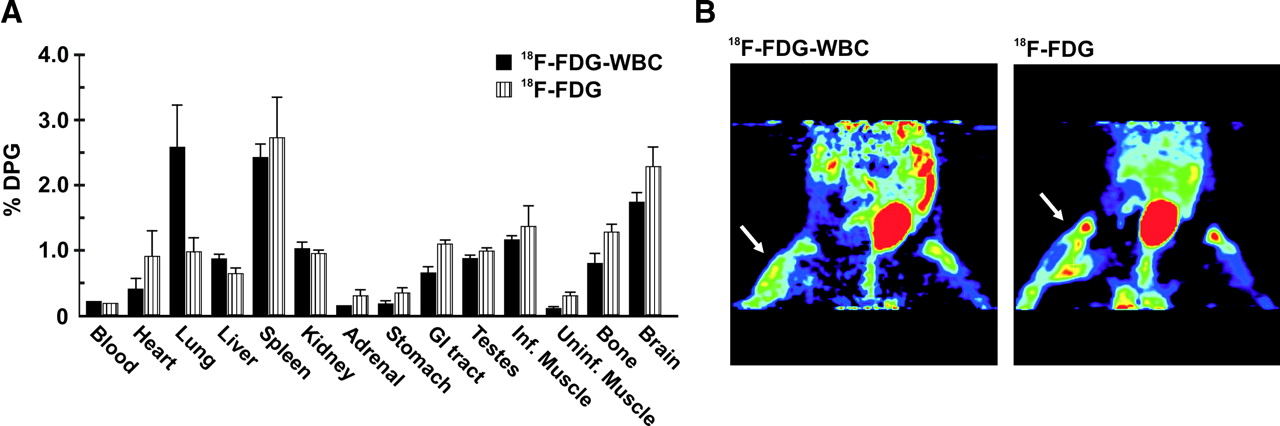
- FIGURE 5.
(A) Tissue biodistribution of 18F-FDG–WBCs and 18F-FDG in P. aeruginosa model 1 h after radiotracer injection. Values are expressed as % DPG (mean ± SE). (B) Coronal images of P. aeruginosa model obtained 1 h after radiotracer injection. Arrow indicates infection site (animals positioned prone on imaging table). DPG = (injected dose/gram of tissue) × 100; GI = gastrointestinal; Inf. = infected; Uninf. = uninfected.


Tables
- TABLE 1
Experimental Groups Undergoing 18F-FDG–WBC and 18F-FDG Biodistribution, microPET, and Phosphorimaging Study
Group No. of animals Biodistribution microPET Phosphorimaging 18F-FDG–WBC 18F-FDG 18F-FDG–WBC 18F-FDG 18F-FDG–WBC 18F-FDG 1 Control 15 4 5 3 3 — — 2 Sterile inflammation (turpentine) 26 6 6 3 3 4 4 3 Septic inflammation (E. coli) 29 6 6 3 3 6 5 4 Septic inflammation (P. aeruginosa) 25 6 6 3 3 4 3 Group Biodistribution* microPET† Phosphorimaging‡ 18F-FDG–WBC 18F-FDG 18F-FDG–WBC 18F-FDG 18F-FDG–WBC 18F-FDG 1 Sterile inflammation (turpentine) 24.24 ± 3.98 12.21 ± 3.68 19.71 ± 0.38 8.04 ± 0.59 21.81 ± 3.91 12.85 ± 1.11 P = 0.048 P < 0.001 NS 2 Septic inflammation (E. coli) 14.67 ± 1.85 10.04 ± 0.66 26.61 ± 0.04 12.35 ± 0.01 25.27 ± 3.97 20.70 ± 3.43 P = 0.040 P < 0.001 NS 3 Septic inflammation (P. aeruginosa) 15.62 ± 4.30 5.08 ± 0.93 10.89 ± 0.12 4.35 ± 0.09 10.11 ± 1.33 5.57 ± 0.43 P = 0.037 P < 0.001 P < 0.01
In this issue


Jump to section
Related Articles
Cited By...
- Assessment of Cardiac Sarcoidosis with PET/CT
- Spectrum of Restrictive and Infiltrative Cardiomyopathies: Part 2 of a 2-Part Series
- The Potential of Clinical Phenotyping of Heart Failure With Imaging Biomarkers for Guiding Therapies: A Focused Update
- Joint SNMMI-ASNC Expert Consensus Document on the Role of 18F-FDG PET/CT in Cardiac Sarcoid Detection and Therapy Monitoring
- Cardiac Sarcoidosis
- PET/CT with 18F-FDG-Labeled Autologous Leukocytes for the Diagnosis of Infected Fluid Collections in Acute Pancreatitis
- PET with 18F-FDG-Labeled T Lymphocytes for Diagnosis of Acute Rat Renal Allograft Rejection
- Translational 18F-FDG PET/CT Imaging to Monitor Lesion Activity in Intestinal Inflammation
- The Use of 18F-FDG PET in the Diagnosis of Cardiac Sarcoidosis: A Systematic Review and Metaanalysis Including the Ontario Experience
- Experiences with Citrate Rather Than Heparin as an Anticoagulant for 18F-FDG Labeling of Leukocytes
- Potential of Noninvasive Serial Assessment of Acute Renal Allograft Rejection by 18F-FDG PET to Monitor Treatment Efficiency
- Radionuclide Imaging of Infection: In Search of the Grail
- Imaging Infection with 18F-FDG-Labeled Leukocyte PET/CT: Initial Experience in 21 Patients