


Abstract
The aim of the present study was to determine the clinical feasibility of integration of stereotactic SPECT (sSPECT) with 201Tl in the stereotactic MRI (sMRI)-based planning of brain tumor biopsy. Furthermore, the predictive value of the integrated techniques was analyzed by comparison with the corresponding histologically determined metabolic activity. Methods: Ten patients underwent combined 201Tl SPECT- and MRI-guided stereotactic biopsy of intracranial lesions according to a previously described technique. An area of abnormal 201Tl uptake was used to guide the stereotactic biopsy trajectory. Several samples were taken along the trajectory above and beneath the target. An extensive histologic diagnosis (tumor grade, mitotic index [MI], and Ki67 index) and the 201Tl index were obtained for all samples and compared statistically. Results: Combined 201Tl sSPECT- and sMRI-guided biopsy could be performed on all patients. Ki67 index, MI, and tumor grade correlated significantly. The correlations between MI or Ki67 index and 201Tl index were not significant (0.18 and 0.09, respectively). A trend to significance existed between tumor grade and 201Tl index (R = 0.31; P = 0.06). Mean 201Tl index for grade III tumors (3.27 ± 1.89 [SD]) was significantly different from that for grade IV tumors (4.34 ± 1.29). The sample position on the trajectory correlated with the MI (R = 0.39; P = 0.01). In 4 of the 10 patients, a variation in tumor grade could be observed along the trajectory. In all patients, the highest proliferative activity was within 5–10 mm of the target. Conclusion: These results support the view that 201Tl SPECT may contribute to the successful management of brain tumor patients requiring stereotactic biopsy, without causing a significant increase in discomfort or morbidity. The development of similar techniques integrating sSPECT data in the planning of stereotactic biopsy should be considered by centers performing stereotactic surgery and having access to SPECT technology. In the long term, this technique could become a support for focused gene therapy and cell transfer.
Stereotactic biopsy of brain tumors now represents a well-established methodology for determining malignancy and is a basic requirement for treatment planning (1–3). Although the technique, which is based on CT and MRI, is anatomically accurate, pathologic examination of the stereotactic biopsy samples does not always yield the correct histologic grade and extension. The consequence can be an underestimation or an inaccurate diagnosis (4,5), especially in brain tumors such as gliomas that are histologically heterogeneous and highly vascularization dependent (6).
SPECT with 201Tl (potassium equivalent) and PET with 18F-FDG provide complementary metabolic information and are now commonly used in evaluation of brain tumors (7–9). Even though these functional images display poor anatomic definition, their integration into multimodality stereotactic planning (stereotactic acquisitions performed the same day) could improve the histopathologic reliability of stereotactic brain biopsies (5). Until now, physicians have relied principally on their spatial sense to mentally reorient and overlap these images with the anatomic data. This approach is inconsistent and highly subjective and can yield suboptimal results because it does not take full advantage of all the information available. Therefore, objective methods are needed to align and register images easily and precisely, helping physicians arrive at a better diagnosis and make better treatment decisions (10).
Neither PET nor SPECT has enough resolution to precisely define the surgical target and plan. Accordingly, to improve the diagnostic yield of stereotactic brain biopsy, we have developed a technique allowing routine integration of stereotactic SPECT (sSPECT) imaging in the stereotactic MRI (sMRI)-based surgery (11). We proposed to choose as a target inside the tumor the pixel presenting the highest metabolic activity on SPECT images. The objective of the present study was to evaluate the clinical feasibility of such a protocol and the predictive value of 201Tl sSPECT activity by comparison with the corresponding histologically determined metabolic activity. We report the results of a prospective consecutive series of 10 patients who underwent combined 201Tl SPECT- and MRI-guided stereotactic brain biopsies.
MATERIALS AND METHODS
Patient Population
Between December 2003 and October 2004, a consecutive series of 10 patients suspected (on the basis of clinical history, preoperative MRI or CT, and 201Tl SPECT) of having a brain glioma was included in this clinical study, which was approved by the Ethics Committee (reference number 02 07 01). The patients included 7 men and 3 women, ranging in age from 29 to 78 y (mean, 57.8 ± 16.1 [SD] y). All were previously untreated and gave written informed consent to undergo combined 201Tl SPECT- and MRI-guided stereotactic biopsy.
Hardware Configuration
Localization System.
The localization system was based on a widely and routinely used neurosurgical stereotactic system, the Leksell coordinate frame, model G (Elekta AB) (12,13), designed to block the position of the patient’s head. Two identical Leksell localizers, that is, the 5 N-shaped localization plates, were filled for sSPECT with a 201Tl solution (4.6 MBq) and for sMRI with a copper sulfate solution (0.002 mol/L). These fiducials generate reference marks on the images used to define the stereotactic coordinate system.
SPECT Acquisition.
sSPECT images were acquired on a triple-head, small-field (240 × 300 mm) Prism 3000XP γ-camera (Philips). A glass-fiber examination table and attached clamp were specifically designed by the Research Unit of our Neurosurgery Department to secure the stereotactic Leksell G frame and to perfectly align the localizer with the SPECT gantry (localizer z-symmetry axis parallel to the γ-camera rotation axis) (11). This prototype was fixed to the original table support. For brain imaging, the routinely used low-energy and ultra-high-resolution fanbeam collimator was chosen. The performed sequence consisted of 90 steps of 60 s, with each head rotating over a 120° sector. The acquisition matrix was a 128 × 128 square. A 40% window and a 20% window were centered on the 74-keV photopeak and the 167-keV photopeak, respectively, of 201Tl. Continuous transaxial tomograms of the brain were reconstructed after ramp-filtered backprojection with a Wiener postprocessing filter (noise multiplying factor, 1.15), improving the loss of spatial resolution due to the γ-camera impulse response. Pixel size and slice thickness were 2.1 mm and 2.68 mm, respectively.
MRI Acquisition.
sMRI was performed with a 1.5-T magnet (Philips) based on commonly used acquisition parameters (14). Because the reconstruction program processed images acquired on a 256 × 256 square matrix with a 260-mm-wide field of view, the pixel size was 1.02 mm. The slice thickness was 1.5 mm. The performed sequence consisted of a 3-dimensional fast-field-echo volume of transverse axial sections. The parameters used for T1-weighted images were as follows: echo time, 5.5 ms; repetition time, 20 ms; flip angle, 30°; and 2 excitations. Images were transmitted to a separate computer for biopsy planning (Stealth Station; Medtronic).
Surgical Planning and Procedure
A 1-d procedure was established for placing the stereotactic frame, acquiring the MRI and SPECT images under the frame, planning the surgery, and performing the biopsy. The sMRI-compatible Leksell G frame was fixed to the patient’s head in the operating room while the patient was under local anesthesia. The patient was immediately transported to the MRI unit to undergo the routine imaging for biopsy targeting and trajectory planning. The patient was then transported to the Department of Nuclear Medicine and was given 185 MBq of an isotonic 201Tl solution intravenously, and the frame localizer was aligned with the γ-camera system. The SPECT scanning began 5 min later. After image acquisition, the frame was identified using software developed in-house and integrated into the existing Pixie nuclear medicine software on an Odyssey workstation (Philips) with a DEC α microprocessor (Hewlett-Packard Co.). The neurosurgeon selected the volume of interest including a part or all of the tumor. The hottest point was then automatically identified by the in-house software and expressed in the Leksell reference coordinate system (11). If the first target was surgically inaccessible, a second volume of interest excluding the inaccessible part of the tumor could be chosen to identify another metabolically highly active point. The final target coordinates were transferred to the MR image, on which its anatomic position was analyzed and validated and the stereotactic biopsy planned as usual. When possible, supplementary tissue samples were taken at several points on the trajectory, before and after the chosen target.
Histologic Analysis
Tumor Classification.
All histologic samples were stained with hematoxylin and eosin. The stained sections were reviewed by 2 pathologists. Mitotic index (MI) was determined per 10 high-power fields (0.17 mm2). Tumor grade was determined according to the World Health Organization (WHO) tumor classification (15) on the most representative section, that is, the section with the highest tumor grade.
Immunohistochemical Study.
The most representative hematoxylin- and eosin-stained tumor sections were selected. Tumor sections 4 μm thick were affixed to Superfrost Plus slides (CML France) and dried at 37°C overnight. After removal of the wax and rehydratation in distilled water, endogenous peroxidase activity was blocked by 3% hydrogen peroxide in distilled water for 20 min. For antigen retrieval, sections were heated for 40 min and incubated for 30 min. The primary antibodies used were MIB1 (proliferation speed; antigen, Ki67; dilution, 1:100), 6F2 (presence of astrocytic cells; antigen, glial fibrillary acidic protein; dilution, 1:500), and SY38 (characterization of neuroendocrine tumors; antigen, synaptophysin; dilution, 1:5). The succeeding steps were performed automatically at 37° using the NexES system (Ventana Medical Systems). Subsequent reaction was made by using streptavidin–biotin–peroxidase complex. 3,3′Diaminobenzidine was used as the chromogen, and hematoxylin as the nuclear counterstain.
For the antigen Ki67 (16), 100 cells from the tumor area showing the highest density of labeling were evaluated. The percentage of cells exhibiting nuclear staining, or the so-called Ki67 index, was determined. Because high-grade tumors are often micronecrotic, making histologic analysis impossible, we calculated for each patient the micronecrosis index, that is, the percentage of necrotic samples.
Data Analysis and Statistical Methods
Leksell coordinates were determined for all biopsied points, allowing identification of the corresponding 201Tl SPECT activity using the in-house software. A 201Tl index was calculated for each sample position (thallium activity at a given position, normalized to the mean activity in the region of interest in normal tissue on the same slice). Correlations between MI, Ki67 index, 201Tl index, tumor grade, and sample position were estimated using the nonparametric Spearman correlation coefficients. In addition, the 201Tl index values were compared between grade III tumors and grade IV tumors using the nonparametric Mann–Whitney test. In a second analysis, MI, Ki67 index, 201Tl index, and tumor grade were considered as a function of distance on the trajectory from the target of each sample (class 1: x = 0 mm (target); class 2: 0 mm < |x| ≤ 5 mm; class 3: 5 mm < |x| ≤ 10 mm; class 4: |x| >10 mm). The Mann–Whitney test was used to check differences between samples from 0 to 10 mm from the target and samples more than 10 mm away from the target.
The statistical software SAS Enterprise (version 6.12/UNIX; SAS Institute Inc. [proc univariate, proc npar1way, proc corr]) was used for statistical analysis.
RESULTS
Combined 201Tl sSPECT and sMRI-guided biopsy (Figs. 1 and 2) could be performed on all 10 patients presenting with brain lesions. The sSPECT target could always be used as the final target. In 2 patients, 2 trajectories were placed in highly active, separate areas within the tumor. The number of sample positions per patient varied between 3 and 8 (median, 5). A histologic diagnosis was made for all patients (Table 1). There were 9 glial tumors (1 low-grade astrocytoma, 1 anaplastic astrocytoma, 1 oligoastrocytoma, 1 oligodendroglioma, 1 anaplastic oligodendroglioma, and 4 glioblastomas) and 1 metastasis (neuroendocrine small cell carcinoma). The tissue analysis after biopsy confirmed in 9 of the 10 patients a high grade of malignancy (WHO grades III and IV) (Table 1). In 4 of the 10 patients, the tumor grade varied along the trajectory (between grades II and III in patients 2 and 5 and grades III and IV in patients 8 and 9). In 3 patients, at least 1 of the samples was too necrotic to be analyzed histologically.

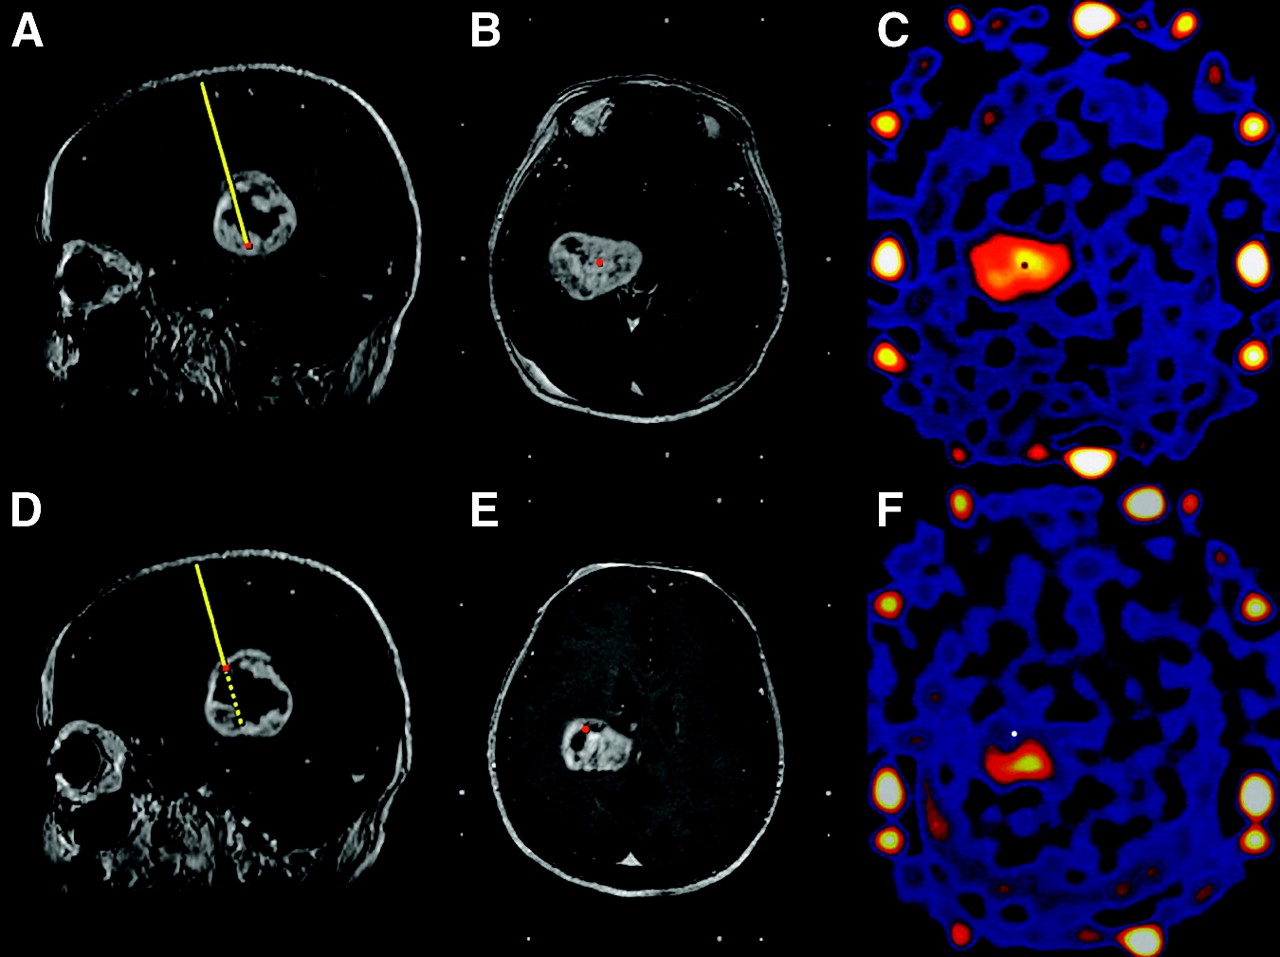
Patient 2: 201Tl sSPECT- and sMRI-guided biopsy. Target level (A–C) and level 29 mm above on trajectory (D–F) are shown on sagittal MRI slices (A and D), axial MRI slices (B and E), and axial 201Tl sSPECT slices (C and F). Coordinates of pixel with highest metabolic activity within tumor on 201Tl sSPECT images (C) were determined and transferred to MR images for usual biopsy planning (A and B). Sampled level 29 mm above target was visualized afterward on sMRI (D and E) and on 201Tl sSPECT slices (F). Histologic analysis revealed grade II (−29 mm) and grade III oligoastrocytoma (target).

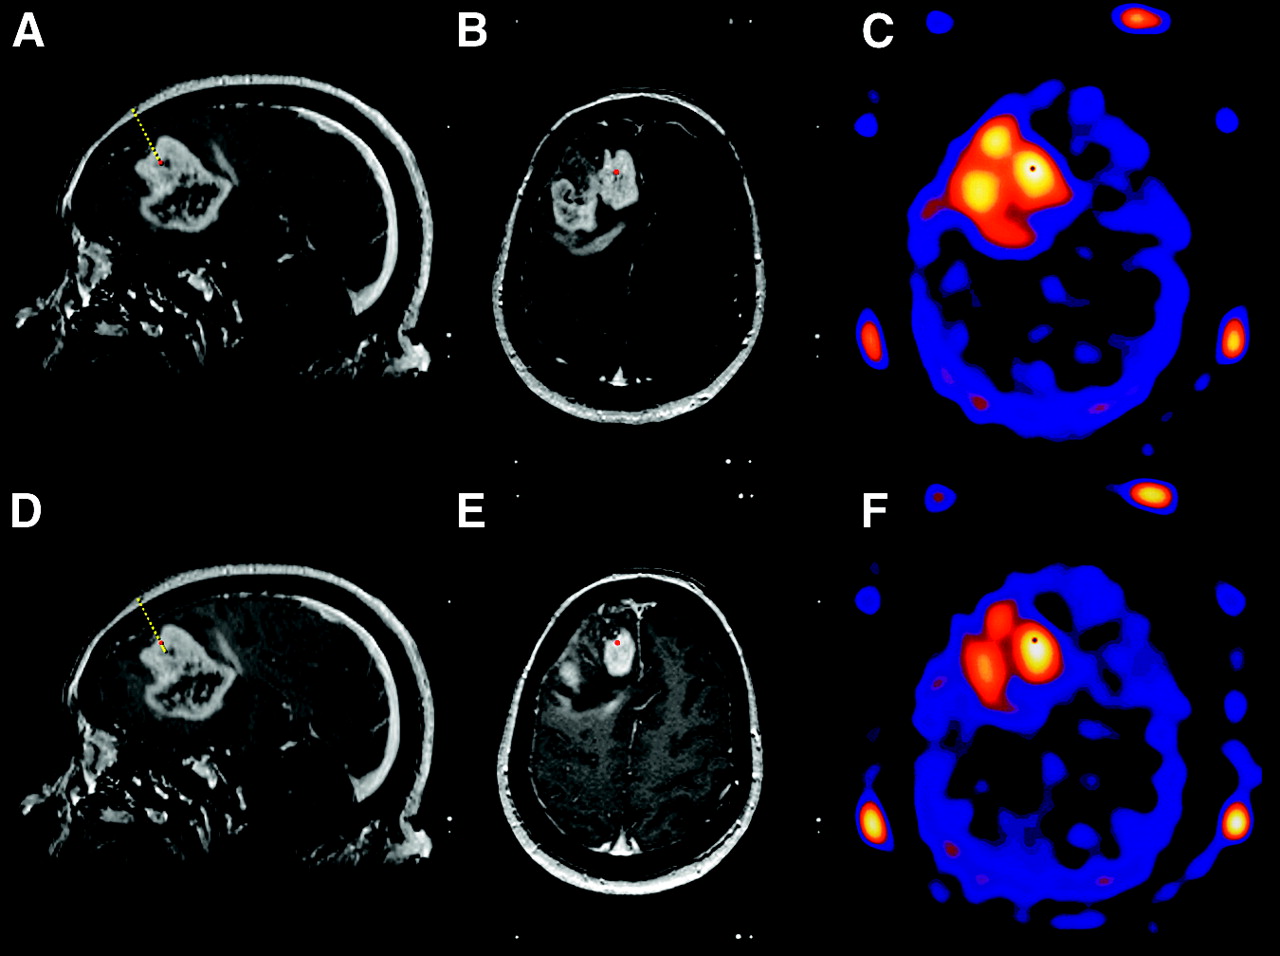
Patient 7: 201Tl sSPECT- and sMRI-guided biopsy. Target level (A–C) and level 5 mm above on trajectory (D–F) are shown on sagittal MRI slices (A and D), axial MRI slices (B and E), and axial 201Tl sSPECT slices (C and F). Histologic analysis revealed anaplastic astrocytoma (grade III) in both samples.
Histologic and Image Analysis of Brain Tumor Samples from 10 Patients
The highest mitotic activity expressed by the MI and Ki67 index always corresponded to the target or to a sample close to it (±5 mm) (Fig. 3). In only 1 patient was the highest Ki67 index 10 mm away from the target. In 7 patients, the target tumor grade corresponded to the highest identified tumor grade. The other 3 patients included 1 with micronecrosis, 1 with metastasis, and 1 with grade II tumor at the target and grade III tumor around the target.

Evolution of thallium index (TI), MI, Ki67 index (KiI), and tumor grade on trajectory for patient 8 (n = 6 samples).
Including all patient data, we found a significant correlation between Ki67 index and MI (R = 0.79; P = 0.0001), between Ki67 index and tumor grade (R = 0.47; P = 0.003), and between MI and tumor grade (R = 0.56; P = 0.0003). No significant correlation was found between MI and 201Tl index (R = 0.18; P = 0.27) or between Ki67 index and 201Tl index (R = 0.09; P = 0.55). A trend to significance existed between tumor grade and 201Tl index (R = 0.31; P = 0.06). Median values for grades III and IV were 3.05 (mean, 3.27 ± 1.89) and 4.21 (mean, 4.34 ± 1.29), respectively. The nonparametric Mann–Whitney test revealed a statistically significant difference between the 2 groups (P = 0.02). A positive correlation was found between MI and the sample position on the trajectory (R = 0.39; P = 0.01). In contrast, Ki67 index and tumor grade did not correlate with the sample position (R = 0.28; P = 0.08, and R = 0.21; P = 0.20, respectively).
The impression that Ki67 index and MI decreased in the class |x| > 10 (Fig. 4) could not be confirmed statistically (MI, P = 0.16; Ki67 index, P = 0.24; tumor grade, P = 0.38). Only 201Tl index was confirmed to decrease with distance from the target (P = 0.002).
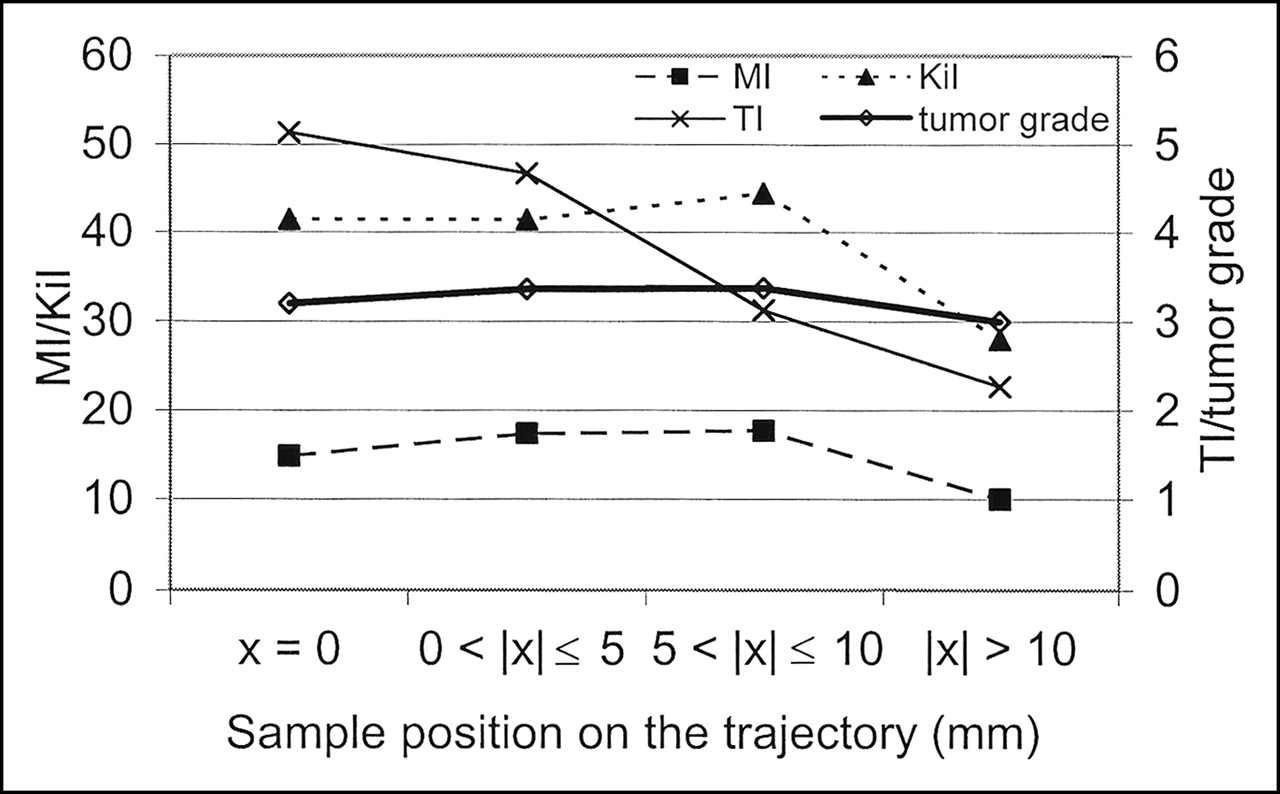
Mean values of thallium index (TI), MI, Ki67 index (KiI), and tumor grade on trajectory for all patients. Samples were divided into 4 classes: class 1: x = 0 mm (target); class 2: 0 mm < |x| ≤ 5 mm; class 3: 5 mm < |x| ≤ 10 mm; and class 4: |x| > 10 mm.
DISCUSSION
Modern neuroimaging techniques allow direct visualization of brain tumors. However, functional or morphologic imaging alone cannot predict the histologic diagnosis of a tumor with 100% accuracy and therefore cannot be used as a basis for therapy (17). Stereotactic biopsy is thus the procedure of choice for obtaining a histologic diagnosis with minimum risk of morbidity and mortality in patients with surgically unresectable tumors (18). MRI provides sharp anatomic details of the brain and is widely used in stereotactic procedures (1–3,14,19). However, studies correlating the diagnostic yield of stereotactic biopsy with MRI characteristics illustrate the limitations of those imaging techniques in defining tumor limits (2). Even if multiple serial biopsies are performed, the success rate and the pertinence of the established diagnosis remain suboptimal (3,20,21). Therefore, to obtain more representative biopsy samples, we combined sMRI-based trajectory planning with 201Tl sSPECT, a technique providing independent and complementary metabolic information. Coregistration of anatomic and functional images is increasingly being used, but no standardized method exists because coregistration depends strongly on the imaging methods and the reference system (22). In this study, a stereotactic frame was used as a fiducial system, allowing precise and safe localization of the target (14,19,23) and preventing the frequently underestimated head movements (24,25). We and others (5) believe that only the acquisition of data in a stereotactic reference system ensures accurate tissue sampling when integrating functional information in stereotactic planning.
Rarely has the superimposition of anatomic and functional examinations under the stereotactic frame been reported (4,26,27). Maciunas et al. (28) reported integration of 18F-FDG PET in a stereotactic procedure on 10 patients selected because of misleading CT and MRI findings. A second group (4,5,29) has now successfully integrated routine 18F-FDG PET acquisitions under the stereotactic Fischer frame into CT- and MRI-based stereotactic biopsy planning. The choice of trajectory is guided by the location of abnormal 18F-FDG uptake, when present. The investigators choose, as the target, the pixel in the center of the region that displays the greatest hypermetabolic activity, considered to correspond to the highest tumor grade. Their comparative study of CT and PET targets, by showing a statistically significant diagnostic yield, was encouraging (5). Having no access to PET technology at our center, we decided to develop a methodology to perform sSPECT acquisitions. Unlike the other procedures, our software detects the pixel with the highest activity inside a user-indicated volume of interest. We decided to use this automatic target detection, visually checked by the neurosurgeon, with the intention of rendering target selection as reliable as possible and user independent. The 10 patients in our clinical study were included on the basis of the 201Tl uptake seen in a preoperative 201Tl SPECT examination. Our results confirm the feasibility of sSPECT acquisitions. Furthermore, no patient has experienced complications related to the technique.
Such a stereotaxy-based technique not only allows exact transfer of SPECT coordinates to other imaging modalities but also permits a precise point-to-point comparison between uptake of SPECT radiotracer and the histologic characteristics of a lesion. Furthermore, we determined a user-independent 201Tl index based on the maximum counts per pixel and not on the often-presented average counts per pixel in the region of greatest activity. In consequence, our 201Tl indices for tumors of grades III (3.27 ± 1.89) and IV (4.34 ± 1.29) were slightly higher than those presented in the literature (2.6 ± 1.05 and 3.26 ± 1.63, respectively, for Ishibashi et al. (30) and 2.28 ± 0.49 for both grade III and grade IV for Kim et al. (8)). We confirmed the statistical significance of the correlation between 201Tl uptake and malignancy already reported by Kim et al. (8). The statistical analysis of all sampled points confirmed a global correlation between the histologic indices, Ki67 index, MI, and tumor grade—a fact that is not astonishing, as each describes proliferative activity. Concerning the correlation between the MI or Ki67 index and the 201Tl index, we report the absence of significant correlation and only a trend to significance between tumor grade and 201Tl index. These results are probably highly biased by the exclusion of tumors with low 201Tl uptake. Thus, the 201Tl index provides an independent assessment of tumor kinetics. The significant difference between grade III and grade IV tumors indicates the importance of this sSPECT-based methodology. Furthermore, the variation in tumor grade along the trajectory in 4 patients and the significant variation in MI along the trajectory confirm the possibility of underestimation, especially for large tumors (patients 2, 5, and 8). In addition, the evolution of Ki67 index and MI for each patient (Fig. 4) shows a clear tendency for proliferation to increase around the SPECT target, even if the highest histologic index does not always correspond to the highest thallium index. This tendency can be explained by the spatial resolution of the procedure. The surgical accuracy of sMRI-based procedures at our research center is 1.0 mm (14). The accuracy of functional target selection depends on SPECT camera resolution, stochastic noise, frame activity, and absence of attenuation correction, all of which influence the final number of counts. At our center, this accuracy has been shown to remain within acceptable limits, that is, less than the size of a pixel (2.1 mm) and the thickness of a slice (2.68 mm) (11). The volume of the biopsy specimen (10 × 2.84 mm3 = 28.4 mm3) is approximately twice the volume of the SPECT-defined target (2.1 × 2.1 × 2.68 mm = 11.8 mm3). The length of the biopsy needle window (10-mm length vs. 2.68-mm slice thickness and 2.1-mm pixel size) especially can limit the precision of the method.
Our results support the view that 201Tl sSPECT may contribute to the successful management of brain tumor patients requiring stereotactic biopsy. We expect that 201Tl sSPECT guidance might be used to decrease the number of biopsy samples necessary for diagnosis, especially in large tumors. Nevertheless, supplementary samples should be taken near the target to confirm the histologic result and to avoid useless biopsy in the case of a necrotic target.
Because the technique did not significantly increase patient discomfort or morbidity, centers performing stereotactic surgery and having access to SPECT technology might want to consider developing similar techniques to integrate SPECT data into the planning of stereotactic biopsy. This technique is also applicable to SPECT using other radiotracers, such as 99mTc, or to PET as already demonstrated by Levivier et al. (5). We intend to integrate stereotactic 18F-fluoro-3′-deoxy-3′-l-fluorothymidine PET (31,32) into stereotactic biopsy planning. Other promising amino acid PET radiotracers are O-(2-18F-fluoroethyl)-l-tyrosine (33) and 11C-methylmethionine (34). Clinical studies have shown better contrast relative to normal tissue activity with these radiotracers than with 18F-FDG, even in low-grade gliomas (31,32,34).
In the long term, identification of sites of high proliferative activity could enable vaccination therapy (35), gene therapy, cell transfer, and other stereotaxy-based procedures (36–40).
CONCLUSION
This clinical study has demonstrated the feasibility of calculating target coordinates for brain tumor biopsies on the basis of coregistered 201Tl sSPECT and sMR images. The tendency toward increased malignancy, that is, proliferative activity, near the target confirms the reliability of the proposed protocol. The role of this technique in histologic tumor grading might be evaluated through a comparison of stereotactic targets chosen by comparing SPECT and MR images of the same patient. In the long term, this kind of tumor-activity mapping may be amenable to driving the delivery of any therapeutic agent within the tumor.
Acknowledgments
This work was supported by the “Ligue Nationale Contre le Cancer” (French National League Against Cancer), the University Hospital in Montpellier, and the Research Group on Movement Disorders in Montpellier.
Footnotes
Received Feb. 1, 2005; revision accepted Mar. 29, 2005.
For correspondence or reprints contact: Philippe Coubes, MD, PhD, Unité de Recherche sur les Mouvements Anormaux, Neurochirurgie B, CHU Gui de Chauliac, 80 Avenue Augustin Fliche, 34295 Montpellier Cedex 5, France.
E-mail: urmae{at}chu-montpellier.fr
REFERENCES
In this issue


Jump to section
Related Articles
Cited By...
- No citing articles found.