
Main menu

  • Home
  • Content
    • Current
    • Ahead of print
    • Past Issues
    • JNM Supplement
    • SNMMI Annual Meeting Abstracts
    • Continuing Education
    • JNM Podcasts
  • Subscriptions
    • Subscribers
    • Institutional and Non-member
    • Rates
    • Journal Claims
    • Corporate & Special Sales
  • Authors
    • Submit to JNM
    • Information for Authors
    • Assignment of Copyright
    • AQARA requirements
  • Info
    • Reviewers
    • Permissions
    • Advertisers
  • About
    • About Us
    • Editorial Board
    • Contact Information
  • More
    • Alerts
    • Feedback
    • Help
    • SNMMI Journals
  • SNMMI
    • JNM
    • JNMT
    • SNMMI Journals
    • SNMMI

User menu

  • Subscribe
  • My alerts
  • Log in
  • My Cart

Search

  • Advanced search
Journal of Nuclear Medicine
  • SNMMI
    • JNM
    • JNMT
    • SNMMI Journals
    • SNMMI
  • Subscribe
  • My alerts
  • Log in
  • My Cart
Journal of Nuclear Medicine

Advanced Search

  • Home
  • Content
    • Current
    • Ahead of print
    • Past Issues
    • JNM Supplement
    • SNMMI Annual Meeting Abstracts
    • Continuing Education
    • JNM Podcasts
  • Subscriptions
    • Subscribers
    • Institutional and Non-member
    • Rates
    • Journal Claims
    • Corporate & Special Sales
  • Authors
    • Submit to JNM
    • Information for Authors
    • Assignment of Copyright
    • AQARA requirements
  • Info
    • Reviewers
    • Permissions
    • Advertisers
  • About
    • About Us
    • Editorial Board
    • Contact Information
  • More
    • Alerts
    • Feedback
    • Help
    • SNMMI Journals
  • View or Listen to JNM Podcast
  • Visit JNM on Facebook
  • Join JNM on LinkedIn
  • Follow JNM on Twitter
  • Subscribe to our RSS feeds
OtherClinical Investigations

Rapid Scanning Protocol for Brain 18F-FDG PET: A Validation Study

Wei Ping Chen, Ichiro Matsunari, Akihiro Noda, Daisuke Yanase, Kazuyoshi Yajima, Nozomi Takeda, Masahito Yamada, Satoshi Minoshima and Shintaro Nishimura
Journal of Nuclear Medicine October 2005, 46 (10) 1633-1641;
Wei Ping Chen
  • Find this author on Google Scholar
  • Find this author on PubMed
  • Search for this author on this site
Ichiro Matsunari
  • Find this author on Google Scholar
  • Find this author on PubMed
  • Search for this author on this site
Akihiro Noda
  • Find this author on Google Scholar
  • Find this author on PubMed
  • Search for this author on this site
Daisuke Yanase
  • Find this author on Google Scholar
  • Find this author on PubMed
  • Search for this author on this site
Kazuyoshi Yajima
  • Find this author on Google Scholar
  • Find this author on PubMed
  • Search for this author on this site
Nozomi Takeda
  • Find this author on Google Scholar
  • Find this author on PubMed
  • Search for this author on this site
Masahito Yamada
  • Find this author on Google Scholar
  • Find this author on PubMed
  • Search for this author on this site
Satoshi Minoshima
  • Find this author on Google Scholar
  • Find this author on PubMed
  • Search for this author on this site
Shintaro Nishimura
  • Find this author on Google Scholar
  • Find this author on PubMed
  • Search for this author on this site
  • Article
  • Figures & Data
  • Info & Metrics
  • PDF
Loading

Article Figures & Data

Figures

  • Tables
  • FIGURE 1.
    • Download figure
    • Open in new tab
    • Download powerpoint
    FIGURE 1.

    Schematic representation of rapid and conventional scanning protocols.
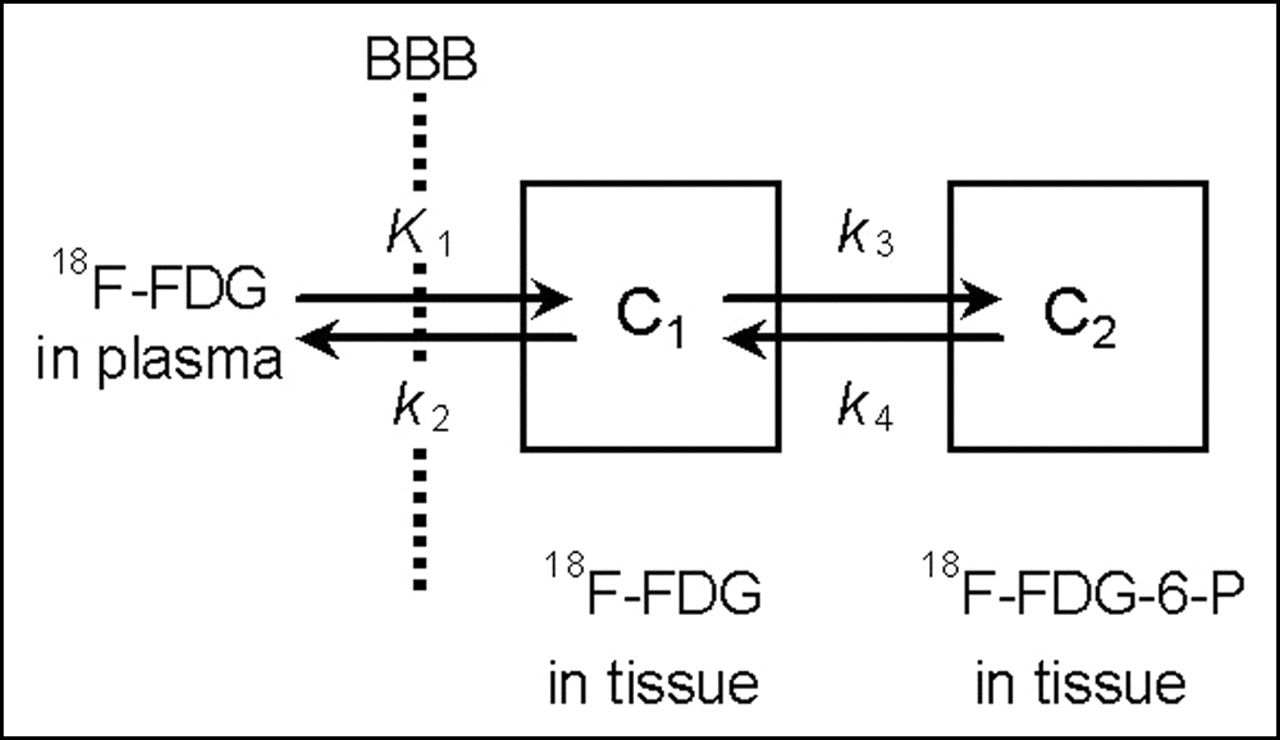
  • FIGURE 2.
    • Download figure
    • Open in new tab
    • Download powerpoint
    FIGURE 2.

    Kinetic model used in simulation study. BBB = blood–brain barrier; 18F-FDG-6-P = 18F-FDG-6-phosphate.
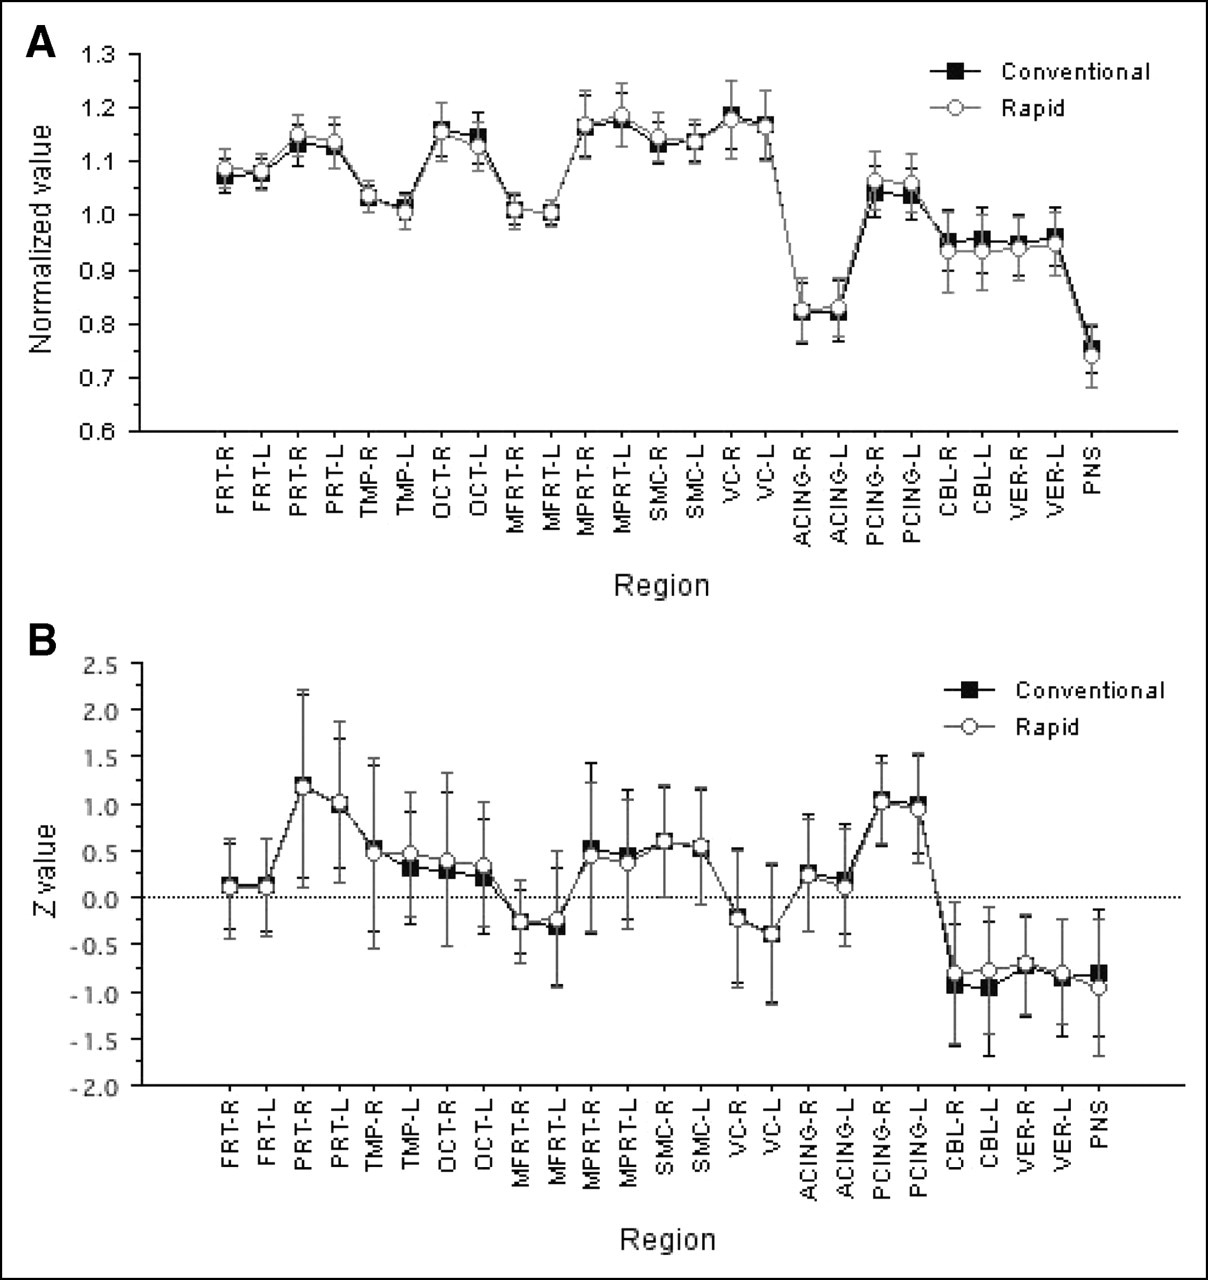
  • FIGURE 3.
    • Download figure
    • Open in new tab
    • Download powerpoint
    FIGURE 3.

    (A) Comparison of normalized values between the 2 scanning protocols in healthy group. (B) Comparison of z values between the 2 scanning protocols in patient group. Error bars show SD of normalized values or z values in each scanning protocol. ACING = anterior cingulate gyrus; CBL = cerebellar hemisphere; FRT = frontal cortex; MFRT = medial frontal association cortex; MPRT = medial parietal association cortex; OCT = occipital cortex; PCING = posterior cingulate gyrus; PNS = pons; PRT = parietal cortex; SMC = primary sensorimotor cortex; TMP = temporal cortex; VC = primary visual cortex; VER = cerebellar vermis.
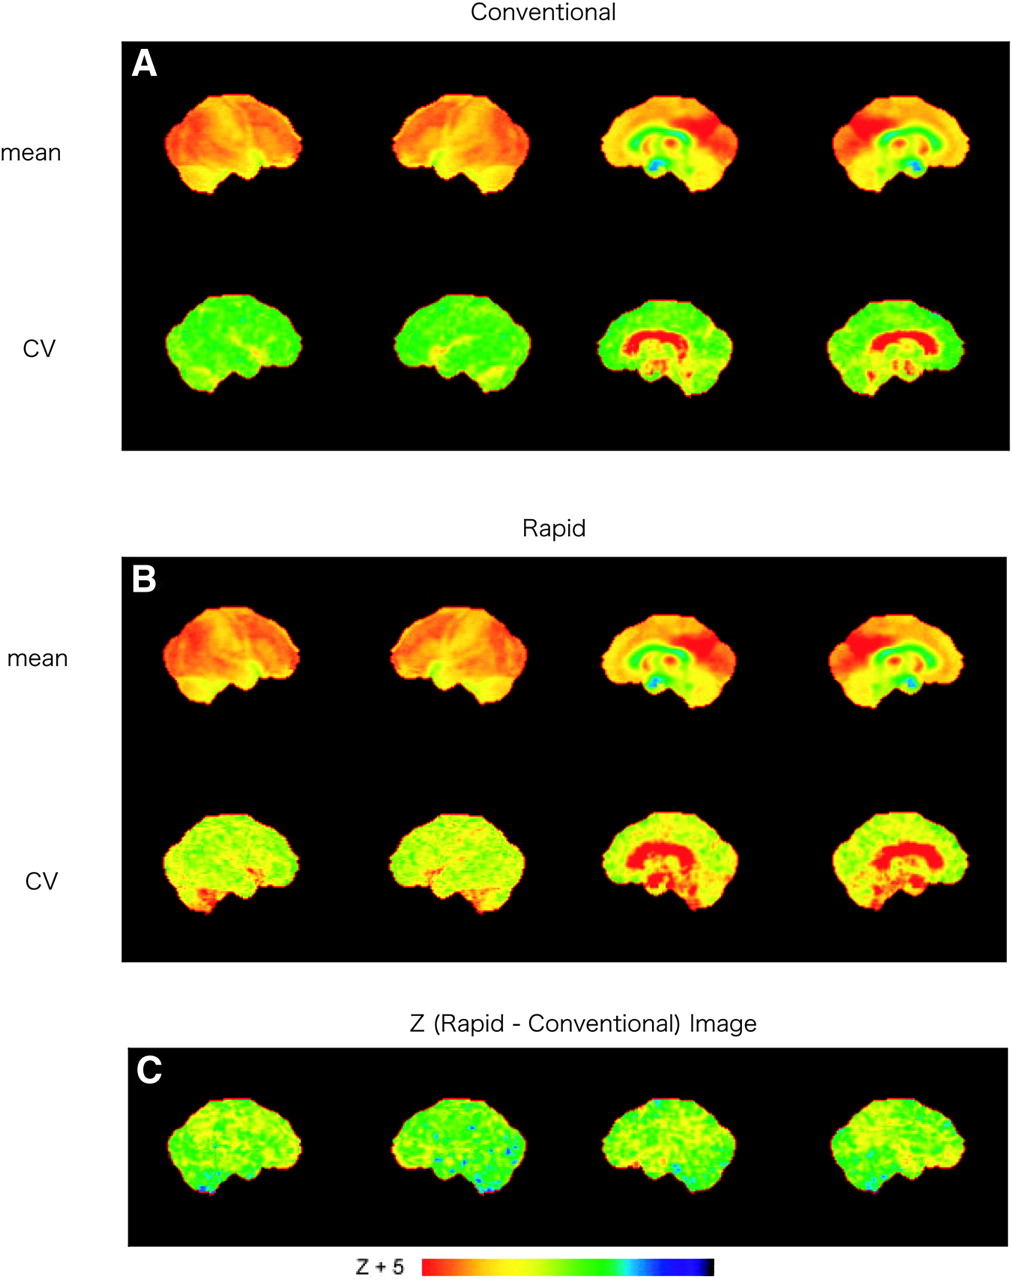
  • FIGURE 4.
    • Download figure
    • Open in new tab
    • Download powerpoint
    FIGURE 4.

    (A and B) Mean normalized activity and CV images obtained from conventional (A) and rapid (B) scanning protocols in healthy group. (C) z (rapid − conventional) images showing differences between the 2 protocols.
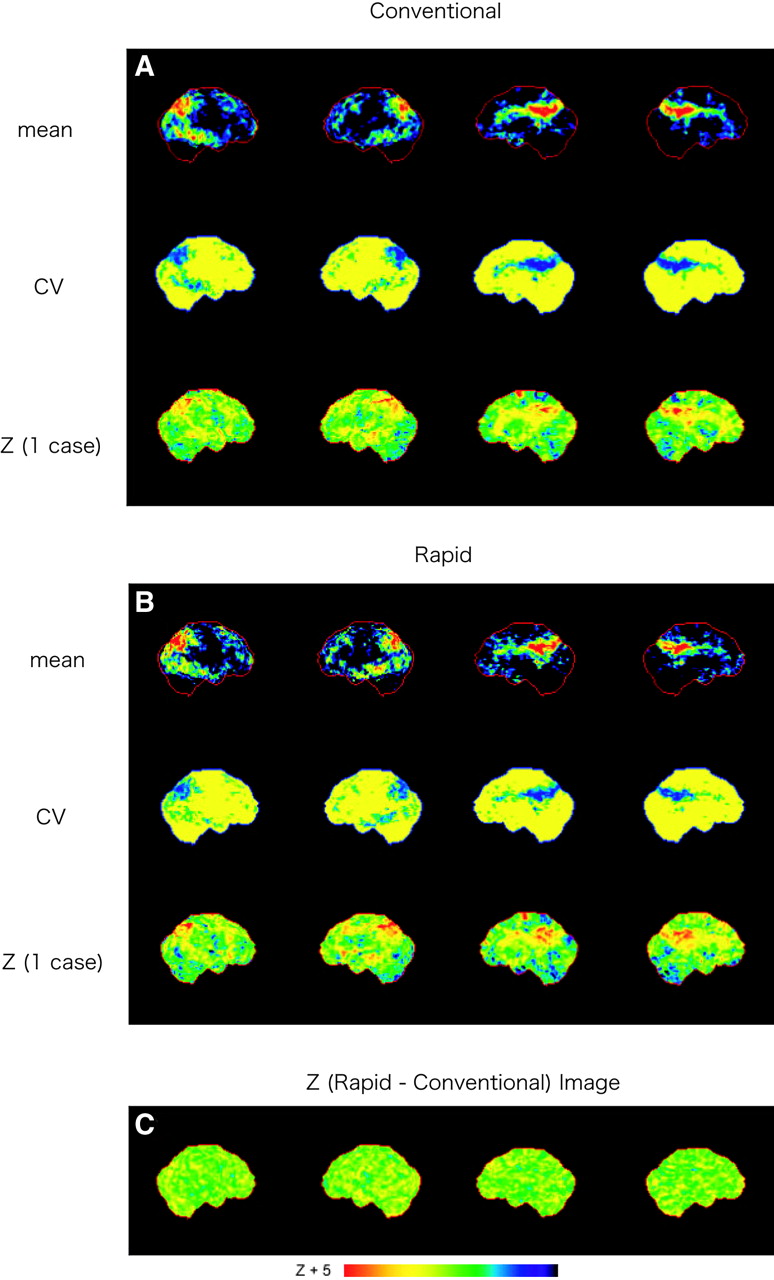
  • FIGURE 5.
    • Download figure
    • Open in new tab
    • Download powerpoint
    FIGURE 5.

    (A and B) Mean z image and CV images obtained from conventional (A) and rapid (B) scanning protocols in patient group. z (1 case) are z images of 1 patient with probable AD. (C) z (rapid − conventional) image showing differences between the 2 protocols.

  • FIGURE 6.
    • Download figure
    • Open in new tab
    • Download powerpoint
    FIGURE 6.

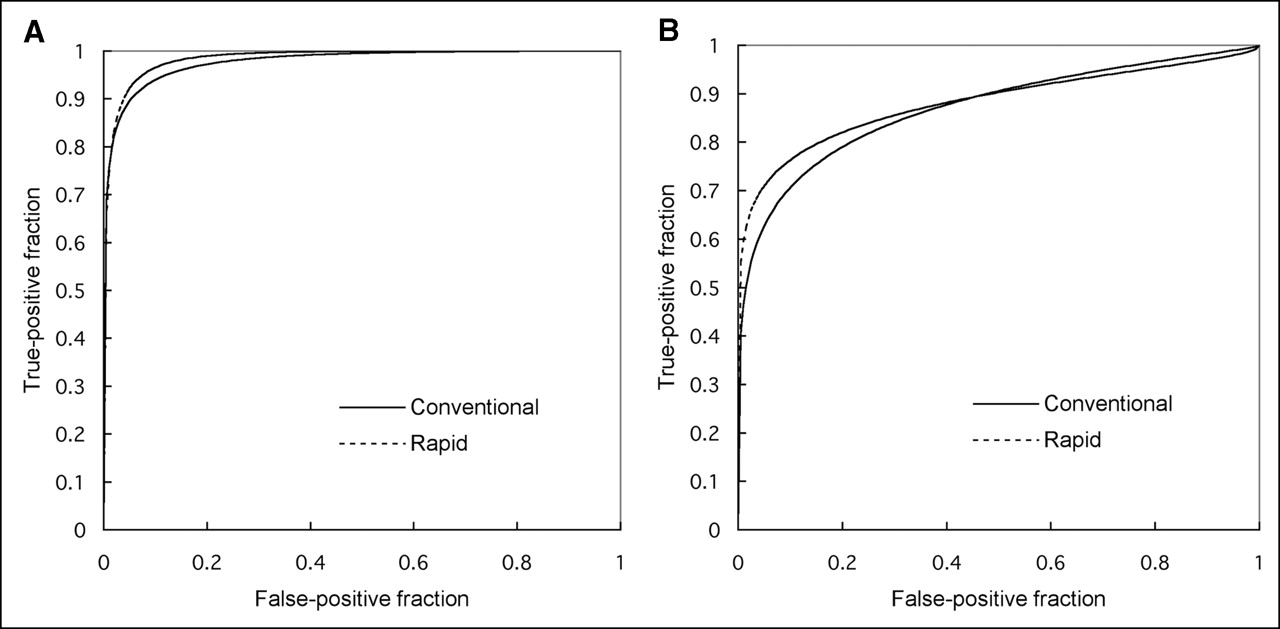
    ROC curves obtained from conventional- and rapid-protocol images with large z values, indicative of true-positive cases in area of posterior cingulate gyri and precunei (A) and lateral parietal association cortex (B).

  • FIGURE 7.
    • Download figure
    • Open in new tab
    • Download powerpoint
    FIGURE 7.

    Simulated time–activity curves in each region (left) and calculated values corresponding to the 2 protocols, normalized by mean value of cortical regions (right). CAD = caudate; CBL = cerebellum; FRT = frontal cortex; OCT = occipital cortex; PRT = parietal cortex; THL = thalamus; TMP = temporal cortex.

Tables

  • Figures
    • View popup
    TABLE 1

    Different Parameters Between the 2 Protocols

    ParameterConventionalRapid
    Time after injection40 min60 min
    Length of transmission scan10 min1 min
    Length of emission scan10 min3 min
    Attenuation correctionMeasuredSegmented
    • View popup
    TABLE 2

    Comparison of Relative Glucose Activities in Healthy Subjects and Mean z Values in Patients Between the 2 Protocols

    RegionRelative value (mean ± SD)Difference (%)Mean z value (mean ± SD)Difference (%)
    Conventional protocolRapid protocolConventional protocolRapid protocol
    R frontal association cortex1.08 ± 0.031.09 ± 0.04−1.20.13 ± 0.450.10 ± 0.542.9
    L frontal association cortex1.08 ± 0.031.08 ± 0.03−0.20.14 ± 0.500.11 ± 0.533.3
    R parietal association cortex1.13 ± 0.041.15 ± 0.04−1.8*1.19 ± 0.961.17 ± 1.052.1
    L parietal association cortex1.13 ± 0.041.14 ± 0.05−0.61.00 ± 0.701.01 ± 0.86−1.3
    R temporal association cortex1.03 ± 0.031.04 ± 0.03−0.40.53 ± 0.890.47 ± 1.025.7
    L temporal association cortex1.02 ± 0.031.01 ± 0.030.80.32 ± 0.590.46 ± 0.68−14.2
    R occipital association cortex1.16 ± 0.051.16 ± 0.050.50.30 ± 0.820.40 ± 0.92−10.5
    L occipital association cortex1.15 ± 0.051.13 ± 0.051.7*0.22 ± 0.610.35 ± 0.67−13.20
    R medial frontal cortex1.01 ± 0.031.01 ± 0.030.3−0.26 ± 0.34−0.25 ± 0.43−0.6
    L medial frontal cortex1.01 ± 0.021.00 ± 0.030.2−0.31 ± 0.61−0.24 ± 0.72−6.9
    R medial parietal cortex1.17 ± 0.061.17 ± 0.06−0.30.52 ± 0.910.43 ± 0.798.9
    L medial parietal cortex1.18 ± 0.051.19 ± 0.06−1.00.46 ± 0.690.36 ± 0.699.5
    R primary sensorimotor cortex1.14 ± 0.041.15 ± 0.05−1.20.60 ± 0.590.60 ± 0.61−0.7
    L primary sensorimotor cortex1.14 ± 0.031.14 ± 0.041.30.53 ± 0.610.54 ± 0.63−1.5
    R primary visual cortex1.19 ± 0.061.18 ± 0.071.2−0.20 ± 0.72−0.23 ± 0.733.9
    L primary visual cortex1.17 ± 0.061.17 ± 0.070.2−0.39 ± 0.74−0.40 ± 0.761.0
    R anterior cingulate gyrus0.82 ± 0.060.83 ± 0.06−0.70.25 ± 0.630.24 ± 0.601.7
    L anterior cingulate gyrus0.82 ± 0.060.83 ± 0.06−0.70.19 ± 0.590.16 ± 0.634.0
    R posterior cingulate gyrus1.04 ± 0.051.06 ± 0.05−2.0*1.04 ± 0.481.01 ± 0.442.6
    L posterior cingulate gyrus1.04 ± 0.051.06 ± 0.06−2.1*0.99 ± 0.510.96 ± 0.583.9
    R cerebellar hemisphere0.95 ± 0.060.93 ± 0.072.1−0.94 ± 0.65−0.81 ± 0.76−12.9
    L cerebellar hemisphere0.96 ± 0.060.93 ± 0.072.3−0.97 ± 0.72−0.78 ± 0.68−18.2
    R cerebellar vermis0.95 ± 0.060.94 ± 0.060.7−0.74 ± 0.52−0.71 ± 0.53−2.9
    L cerebellar vermis0.96 ± 0.050.95 ± 0.061.4−0.86 ± 0.62−0.79 ± 0.55−7.1
    Pons0.75 ± 0.040.74 ± 0.061.4−0.81 ± 0.68−0.96 ± 0.7415.3
    • ↵* P < 0.05, by post hoc Scheffé test followed by repeated-measures ANOVA.

    • Relative values = region/global brain.

PreviousNext
Back to top

In this issue

Journal of Nuclear Medicine: 46 (10)
Journal of Nuclear Medicine
Vol. 46, Issue 10
October 1, 2005
  • Table of Contents
  • About the Cover
  • Index by author
Print
Download PDF
Article Alerts
Sign In to Email Alerts with your Email Address
Email Article

Thank you for your interest in spreading the word on Journal of Nuclear Medicine.

NOTE: We only request your email address so that the person you are recommending the page to knows that you wanted them to see it, and that it is not junk mail. We do not capture any email address.

Enter multiple addresses on separate lines or separate them with commas.
Rapid Scanning Protocol for Brain 18F-FDG PET: A Validation Study
(Your Name) has sent you a message from Journal of Nuclear Medicine
(Your Name) thought you would like to see the Journal of Nuclear Medicine web site.
Citation Tools
Rapid Scanning Protocol for Brain 18F-FDG PET: A Validation Study
Wei Ping Chen, Ichiro Matsunari, Akihiro Noda, Daisuke Yanase, Kazuyoshi Yajima, Nozomi Takeda, Masahito Yamada, Satoshi Minoshima, Shintaro Nishimura
Journal of Nuclear Medicine Oct 2005, 46 (10) 1633-1641;

Citation Manager Formats

  • BibTeX
  • Bookends
  • EasyBib
  • EndNote (tagged)
  • EndNote 8 (xml)
  • Medlars
  • Mendeley
  • Papers
  • RefWorks Tagged
  • Ref Manager
  • RIS
  • Zotero
Share
Rapid Scanning Protocol for Brain 18F-FDG PET: A Validation Study
Wei Ping Chen, Ichiro Matsunari, Akihiro Noda, Daisuke Yanase, Kazuyoshi Yajima, Nozomi Takeda, Masahito Yamada, Satoshi Minoshima, Shintaro Nishimura
Journal of Nuclear Medicine Oct 2005, 46 (10) 1633-1641;
Twitter logo Facebook logo LinkedIn logo Mendeley logo
  • Tweet Widget
  • Facebook Like
  • Google Plus One
Bookmark this article

Jump to section

  • Article
    • Abstract
    • MATERIALS AND METHODS
    • RESULTS
    • DISCUSSION
    • CONCLUSION
    • Acknowledgments
    • Footnotes
    • REFERENCES
  • Figures & Data
  • Info & Metrics
  • PDF

Related Articles

  • THIS MONTH IN JNM
  • PubMed
  • Google Scholar

Cited By...

  • SNMMI Procedure Standard/EANM Practice Guideline for Brain [18F]FDG PET Imaging, Version 2.0
  • Limits for Reduction of Acquisition Time and Administered Activity in 18F-FDG PET Studies of Alzheimer Dementia and Frontotemporal Dementia
  • Reply: Advantage of Late Scanning in Brain 18F-FDG PET.
  • Advantage of Late Scanning in Brain 18F-FDG PET
  • Google Scholar

More in this TOC Section

  • Cardiac Presynaptic Sympathetic Nervous Function Evaluated by Cardiac PET in Patients with Chronotropic Incompetence Without Heart Failure
  • Validation and Evaluation of a Vendor-Provided Head Motion Correction Algorithm on the uMI Panorama PET/CT System
  • Left Ventricular Strain from Myocardial Perfusion PET Imaging: Method Development and Comparison to 2-Dimensional Echocardiography
Show more Clinical Investigations

Similar Articles

SNMMI

© 2025 SNMMI

Powered by HighWire