


Article Figures & Data
Figures
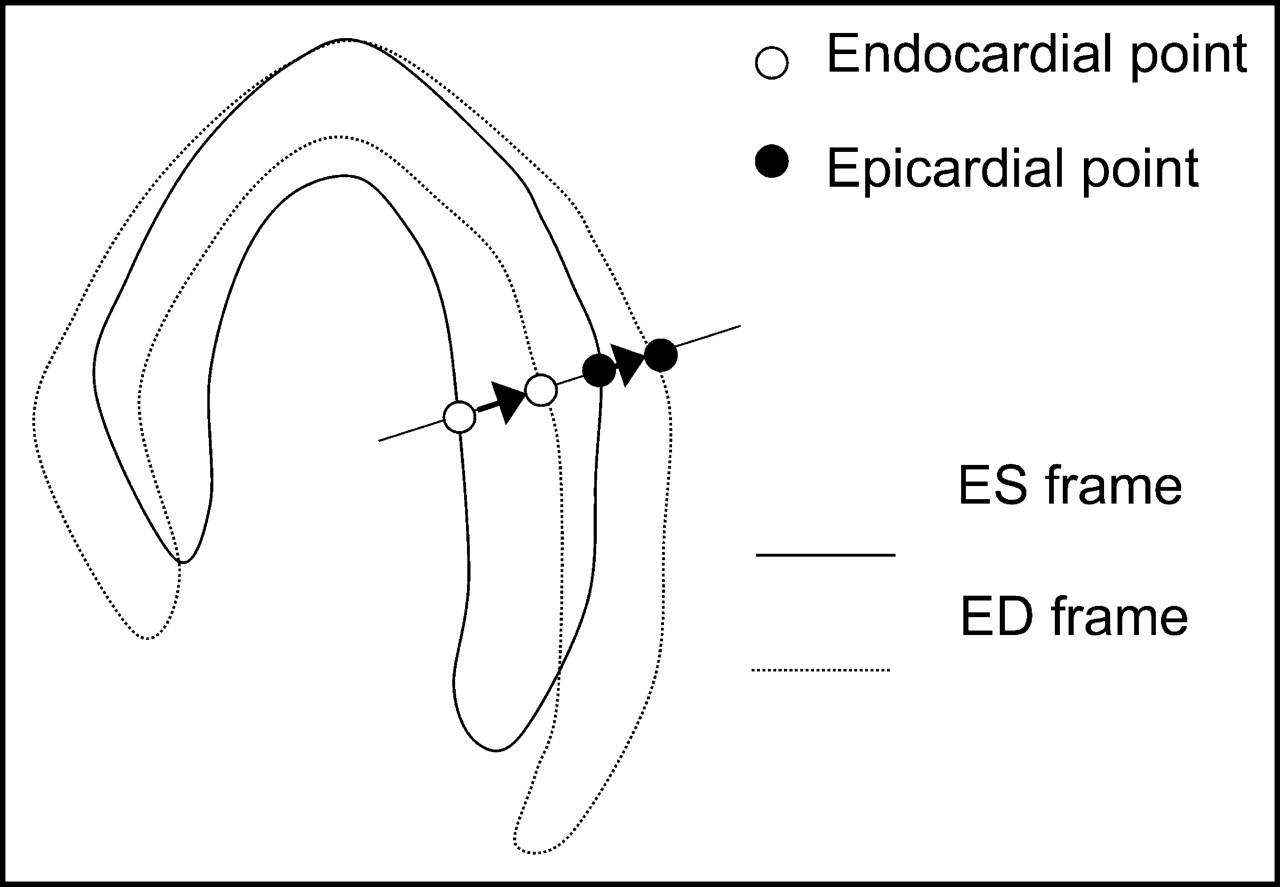
- FIGURE 1.
Diagram illustrating generation of source and target equivalent points. Both endo- and epicardial surfaces are used to create 2 displacement vectors for each normal profile.
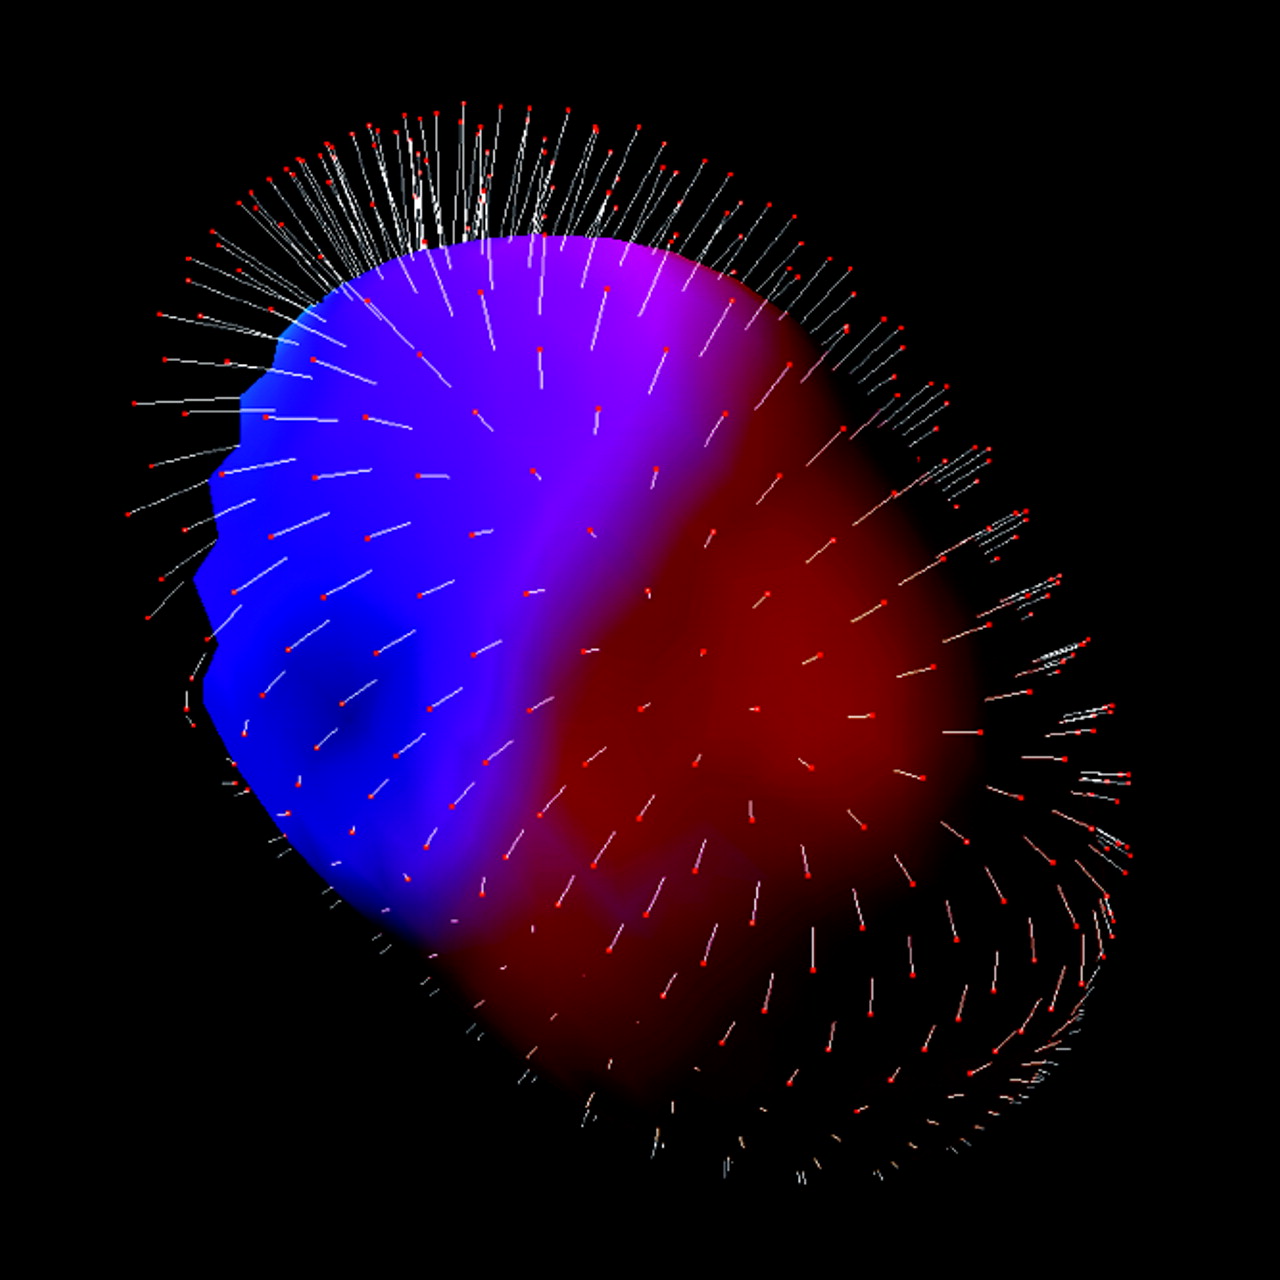
- FIGURE 2.
Illustration of displacement vectors used in image warping. End-systolic (ES) epicardial surface is shown with perfusion data represented in color. Displacement vectors (white) show local motion between ES and ED. ED position of epicardial surface is marked with red points.
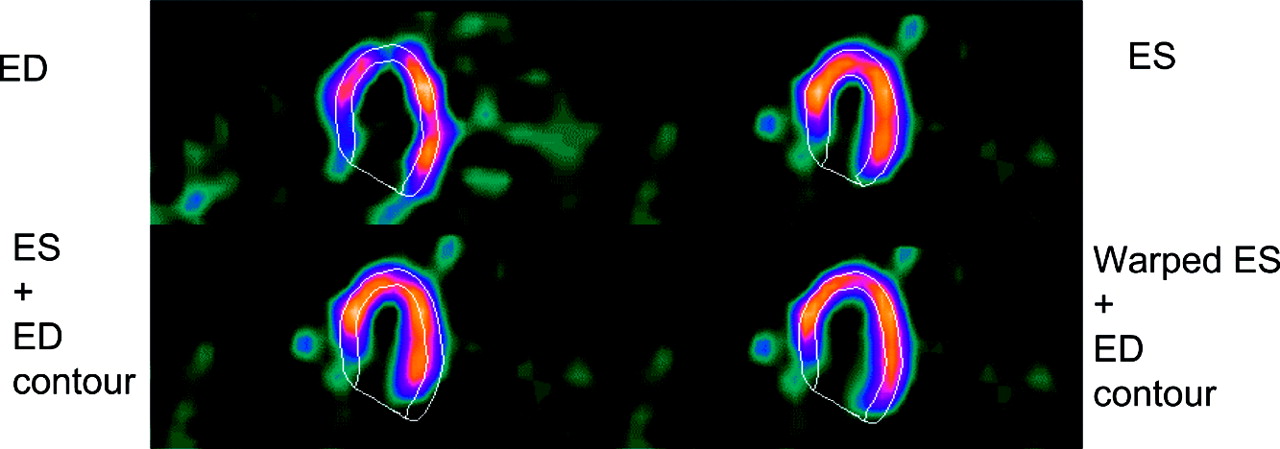
- FIGURE 3.
Example of image warping applied to ES frame. ED frame is shown with ED contour (top left); ES frame is shown with ES contour (top right). ES frame is shown with ED contour (bottom left); warped ES frame is shown with ED contour (bottom right).
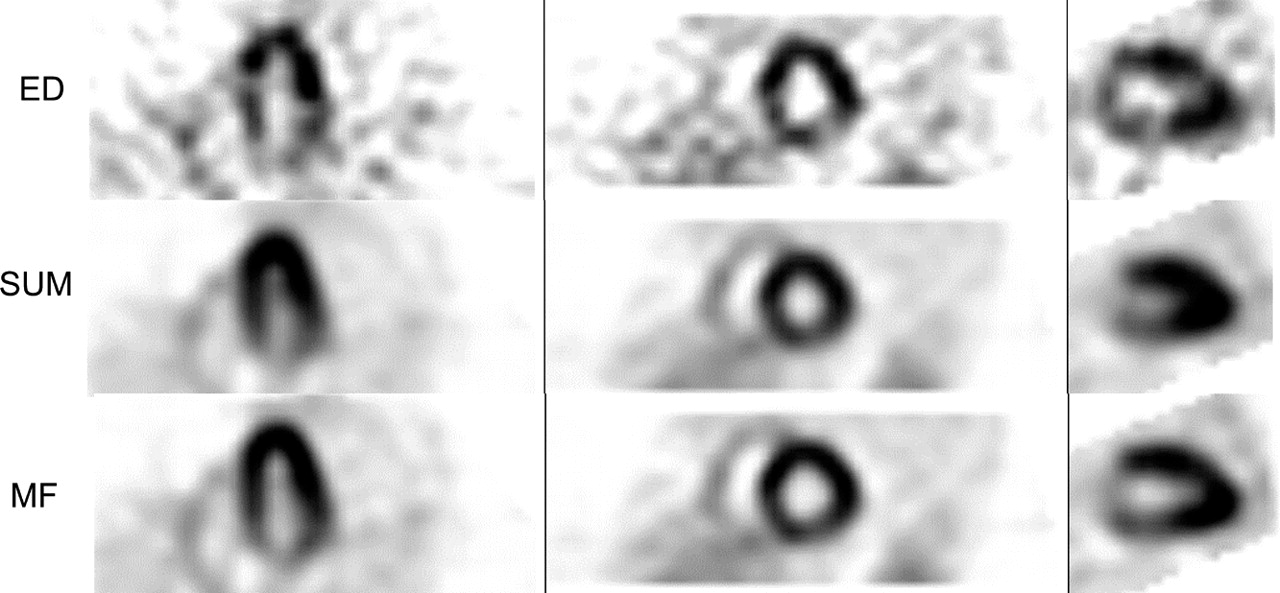
- FIGURE 4.
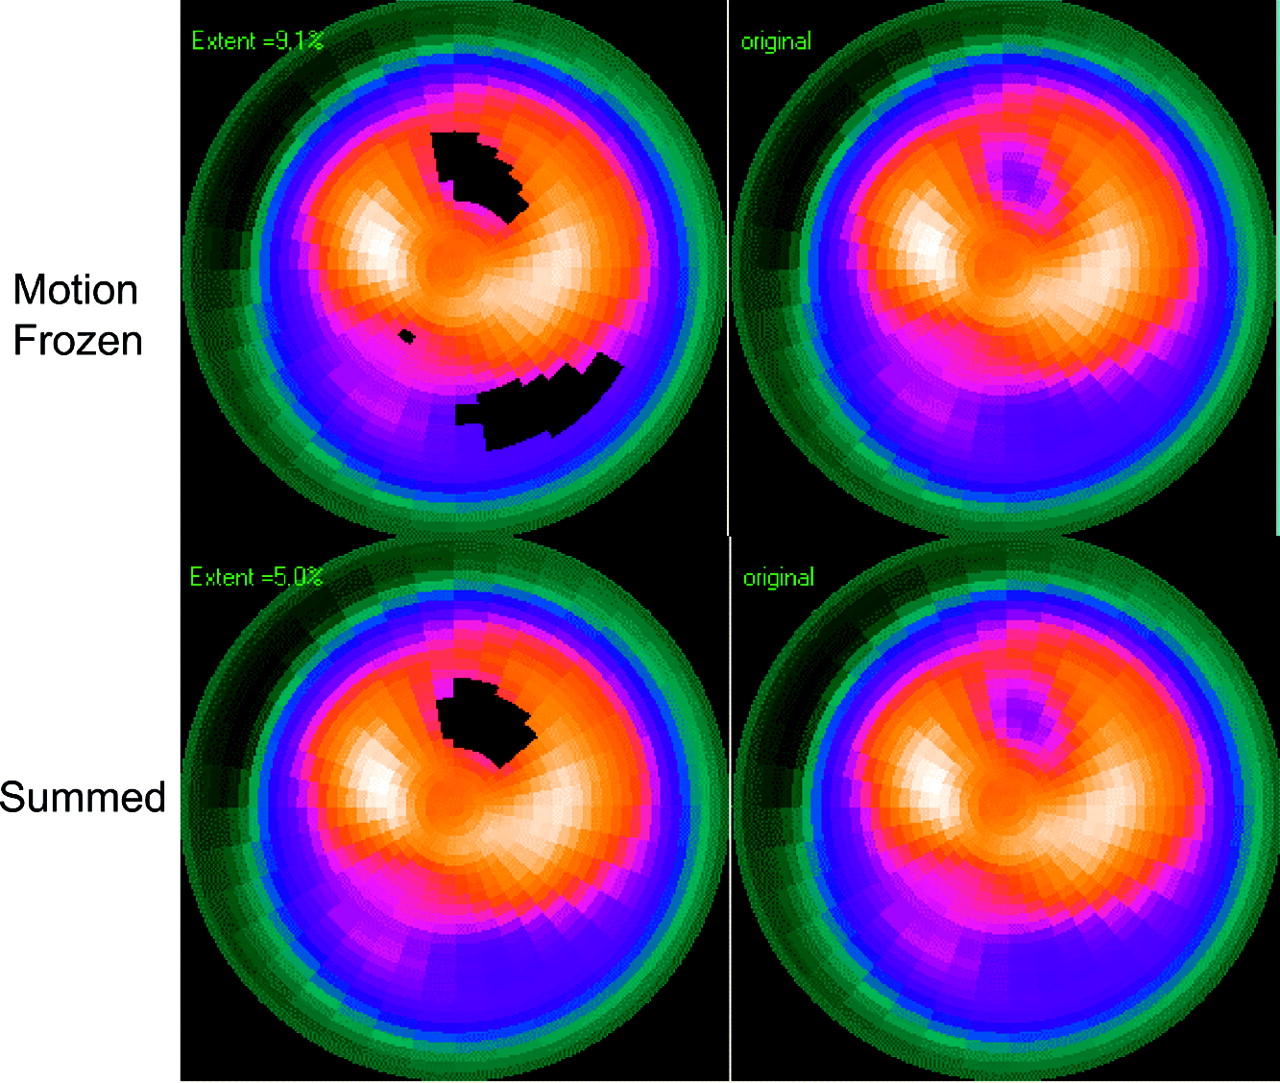
MF perfusion images compared with summed perfusion images in case of double-vessel disease confirmed by angiography (100% left anterior descending artery [LAD] occlusion and 80% left circumflex artery [LCx] occlusion). Both standard quantification technique and visual analysis of summed data identified only the LAD lesion; the additional LCx lesion was identified only by MF quantification.
- FIGURE 5.
Results of polar map quantification using both MF technique and standard ungated technique in case presented in Figure 4. Blackout maps (left) and raw perfusion maps (right) for MF technique and standard summed quantification (Summed) are shown.
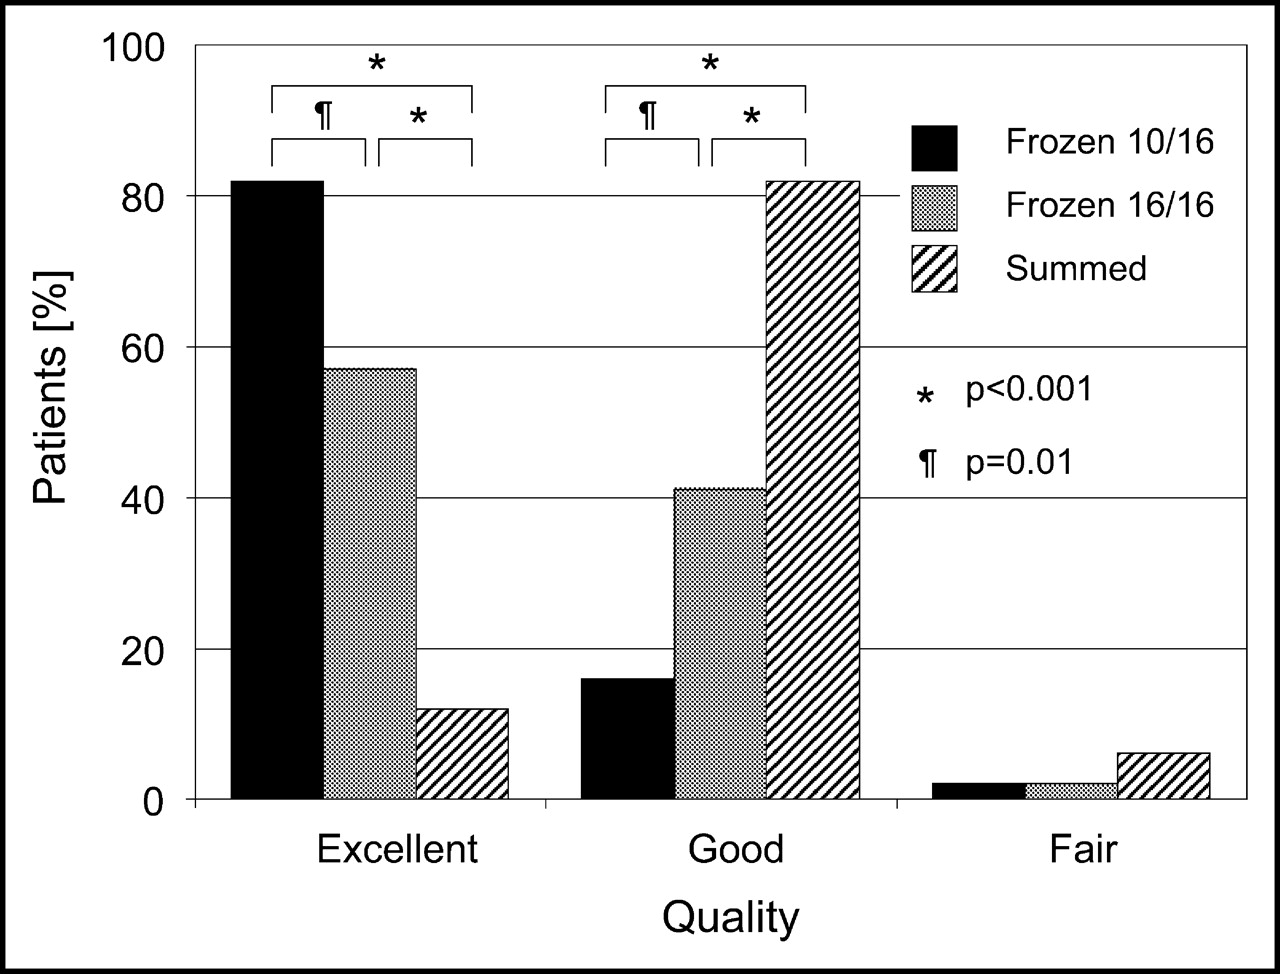
- FIGURE 6.
Comparison of visually assessed image quality for 10 of 16 motion-frozen, 16 of 16 motion-frozen, and summed images.
- FIGURE 7.
ROC curves for detection of CAD using defect extent for 16 of 16 motion-frozen and standard quantification in 51 patients.


Tables
Parameter Value Age (y) 67 ± 11 Sex (female) 20 (39) Hypertension 32 (63) Diabetes 14 (27) Hypercholesterolemia 33 (65) Angina or shortness of breath 40 (78) Stress test (exercise) 21 (41) ≥70% stenosis 34 (67) Values in parentheses are percentage.
ED–ES motion range (mm) Males (n = 31) Females (n = 20) Endocardial 13 ± 2 14 ± 2 Epicardial 12 ± 2 12 ± 2 Values are expressed as mean ± SD.
In this issue


Jump to section
Related Articles
Cited By...
- Motion Correction of 18F-NaF PET for Imaging Coronary Atherosclerotic Plaques
- Dual-Gated Motion-Frozen Cardiac PET with Flurpiridaz F 18
- Evaluating the Role of Routine Prone Acquisition on Visual Evaluation of SPECT Images
- Achieving Very-Low-Dose Radiation Exposure in Cardiac Computed Tomography, Single-Photon Emission Computed Tomography, and Positron Emission Tomography
- Quantitative Analysis of Myocardial Perfusion SPECT Anatomically Guided by Coregistered 64-Slice Coronary CT Angiography
- Automated Quality Control for Segmentation of Myocardial Perfusion SPECT
- Motion-Frozen Myocardial Perfusion SPECT Improves Detection of Coronary Artery Disease in Obese Patients
- High-Speed Myocardial Perfusion Imaging: Initial Clinical Comparison With Conventional Dual Detector Anger Camera Imaging
- Non-rigid image registration: theory and practice