


Article Figures & Data
Figures
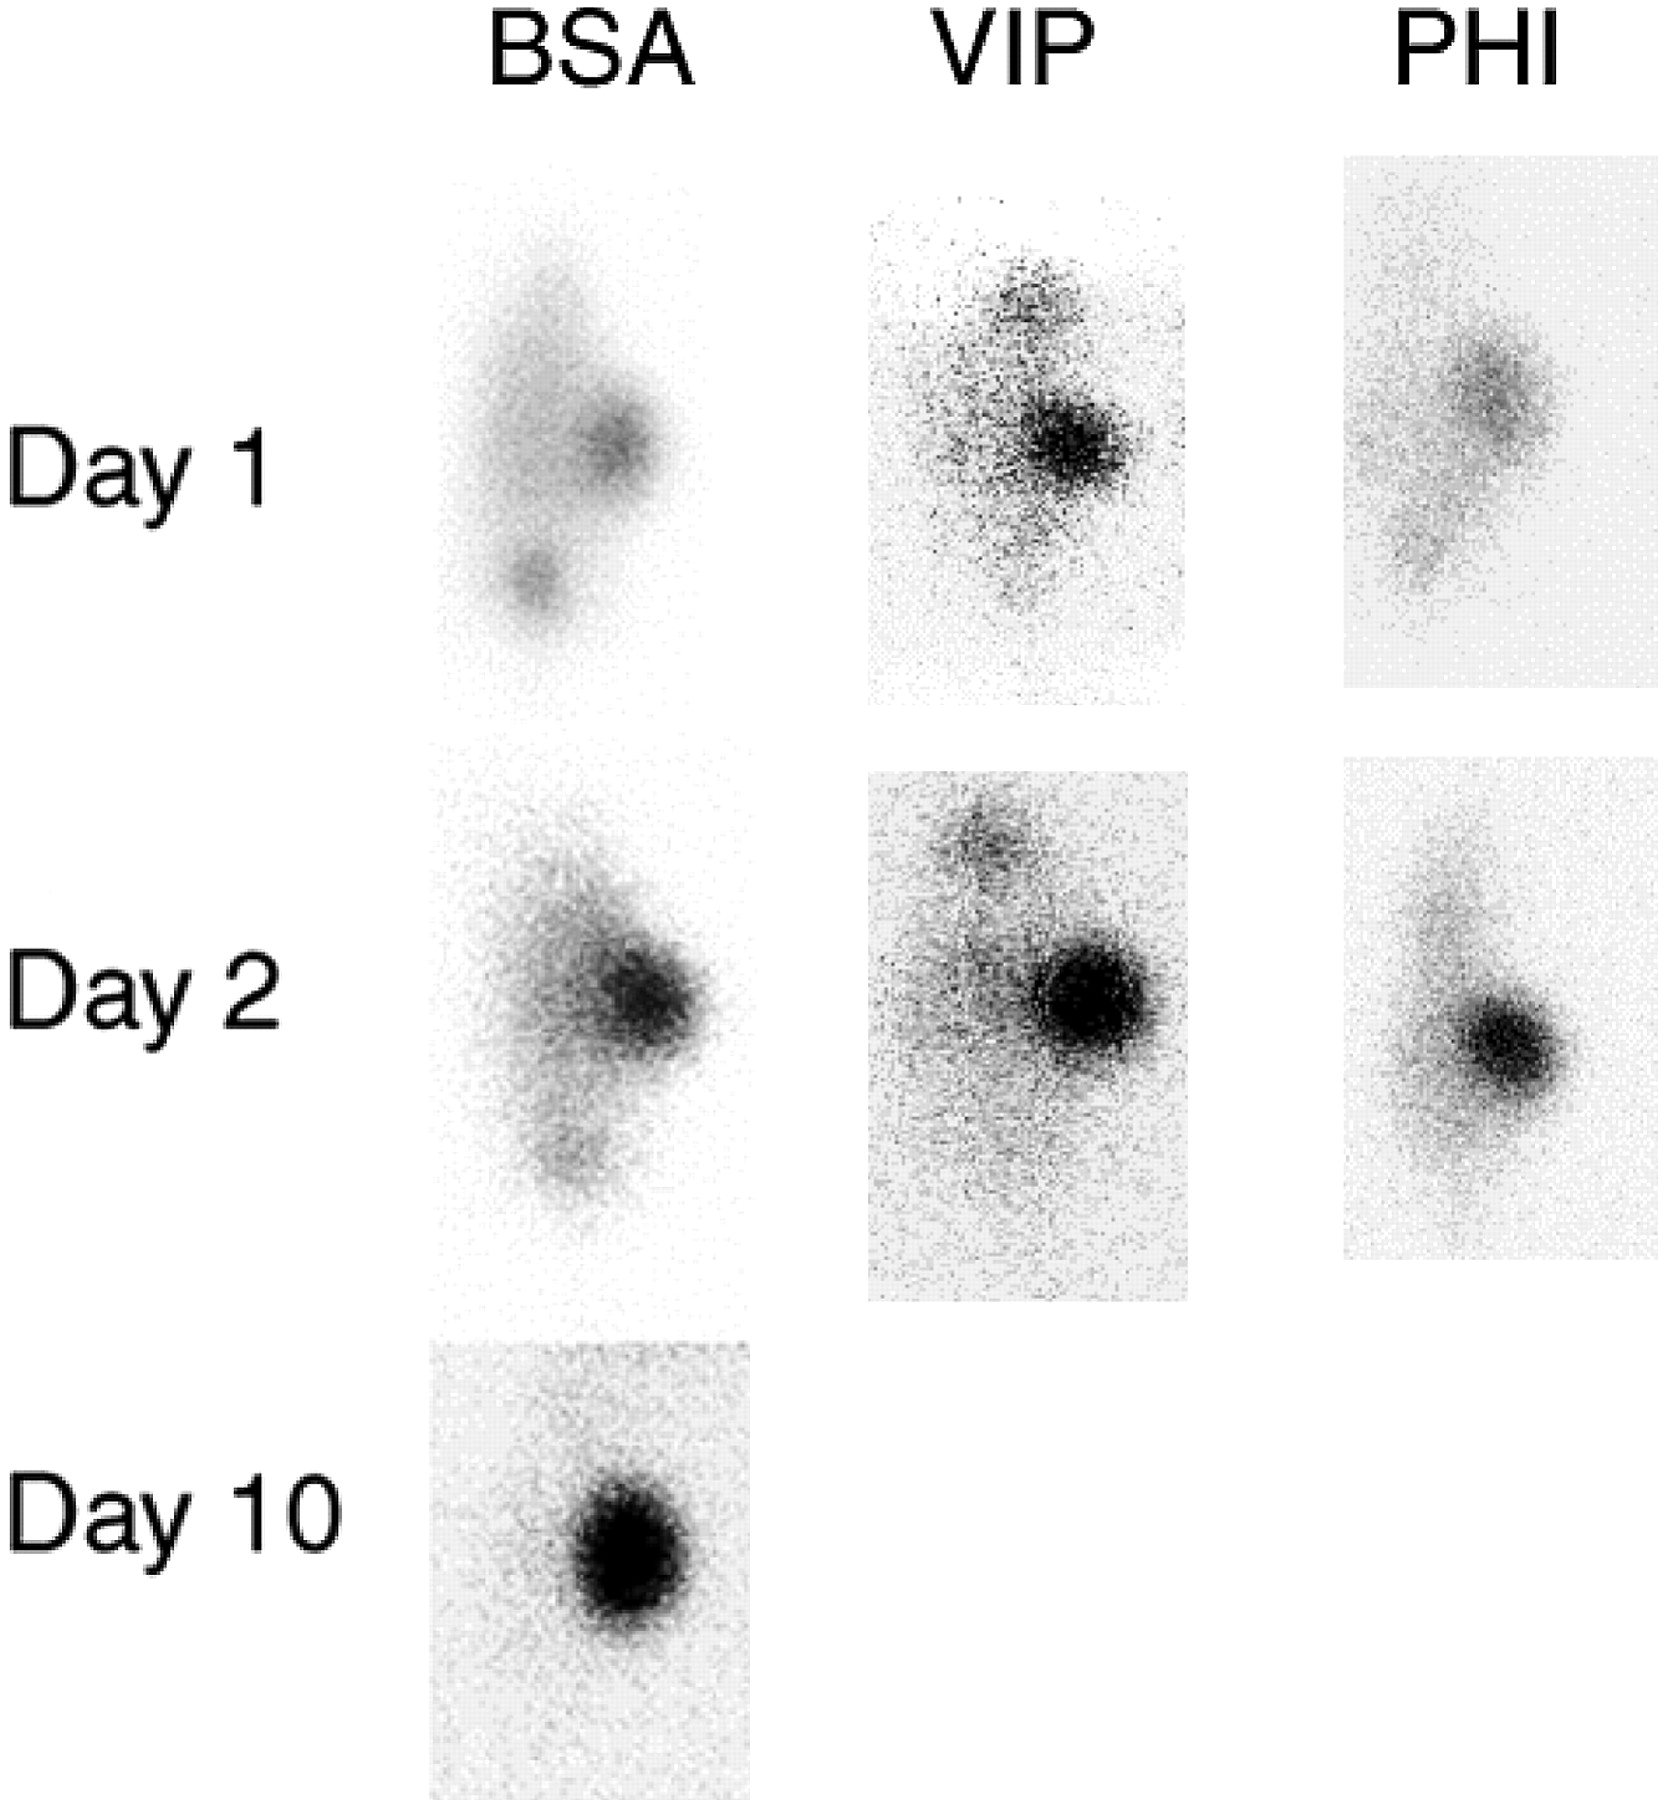
- FIGURE 1.
Relationship of normalized T/NT ratio and tumor uptake to dose of 5F11-scFv-DA. T/NT ratios across all organs in Table 1 were normalized using mean and variance across four 5F11-scFv-SA dose levels. Mean ± SEM of normalized T/NT ratio (⋄) of critical organs (brain, blood, heart, liver, lung, kidney, spleen, and small intestines) were plotted against 5F11-scFv-SA dose. Average tumor uptake (%ID/g ± 1 SEM; ▪) was also plotted for comparison. Normalized T/NT ratio at 900-μg dose was significantly different (P < 0.05) from those at 300- and 100-μg doses.
- FIGURE 2.
Scintigraphic studies of 5F11-scFv-SA MST. Athymic mice xenografted with NB LAN-1 cells were imaged after dosing with 900 μg 5F11-scFv-SA, 450 μg of sCA, and ∼2.5 μg of 111In-DOTA-biotin. γ-Imaging was performed 2 and 24 h after 111In-DOTA-biotin injection. Maximal tumor diameters averaged 9 ± 1 mm.
- FIGURE 3.
Comparison of blood vs. tumor decay in MST. Athymic mice (5 mice per group) with xenografted NB LAN-1 were injected with standard dose of 900 μg 5F11-scFv-SA, 450 μg of sCA, and ∼2.5 μg of 111In-DOTA-biotin. %ID/g for blood (•) and tumor (○) was calculated, showing a remarkable differential rapidly achieved within first 12 h after 111In-DOTA-biotin injection.
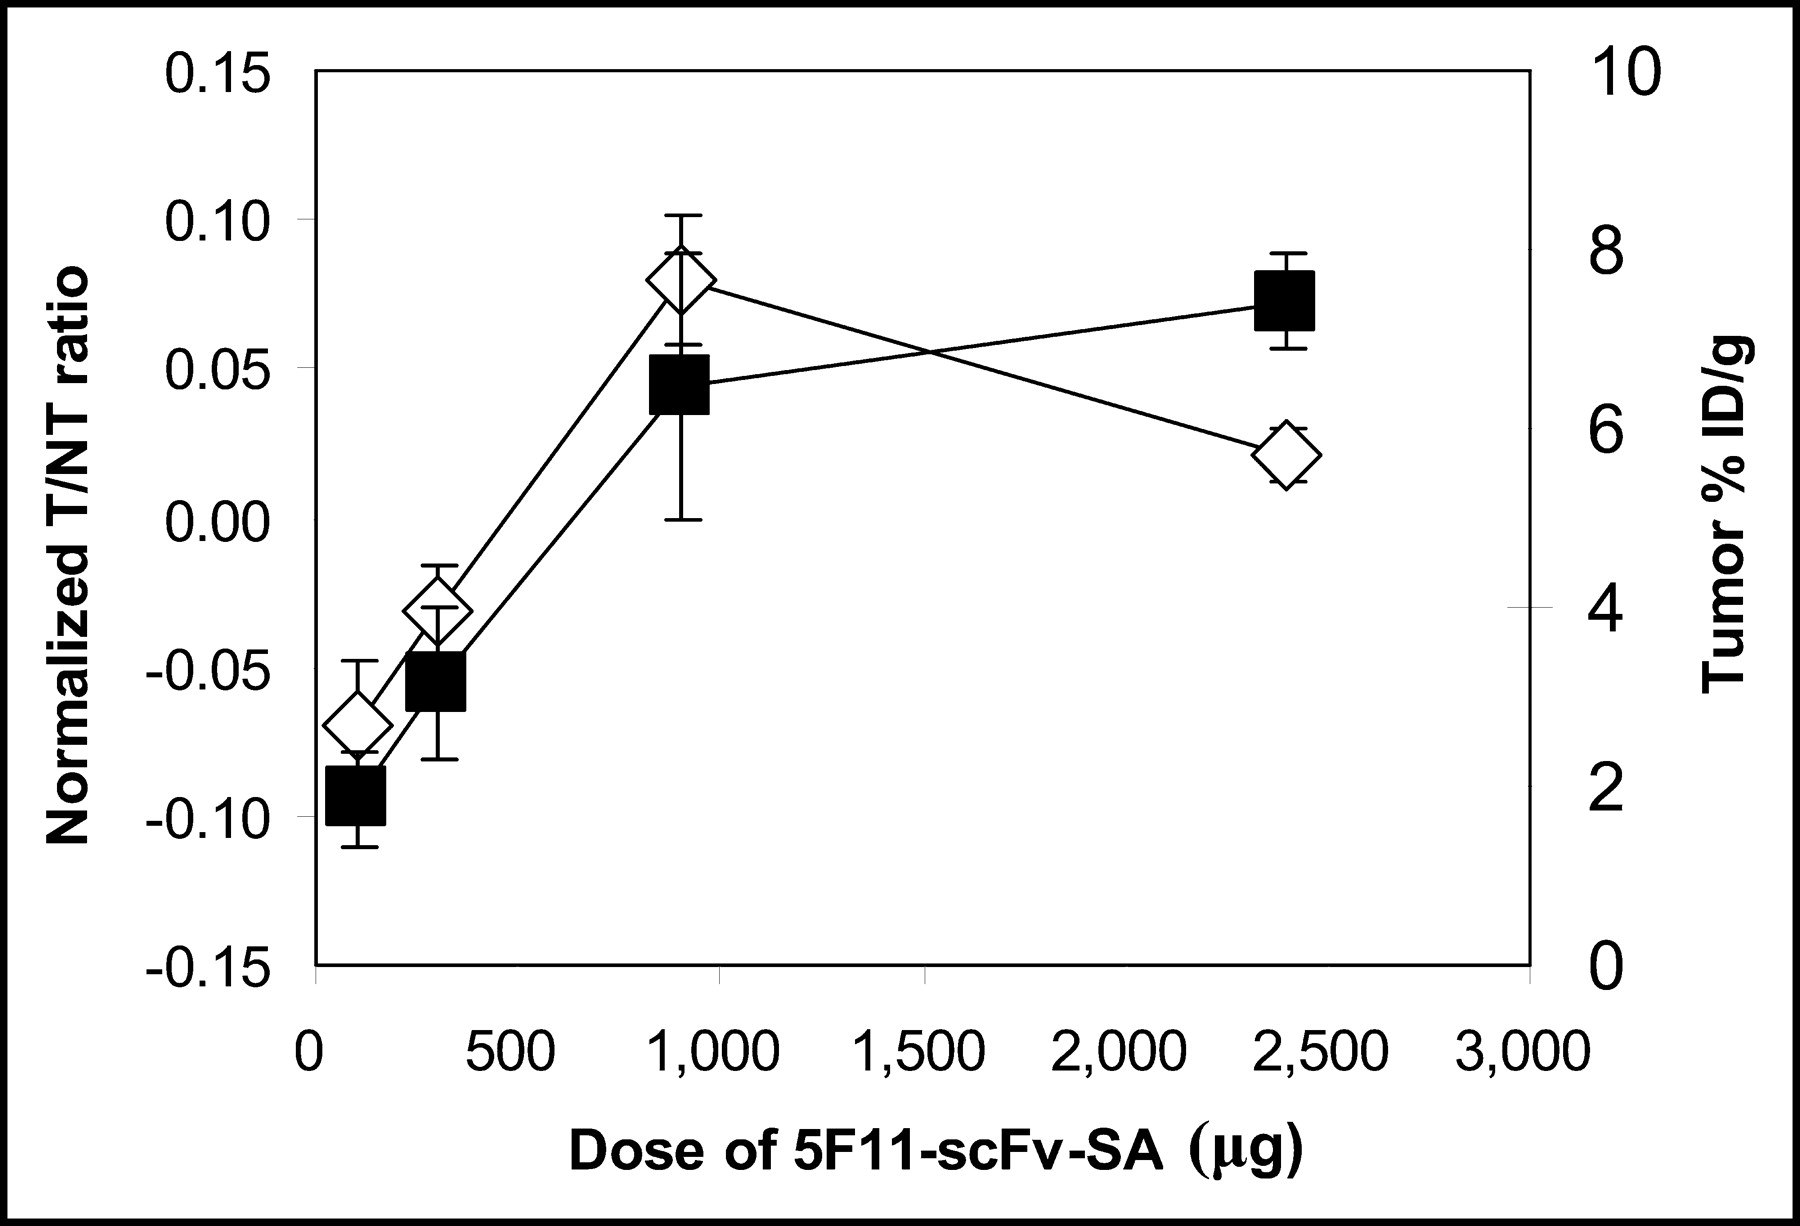
- FIGURE 4.
5F11-scFv-SA MST to target peptides and proteins. MST was performed in LAN-1 xenografted athymic nude mice. Instead of 111In-DOTA-biotin, 125I-labeled biotinylated BSA or 125I-labeled biotinylated peptides (VIP and PHI) were administered. Mice were then imaged at 24 and 48 h after injection. Only for the BSA group was there enough retention of radioactivity in tumor at 120 h to allow scintigraphy. No selective tumor uptake was found in biodistribution when radiolabeled BSA, VIP, and PHI were administered alone without MST.


Tables
scFv-SA Biotinylated ligand %ID/g Half-life* (h) 30 min 20 h t1/2 α t1/2 β 125I-5F11-scFv-SA — 34.9 5.5 0.2 ± 0.1 9.3 ± 0.7 125I-B9F9-scFv-SA — 47.6 12.2 0.7 ± 0.1 13.4 ± 1.0 125I-CC49-scFv-SA — 35.2 10.1 0.4 ± 0.1 14.0 ± 0.9 5F11-scFv-SA 300 μg 111In-Biotin-DOTA 0.7 0.02 0.1 ± 0.01 4.6 ± 3.2 900 μg 111In-Biotin-DOTA 1 0.02 0.14 ± 0.01 3.8 ± 0.7 ↵* Mean ± SEM.
Blood clearance studies were carried out in tumor-free nude mice. Half-lives were calculated for the respective radiolabeled ligand using Origin 6.0 software (Microcal Software).
Tissue Dose of 5F11-scFv-SA (μg) 100 300 900 2,400 Adrenal 19.7 ± 5.5 65.3 ± 20.3 124.6 ± 20.9 193.1 ± 7.1 Bladder 22.8 ± 4.3 29.1 ± 3.8 145.2 ± 44.4 92.1 ± 7.6 Blood 139.4 ± 30.3 160.9 ± 17.3 1,121.3 ± 306 621.4 ± 61.5 Brain 170.9 ± 12.6 503 ± 100.6 1187 ± 268 901.6 ± 157.4 Femur 67.3 ± 11 169.4 ± 27.1 405.2 ± 38.1 288.8 ± 41.9 Heart 34.3 ± 4 110.8 ± 13.3 265 ± 30.9 269.7 ± 11 Kidney 1.1 ± 0.3 2.7 ± 0.6 10.6 ± 2.9 7.1 ± 0.2 Large intestine 3.7 ± 1 17.4 ± 3.9 15.9 ± 3.2 10.2 ± 1.7 Liver 10 ± 1.6 18.5 ± 2.6 50.3 ± 11.9 37 ± 1.5 Lung 19.8 ± 3.1 21.8 ± 3.4 62.8 ± 21.5 23.1 ± 2.3 Muscle 35.8 ± 6.1 160.7 ± 22.9 467 ± 61.4 429 ± 39 Skin 13.3 ± 1.9 23.6 ± 4.4 51.4 ± 3.9 56.6 ± 8.3 Small intestine 37.4 ± 7 66 ± 9.2 135.6 ± 33.1 114.3 ± 24.9 Spine 49.2 ± 5.9 130.8 ± 20 425.4 ± 58.8 338.6 ± 27.2 Spleen 14.8 ± 2.2 30.8 ± 4.1 118.2 ± 12.3 120.2 ± 5.8 Stomach 48.2 ± 14.9 94.7 ± 12.4 181.7 ± 30.7 70.6 ± 5.2 Tumor %ID/g 1.9 ± 0.5 3.1 ± 0.9 6.5 ± 1.5 7.4 ± 0.5 T/NT ratio was calculated as follows: (%ID/g in tumor)/(%ID/g in tissue). Athymic nude mice xenografted with established human NB LAN-1 (0.5- to 0.8-cm diameter) were injected intravenously with 5F11-SA, followed in 24 h by intravenous injection of sCA biotin-LC-NM-(Gal-NAc)16, and then 4 h later injected intravenously with ∼2.5 μg 111In-DOTA-biotin. Mice were killed 24 h after 111In-DOTA-biotin for biodistribution studies. Four dose levels of 5F11-SA were tested: 100, 300, 900, and 2,400 μg (n = 5 mice per group). Dose of sCA was 50% (weight ratio) of 5F11-scFv-SA dose. T/NT ratio was summarized for each organ as arithmetic mean ± SEM.
Tissue Dose of sCA (μg) 15 75 300 450 900 Adrenal 32.1 ± 15.1 70.4 ± 18.3 97.3 ± 20.5 110.1 ± 21.2 183.7 ± 28.3 Bladder 34.8 ± 15.6 70.7 ± 24.6 56.7 ± 11.7 155.3 ± 54.5 159.5 ± 48.7 Blood 71.8 ± 43.3 277.1 ± 74.5 263.1 ± 75.2 1,040.2 ± 348.6 629 ± 177 Brain 427 ± 210.8 307.7 ± 70.9 807.9 ± 436.8 1,074.4 ± 362.8 860.5 ± 657.3 Femur 113.4 ± 78.4 344 ± 121.7 174.8 ± 34.4 394.6 ± 49.8 353.1 ± 49.5 Heart 78.9 ± 41.9 147.7 ± 25.1 201.7 ± 51.3 273.6 ± 55.7 208.2 ± 20.7 Kidney 1.3 ± 0.3 4 ± 0.8 3.6 ± 0.7 8 ± 2.9 6.8 ± 1 Large intestine 20 ± 8.3 24.1 ± 7.9 21.4 ± 7.4 13.2 ± 3.3 47.4 ± 19 Liver 18.6 ± 10 25.7 ± 4.4 32.3 ± 9.1 48.8 ± 14.7 32.6 ± 5.6 Lung 15.8 ± 8.9 19.5 ± 5.4 25.1 ± 4.7 43.5 ± 21.5 63.2 ± 23.4 Muscle 112.6 ± 53.3 153.7 ± 30.2 203.8 ± 59.8 432.8 ± 59.1 537.7 ± 104.4 Skin 19.1 ± 8.3 26.3 ± 8.6 40.7 ± 11.3 48.3 ± 4.7 58.9 ± 13.5 Small intestine 99.2 ± 52.3 130.4 ± 31.5 143.5 ± 37.8 166.3 ± 44.6 209.6 ± 51.4 Spine 71.2 ± 46.7 216.9 ± 58 221.3 ± 47 452.4 ± 86.4 371.8 ± 27.6 Spleen 18.9 ± 7.9 81.4 ± 15.8 98.4 ± 22.2 117.7 ± 21.2 130.3 ± 13 Stomach 38.4 ± 17.2 61.1 ± 9.5 173.1 ± 55.7 176.5 ± 39 260.7 ± 28.5 Tumor %ID/g 7.9 ± 2.4 6 ± 1.3 4.8 ± 0.9 6 ± 0.7 6.3 ± 3.2 T/NT ratio was calculated as follows: (%ID/g in tumor)/(%ID/g in tissue). Athymic nude mice xenografted with established human NB LAN-1 (0.5- to 0.8-cm diameter) were injected intravenously with 5F11-SA, followed in 24 h by intravenous injection of sCA biotin-LC-NM-(Gal-NAc)16, and then 3 h later injected intravenously with ∼2.5 μg 111In-DOTA-biotin. Fixed dose of 900 μg of 5F11-scFv-SA was used at 5 doses of sCA (n = 4–8 mice per group). Mice were killed 24 h after 111In-DOTA-biotin for biodistribution studies. T/NT ratio was summarized for each organ as arithmetic mean ± SEM.
Organ Time after injection of 111In-DOTA-biotin (h) 2 5 19 30 52 72 144 Adrenal 34.6 ± 7.6 45.6 ± 20.2 50.8 ± 6.7 73.6 ± 24 172.9 ± 90.8 84.6 ± 30.3 69.4 ± 12.4 Bladder 32.3 ± 7.1 30.9 ± 9.5 74.2 ± 19.1 96.9 ± 42.3 75.9 ± 20.4 49.8 ± 16.1 39.5 ± 8.4 Blood 38 ± 8.8 60.8 ± 11.6 309.1 ± 53.6 442.3 ± 37.1 888.3 ± 242 1,661 ± 765.5 28,002 ± 12,082 Brain 106.4 ± 33.7 134.8 ± 44.2 490.6 ± 187.2 929.4 ± 745.9 378.9 ± 66.1 181.2 ± 69 460.2 ± 298.5 Femur 117.2 ± 20.3 254.7 ± 74.1 255.7 ± 59.7 221.1 ± 30.6 249.2 ± 39.6 171.9 ± 27.6 96.9 ± 16.7 Heart 94.5 ± 18.9 119.6 ± 26 183.7 ± 34.8 190.2 ± 41.4 111.6 ± 19 173.4 ± 25.3 66.6 ± 10.8 Kidney 6.7 ± 1.5 6.1 ± 1.6 5.8 ± 1.5 5.3 ± 2.5 4.2 ± 0.7 3.5 ± 0.4 2.4 ± 0.6 Large intestine 5.8 ± 2.1 3.3 ± 1 26.1 ± 6.3 31.4 ± 11.3 44.7 ± 6.8 60.7 ± 13.7 57.5 ± 14.9 Liver 28.3 ± 4.7 26.5 ± 6.1 34.5 ± 9.3 36.6 ± 10.5 30.9 ± 5.2 15.9 ± 3 13.2 ± 2.7 Lung 20.3 ± 2.5 20 ± 4.5 37.5 ± 7.2 41.5 ± 12.2 36.7 ± 5.3 23.2 ± 5.1 36 ± 8.2 Muscle 135.4 ± 34.5 180.3 ± 53.4 255 ± 56.1 224.7 ± 44.7 302.4 ± 53.4 208.8 ± 42.1 125.8 ± 33.8 Skin 32.2 ± 10.2 38.5 ± 7 68.2 ± 7.6 72.6 ± 5.7 34.4 ± 4 26.2 ± 4.3 24.4 ± 4.5 Small intestine 40.9 ± 11.8 34.5 ± 10.4 152.1 ± 37.8 196.7 ± 47.2 286.2 ± 66.8 216.4 ± 55.8 136.6 ± 20.6 Spine 129.2 ± 26.8 169.7 ± 37.4 182.5 ± 43.2 131.5 ± 20.4 372 ± 58.6 241.9 ± 23.4 109.9 ± 28.6 Spleen 79.2 ± 14.6 83.1 ± 18.7 92.4 ± 23.2 71.5 ± 14.6 63.2 ± 15 101.3 ± 22.9 16.6 ± 4.1 Stomach 65.4 ± 13.2 90.2 ± 22.3 139.5 ± 24.8 106.4 ± 37.3 159.4 ± 25.3 110.8 ± 30.7 93.3 ± 18.5 T/NT ratio was calculated as follows: (%ID/g in tumor)/(%ID/g in tissue). Athymic mice with xenografted NB LAN-1 were injected with standard dose of 900 μg of 5F11-scFv-SA, 450 μg of sCA, and ∼2.5 μg of 111In-DOTA-biotin. Blood samples were obtained for kinetic studies. At 2, 19, 52, 104, and 144 h, groups of mice (n = 5) were killed and their organ radioactivity was measured. %ID/g for blood and various organs was calculated and T/NT ratio from 2 to 144 h after 111In-DOTA-biotin injection was presented for each organ as arithmetic mean ± SEM.
- TABLE 5
Absorbed Radiation Dose (cGy/MBq) Assuming Complete Local β-Ray Absorption or Using Equal Spheric Organ Mass Assumption
Tissue Model 1: assuming complete local β-ray absorption Model 2: using equal spheric organ mass assumption 90Y-DOTA-biotin 5F11-scFv-SA (μg) 131I-3F8 90Y-DOTA-biotin 5F11-scFv-SA (μg) 300 900 300 900 Bladder 1.9 ± 0.3 4.1 ± 0.6 8.5 ± 1.8 0.4 ± 0.1 0.8 ± 0.1 Blood 1.3 ± 0.6 0.9 ± 0.6 89.2 ± 37.2 NA NA Bone 0.9 ± 0.0 1.1 ± 0.2 8.7 ± 1.4 NA NA Brain 0.8 ± 0.2 0.9 ± 0.1 3.1 ± 1.3 0.5 ± 0.1 0.5 ± 0.0 Heart 1.2 ± 0.2 1.4 ± 0.2 23.6 ± 2.1 0.6 ± 0.1 0.8 ± 0.1 Kidney 30.6 ± 4.8 50.4 ± 6.7 18.0 ± 3.1 16.1 ± 2.5 26.5 ± 3.5 Large intestine 4.5 ± 0.5 14.6 ± 2.2 7.1 ± 1.1 3.4 ± 0.3 10.8 ± 1.6 Liver 5.1 ± 0.7 7.2 ± 0.2 12.4 ± 2.4 3.9 ± 0.5 5.6 ± 0.2 Lung 3.2 ± 1.4 5.2 ± 1.0 28.6 ± 3.4 1.6 ± 0.7 2.7 ± 0.5 Small intestine 1.1 ± 0.3 1.8 ± 0.6 10.7 ± 0.2 0.9 ± 0.2 1.4 ± 0.5 Spleen 2.1 ± 0.2 2.3 ± 0.2 17.9 ± 1.3 1.1 ± 0.1 1.2 ± 0.1 Stomach 1.5 ± 0.3 1.4 ± 0.2 10.2 ± 6.0 0.8 ± 0.1 0.7 ± 0.1 Tumor 77.0 ± 11.2 153.1 ± 8.3 237.4 ± 40.4 64.5 ± 9.4 128.1 ± 7.0 NA = organ masses were not available for these calculations.
Absorbed radiation dose was calculated and is presented as mean ± SD. Model 1 assumes complete local β-ray absorption: Bladder absorbed dose was calculated without using dynamic bladder model. For walled organs (bladder, large intestine, small intestine, stomach), absorbed dose was calculated based on cpm of organs containing their respective contents. Model 2 uses spheric organ mass assumption: For 131I, there was nearly complete local absorption of β-radiation and correction was not necessary.
Tissue GD2-negative cell line GD2-positive murine cell line GD2-positive human cell line H H H M H M M M H H H Colo205 Daudi HTB82 B16 Mean ± SEM* MOLT-4 B16D14 B16D14Kb B16D14KbKd Mean ± SEM* SK-N-LP SK-N-JD LAN-1 Mean ± SEM* Adrenal 7 1 5 4 4.1 ± 1.4 3 24 11 28 16.4 ± 5.8 245 91 74 136.7 ± 54.5 Bladder 10 1 3 2 4.1 ± 2.0 3 10 2 22 9.2 ± 4.5 162 85 97 114.4 ± 24.0 Blood 6 11 72 28 29.2 ± 14.9 30 169 33 190 105.4 ± 43.1 667 701 442 603.6 ± 81.3 Brain 59 37 43 64 50.7 ± 6.4 66 294 100 427 222.0 ± 85.0 541 1,919 929 1,129.9 ± 410.4 Femur 9 4 18 7 9.6 ± 3.0 7 38 14 52 27.9 ± 10.6 342 741 221 434.9 ± 157.1 Heart 7 2 8 6 5.6 ± 1.4 8 23 8 30 17.5 ± 5.7 231 244 190 221.6 ± 16.2 Kidney 0 0 0 0 0.2 ± 0.1 0 1 0 1 0.5 ± 0.2 5 6 5 5.2 ± 0.3 Large intestine 0 1 1 0 0.9 ± 0.3 0 2 0 2 1.3 ± 0.6 15 12 31 19.4 ± 6.1 Liver 1 0 1 1 1.2 ± 0.3 2 7 3 6 4.3 ± 1.3 59 37 37 44.4 ± 7.5 Lung 2 1 1 1 1.3 ± 0.4 1 3 2 6 3.2 ± 1.1 29 73 41 48 ± 13.3 Muscle 12 6 16 14 11.8 ± 2.3 8 40 16 80 35.9 ± 16.2 451 425 225 366.9 ± 71.5 Skin 1 1 4 2 2.0 ± 0.8 1 7 3 21 8.2 ± 4.7 32 72 73 59.1 ± 13.5 Small intestine 4 3 7 5 4.8 ± 0.9 2 16 2 45 16.2 ± 10.3 174 243 197 204.6 ± 20.1 Spine 10 4 19 9 10.5 ± 3.1 10 36 15 45 26.6 ± 8.4 330 376 131 279.3 ± 75.2 Spleen 3 1 3 2 2.2 ± 0.4 3 10 4 15 8.1 ± 2.9 174 120 71 122 ± 29.7 Stomach 3 3 21 3 7.7 ± 4.4 7 20 5 42 18.6 ± 8.5 109 197 784 363.4 ± 211.6 GD2 (%LAN-1)† 2 4 3 4 3.3 ± 0.5 17 22 32 12 20.8 ± 4.3 289 77 100 155.4 ± 67.2 ↵* Mean ± SEM = arithmetic mean ± SEM across cell lines in each tumor group.
↵† GD2 (% LAN-1) = relative mean fluorescence, indirect fluorescent staining with anti-GD2 antibody 3F8. It is calculated as mean fluorescence channel of cell line divided by mean fluorescence channel of NB cell line LAN-1.
H = human, M = murine.
Mice (n = 4 or 5 per group) xenografted with GD2-negative human lymphoma (Daudi), leukemia (MOLT-4), colon carcinoma (Colo205), rhabdomyosarcoma (HTB82), and GD2-positive NB (SK-N-LP, SK-N-JD, LAN-1) as well as C57Bl/6 mice autografted with GD2-negative melanoma (B16), and GD2-positive melanomas (B16D14, B16D14Kb, B16D14KbKd) were studied using 900 μg of 5F11-scFv-SA, 450 μg of sCA, and ∼2.5 μg of 111In-DOTA-biotin. At 20–28 h, mice were killed and their organ radioactivity was measured. %ID/g for blood and various organs was calculated and T/NT ratio was presented for each organ.
Tissue VIP PHI BSA MST None MST None MST None Adrenal 24.5 ± 8.2 4 ± 0.8 87.5 ± 11.6 3.8 ± 1.7 26.8 ± 7.8 1.3 ± 0.2 Bladder 31.5 ± 6.6 2.4 ± 0.9 53.9 ± 20 2.4 ± 0.9 36.5 ± 5.2 2.1 ± 0.8 Blood 26.6 ± 3.3 1.7 ± 0.2 32 ± 4.9 2.1 ± 0.9 10.8 ± 0.9 0.7 ± 0.1 Brain 209 ± 42.8 13.4 ± 4.6 251 ± 26.6 14.5 ± 6.9 101 ± 7.9 13.4 ± 2.2 Femur 39.9 ± 6.1 3.4 ± 0.3 71.5 ± 6.7 5.1 ± 2.7 59.4 ± 23.2 4.9 ± 2.4 Heart 36.5 ± 4.7 2.5 ± 0.2 58.4 ± 3.5 3.6 ± 1.5 16.7 ± 1.5 1.6 ± 0.3 Kidney 1.1 ± 0.2 0.1 ± 0 3.6 ± 1.1 0.1 ± 0 11.8 ± 0.9 1.2 ± 0.2 Large intestine 6.5 ± 0.5 0.6 ± 0.2 5 ± 0.9 0.7 ± 0.6 9.3 ± 1.8 0.7 ± 0.2 Liver 6.9 ± 1.1 0.5 ± 0.1 13.8 ± 2.5 0.6 ± 0.2 5.7 ± 0.7 0.8 ± 0.2 Lung 9.1 ± 1.4 0.7 ± 0.3 17.9 ± 4.4 0.8 ± 0.3 9.6 ± 0.7 0.6 ± 0.1 Muscle 83.3 ± 10.3 6.1 ± 1.2 96.1 ± 13 6.1 ± 2.5 75.6 ± 11.4 5 ± 1.1 Skin 9.8 ± 1 1.3 ± 0.7 14.8 ± 2 1.4 ± 0.7 20.8 ± 4.1 1.7 ± 0.4 Small intestine 33.4 ± 4.6 2.7 ± 0.2 47 ± 7.6 2.8 ± 1.1 25.7 ± 6.4 1.8 ± 0.4 Spine 56 ± 9.2 2.9 ± 0.2 79.5 ± 7 6.3 ± 3.2 30.5 ± 1.9 2.3 ± 0.3 Spleen 9.8 ± 1.9 1.2 ± 0.2 37.4 ± 8.3 2.6 ± 1.3 5 ± 0.7 2.1 ± 0.5 Stomach 4.7 ± 1 0.4 ± 0.2 5.3 ± 1.4 0.8 ± 0.4 8.8 ± 3 0.5 ± 0.2 T/NT ratio was calculated as follows: (%ID/g in tumor)/(%ID/g in tissue). Athymic mice (n = 5–10 per group) with xenografted NB LAN-1 were injected with standard dose of 900 μg of 5F11-scFv-SA, 450 μg of sCA, and 125I-labeled VIP, PHI, or BSA. Blood samples were obtained for kinetic studies. At 48 h, mice were killed and their organ radioactivity was measured. %ID/g for blood and various organs was calculated and T/NT ratio was expressed as mean ± SEM.
In this issue


Jump to section
Related Articles
Cited By...
- Pretargeting: A Path Forward for Radioimmunotherapy
- A Self-Assembling and Disassembling (SADA) Bispecific Antibody (BsAb) Platform for Curative Two-step Pretargeted Radioimmunotherapy
- Immunotherapy of Pediatric Solid Tumors: Treatments at a Crossroads, with an Emphasis on Antibodies
- Preclinical Evaluation of Multistep Targeting of Diasialoganglioside GD2 Using an IgG-scFv Bispecific Antibody with High Affinity for GD2 and DOTA Metal Complex
- Reducing Epitope Spread during Affinity Maturation of an Anti-Ganglioside GD2 Antibody
- A Pharmacokinetic Model for Radioimmunotherapy Delivered Through Cerebrospinal Fluid for the Treatment of Leptomeningeal Metastases
- Improved Therapeutic Results by Pretargeted Radioimmunotherapy of Non-Hodgkin's Lymphoma with a New Recombinant, Trivalent, Anti-CD20, Bispecific Antibody
- Antibody Pretargeting Advances Cancer Radioimmunodetection and Radioimmunotherapy
- Pretargeted Radioimmunotherapy with a Single-Chain Antibody/Streptavidin Construct and Radiolabeled DOTA-Biotin: Strategies for Reduction of the Renal Dose
- Intraperitoneal Pretarget Radioimmunotherapy with CC49 Fusion Protein
- Antibody-Based Targeted Radiation to Pediatric Tumors