


Abstract
Radioimmunotherapy can effectively treat leptomeningeal metastases when radiolabeled antibodies are administered into the cerebrospinal fluid (CSF). We developed a pharmacokinetic model to evaluate the role of kinetic and transport parameters of radioimmunotherapy in maximizing the therapeutic ratio, the ratio of the area under the curve for the concentration of the bound antibodies versus time (AUC[CIAR]), to that for unbound antibodies (AUC[CIA]). Methods: We simplified the CSF space as a single compartment and considered the binding of antibodies to antigens on tumor cells lining the surface of the CSF space. Mass conservation was applied to set up the equations for CIAR, CIA, and other pharmacokinetic variables. A Runge–Kutta method was used to solve the equations. Results: This model agreed with the measured data in 10 of 14 patients in the phase I trial of intra-Ommaya radioimmunotherapy using 131I-3F8. Using this model, we predicted that increasing the affinity of antibodies to antigens greatly increases AUC(CIAR) but not AUC(CIA); for the same amount of isotope administered, the smaller antibody dose and the higher specific activity improves therapeutic ratio. When the isotope half-life (t1/2-I) was 0.77 h, increasing the antibody association constant enhanced AUC(CIAR) much more than did decreasing the dissociation constant, even if overall affinity was unchanged. When t1/2-I reached 240 h, decreasing the dissociation constant would slightly enhance AUC(CIAR). Other predictions were that decreasing the CSF bulk flow rate would increase AUC(CIAR), with 3 mL/h being optimal; at the same amount of antibody administered by continuous infusion and by split administrations, compared with that by the single bolus administration, one could improve AUC(CIAR) by up to 1.8- and 1.7-fold, respectively; and for an antibody affinity of 10−8 M, increasing t1/2-I from 0.77 up to 64 h could greatly enhance the therapeutic ratio. Conclusion: The strong agreement between model predictions and patient data supports the validity of the assumptions and simplifications in our model. The predictions using this model are not intuitive and need to be validated in future clinical trials. The improved therapeutic ratio by optimized kinetic and transport parameters may enhance the clinical efficacy of this new treatment modality.
Tumor cells can invade the cerebrospinal fluid (CSF) and disseminate throughout the neuroaxis by the constant flow of CSF, which travels from the ventricles to the spinal canal and over the cortical convexities. The involvement of the leptomeninges by any cancer is a serious complication with significant morbidity and mortality (1–3). Its frequency is increasing as patients live longer and as neuroimaging modalities improve, approaching 5% in solid tumors such as breast cancer and lung cancer (2). Leptomeninges disease is most common in patients with disseminated systemic disease (4,5) and is the initial manifestation in 5%−10% of patients (6). Concurrent parenchymal brain metastases are not uncommon (11%−31% of patients) (5,7). Historically, the incidence of leptomeninges metastasis was often underestimated because tumors were not apparent to gross inspection at autopsy and because leptomeninges seeding could be focal (e.g., spinal only) (8), microscopic, and clinically subtle (9).
Neuroblastoma is the most common extracranial tumor of the sympathetic nervous system, occurring predominantly in early childhood and accounting for 6.7% of childhood cancer. With increasing periods of remission, CNS metastasis (both parenchymal and leptomeninges)—though rare formerly (10)—has substantially increased in the past decade. Antibody-based radioimmunotherapy administered through the CSF has clinical potential in the treatment of cancers metastatic to the leptomeninges or brain. 131I-labeled monoclonal antibodies (mAbs) targeting GD2 (e.g., mAb 3F8) or B7H3 (e.g., mAb 8H9), when administered through an Ommaya reservoir, have proven safe in phase I clinical trials (11). Patients with relapsed neuroblastoma in the CNS (brain or leptomeninges), when treated with salvage regimens containing either intra-Ommaya 131I-3F8 or 131I-8H9, have survived for extended periods. Given the unique physiology of the CSF compartment and the well-defined kinetic or radiochemical properties of mAbs, radioimmunotherapy delivered through the CSF can be optimized.
The CSF is secreted mainly by the choroid plexus in the walls of the lateral ventricles and flows constantly and unidirectionally from the lateral ventricles through the interventricular foramina into the third then fourth ventricles, and finally into subarachnoid space before draining into lymphatics and veins (12). Although the barrier between the blood and the normal brain tissue is tight, antibodies can penetrate abnormal tumor vessels and enter into tumor tissue, even when it is in the brain. In addition, even though antibody penetration into CSF is hampered by tight junctions in the blood–CSF barrier (13), the transfer of antibodies between the CSF in the subarachnoid space and the meninges and in the ependyma-lined lateral ventricles (brain–CSF interface) is relatively free (12). Because of these unique features, CSF is highly suitable for radioimmunotherapy on metastatic tumors to the leptomeninges. CSF compartmental radioimmunotherapy (cRIT) avoids systemic toxicity (e.g., myelosuppression) and neutralization of radiolabeled mAb by human serum antibodies.
Although radioimmunotherapy through CSF administration has been used to treat metastatic tumors to the CNS (14–16), a quantitative pharmacokinetic model is unavailable to predict the optimal conditions for radioimmunotherapy delivered through the CSF. Over the last few decades, a series of models has been developed for the distribution of antibodies in humans and other animals (17–19). Unfortunately, all of these models considered only intravenous administration and did not take account of the effect of isotope decay.
An optimization model will help explain the complex dynamics of antibody and radiation dose delivered to tumor cells and to the normal brain and provide a tool to define the critical parameters to improve effectiveness and safety of 131I-mAb radioimmunotherapy administered through the CSF. In addition, because different isotopes have distinct microdosimetric properties, their biologic effect in CSF radioimmunotherapy can be simulated and compared. These critical parameters of CSF dynamics and mAb pharmacokinetics can be manipulated by pharmacologic interventions and genetic engineering, respectively, and be tested in vivo using rats or mice with leptomeninges xenografts. The long-term plan is to bring these concepts to human phase I and II studies.
cRIT using radioiodinated mAbs administered intrathecally results in favorable CSF–to–blood activity concentrations and radiation dose ratios and may be useful in the treatment of leptomeninges disease (20–22). For example, cRIT using 131I-labeled murine antitenascin mAbs in patients with malignant glioma was feasible and well tolerated and improved survival (23–26).
We now report a pharmacokinetic model for the intraventricular (intra-Ommaya) administration of radiolabeled antibodies. As a first validation, we note that model predictions agreed almost perfectly with patient pharmacokinetic data from a phase I clinical study in which patients with metastatic neuroblastoma were treated with CSF radioimmunotherapy (11). For optimization of CSF radioimmunotherapy, we define thetherapeutic ratio by dividing the area under the curve for CSF concentration versus time of the bound antibodies by that for the unbound antibodies. This model was used to evaluate the role of antibody association or dissociation rate constants, the antigen concentration, the specific activity of radiolabeled antibody, the dose of injected antibodies, the administration schedule, the half-life of the isotope, and the CSF bulk flow rate (CLCSF).
MATERIALS AND METHODS
Pharmacokinetic Model for the CSF Delivery
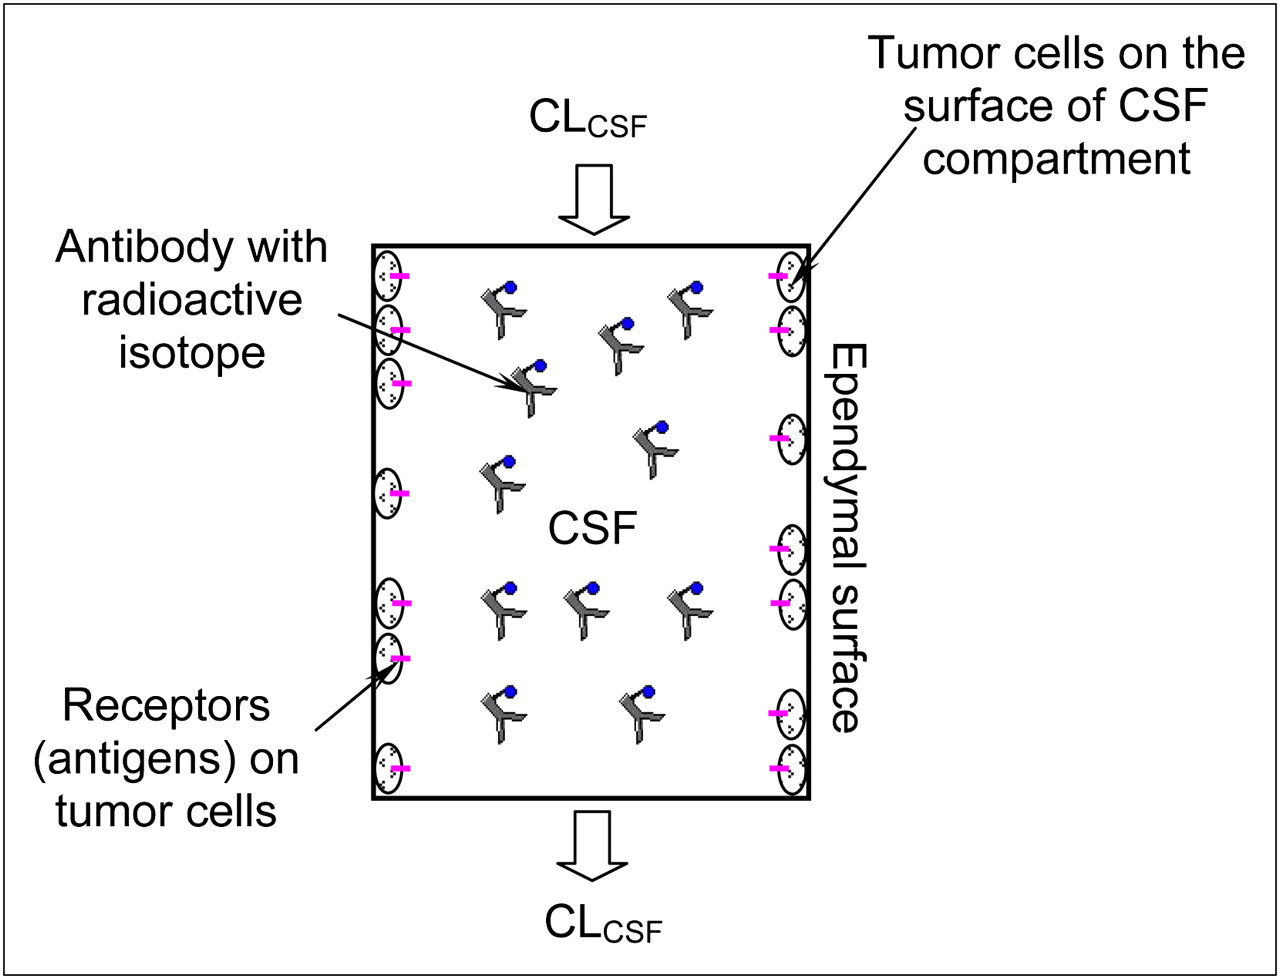
Figure 1 describes our model for the radioimmunotherapy through CSF administration. Because few free-floating tumor cells are found in the CSF (11), they are assumed to be attached to the surface of the CSF space, next to the arachnoid and the surface of either the brain or the spinal cord. Antibodies loaded with radioactive isotopes are administered intraventricularly and carried by the CSF flow to the entire CSF surface space. Usually these antibodies are macromolecules that do not travel across the tight junctions between the brain endothelial cells and choroid plexus epithelial cells, which form the blood–brain and blood–CSF barriers (12,13). Previous studies also showed that most antibodies used in radioimmunotherapies do not penetrate more than a few millimeters (10−3 m) from the CSF into the brain tissue (27,28). Therefore, the binding of antibodies to tumor cells occurs only at the surface of the CSF space or at the brain–CSF interface. On the basis of these observations and assumptions, we developed a pharmacokinetic model for radioimmunotherapy through CSF administration (supplemental materials, which are available online only at http://jnm.snmjournals.org).

Schematic of our pharmacokinetic model for radioimmunotherapy through CSF administration. CSF space was simplified as compartment of volume V with surface area S. Radioactive isotope–loaded antibodies are injected into CSF space and assumed to be well mixed immediately. Binding of antibodies to receptors (antigens) on tumor cells occurs at surface of CSF compartment.
Therapeutic Ratio and Optimization Criteria
The therapeutic amount of radioactive isotope–loaded antibodies is determined by the time-dependent quantity of radioactivity on bound antibodies to the antigens on tumor cells (CIAR). This amount can be represented by the area under the CIAR-versus-time curve, which is denoted as AUC(CIAR). The larger the AUC(CIAR), the bigger the radiation dose to tumor cells and the bigger the cytotoxic effect. While maximizing AUC(CIAR) to achieve therapeutic effects, the goal was to minimize bystander damage from radioactivity on free antibodies (CIA) in the CSF. This reduction of damage can be achieved if the area under the CIA-versus-time curve AUC(CIA) is minimized or the ratio of AUC(CIAR) to AUC(CIA) is maximized.
Mathematically, after obtaining CIAR(t) and CIA(t) by the numeric method described in the supplemental materials, we calculated AUC(CIAR) and AUC(CIA) by the following integrations,
AUC(CIAR) and AUC(CIA) depend on the association and dissociation rate constants ( and
and  , respectively) or the affinity of the antibody to the antigen
  , dose of the antibody administered, antibody administration schedules, tumor antigen concentrations, specific activity of the isotope, isotope half-life (t1/2-I), and CLCSF.
Time–Activity Registration
Injections of the 131I antibody were followed by pharmacokinetic studies in the CSF and blood, in compliance with the institutional review board and hospital guidelines. These procedures were performed after informed written consent for all treatments was received from guardians who understood the potential side effects of each agent and the possibility of unforeseen toxicities. CSF samples were obtained before infusion and at 5, 10, and 30 min and approximately 1, 2, 5, 24, and 48 h after infusion. CSF (10 μL) was counted in a well scintillation counter (LKB; Wallac) alongside a 131I standard. Counts per minute were entered into Excel (Microsoft) and converted to activity per gram decay-corrected to the time of administration of the dose.
Antibody Labeling
Antibodies were initially labeled with the chloramine-T method (29). Excess chloramine-T was neutralized with a 2 molar excess of sodium metabisulphite before antibody purification using a G-25 Sepharose and an anion-exchange column (GE Healthcare). Iodine was greater than 95% bound by tricarboxylic acid, and immunoreactivity was always greater than 50% by radioimmunoassay on GD2 glycolipid. The iodination method was subsequently changed to the IODO-GEN method (Pierce), in which antibody was reacted with solid-phase IODO-GEN before purification by G-25 Sepharose and anion exchange, to avoid soluble chemicals. Iodine remained greater than 95% bound by tricarboxylic acid, and immunoreactivity was always greater than 50% by radioimmunoassay on GD2 glycolipid.
Parameter Values
The CSF volume (V) was 140 mL, and its bulk flow rate (CLCSF) was 20 mL/h (12,30). The surface area of the CSF space (S) was at least 1,800 cm2 (27,31). The radioactive isotope used in the clinical trial, 131I, had a half-life of 193 h (32). The specific activity of the 131I-3F8 was 185–370 MBq/mg, and the dose injected was 370–1,480 MBq (11). The ranges of the  and
and  for 3F8 to GD2 were
  and
and  , respectively (33). All the above values are summarized in Supplemental Table 1.
For the neuroblastoma, the antigen GD2 density per cell, NR, was approximately 105–107 (34). The tumor cell density at the surface of the CSF space  was estimated as 1.91 × 10⁹ cells/mL if the tumor cell diameter DT was 10 μm and the surface of the CSF space was completely covered by 1 layer of tumor cells. If assuming other coverage percentages (f), the tumor antigen concentration (CR0 = f × CSC × NR) was estimated from 1011 to 1014 antigens/mL. The estimation for the CR0 is detailed in Supplemental Table 2.
RESULTS
Agreement Between Model Predictions and Patient Data
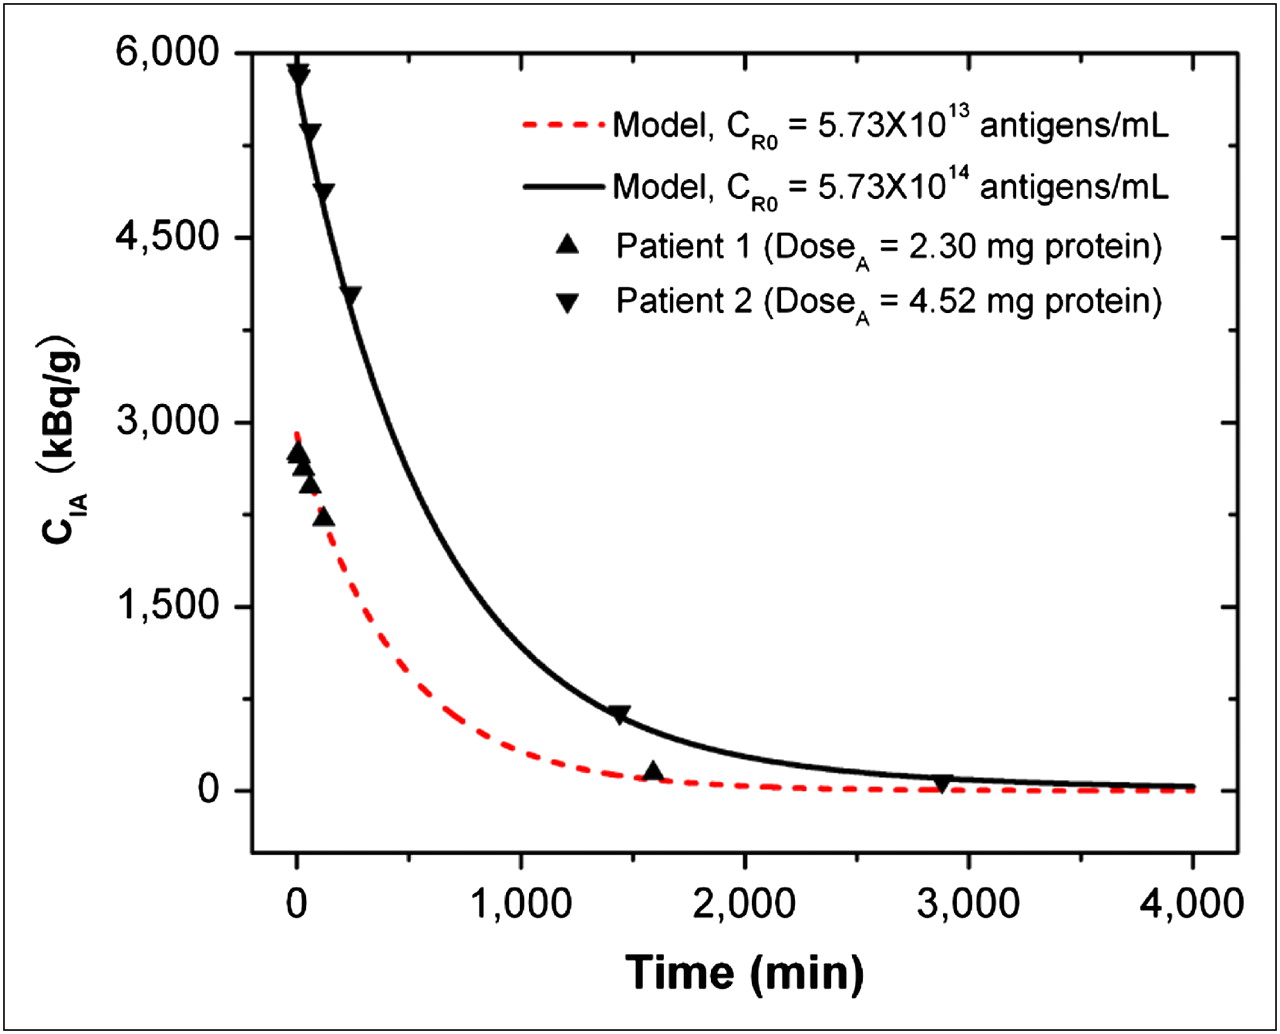
To validate our kinetic model for radioimmunotherapy through CSF delivery, we compared the model predictions with the clinical data obtained in the phase I clinical trial (11). In this study, 15 patients (14 completed the trial) received intra-Ommaya delivery of 131I-3F8 (∼370–851 MBq). The radioactivity of free antibodies CIA in the CSF was measured by serial CSF samplings obtained before infusion and at 5, 10, and 30 min and 1, 2, 5, 24, and 48 h after infusion. Our model predictions fit well with the measured data for CIA in 10 of 14 patients, whose CIA values were near the mean of the measured data. The discrepancy existed when the value of CIA was too high or too low. Figure 2 shows the agreement of our model predictions for 2 representative patients; the 1 patient who received a lower dose may have had a lower tumor antigen concentration, and another who received a higher dose may have had a higher tumor antigen concentration. Supplemental Table 3 summarizes the patient data and model predictions for all 10 patients.

Comparison of model predictions and clinical results for time-changing radioactivity of free antibodies CIA in CSF compartment. Symbols are clinical results for 2 representative patients, and curves are model predictions. CI0 was 185 MBq/mg-protein, V was 140 mL, CLCSF was 20 mL/h, Kd was 10−8 M ( ), and t1/2-I was 193 h.
Effect of kAR and k−AR Rate Constants of Antibodies to Antigens on Therapeutic Ratios
Because the binding of antibodies to antigens plays an important role in the radioactivity of bound antibodies (CIAR) and free antibodies (CIA) in the CSF, we used our model to predict this binding or dissociation effect. The predicted CIAR-versus-time and CIA-versus-time curves under various kAR and k−AR are shown in Figures 3A and 3B. In Figure 3A, CIAR increases transiently to a peak after the bolus infusion and decays gradually. The peak value and the decay rate depend on the quantity of kAR and k−AR, or the affinity  . When Kd was 10−6 M, the peak value of CIAR was low and CIAR decayed rapidly and reached equilibrium in approximately 500 min. As the affinity increased, or Kd decreased, the peak value of CIAR increased and the decay rate decreased. Figure 3B shows that CIA decayed quickly to almost zero in approximately 1,500 min after infusion. In contrast to CIAR, the decay rate and the time for reaching equilibrium of CIA were almost independent of Kd. For these reasons, the AUC(CIAR) and the AUC(CIAR)/AUC(CIA) increase with the affinity. Figure 3C summarizes the effect of Kd on AUC(CIAR) and AUC(CIAR)/AUC(CIA). To optimize the therapeutic effect of the radioimmunotherapy, we wanted to maximize AUC(CIAR) and AUC(CIAR)/AUC(CIA). Increasing the affinity of antibodies to antigens allowed us to achieve this goal. However, improvement was not uniform as Kd decreased. From 10−6 to 10−7 M, the improvement in AUC(CIAR) and AUC(CIAR)/AUC(CIA) was 7.6-fold. The improvement reduced to 4.8-, 2.7-, 2.4-, 1.5-, and 1.1-fold, respectively, as Kd decreased from 10−7 to 10−8 M, 10−8 to 10−9 M, 10−9 to 10−10 M, 10−10 to 10−11 M, and 10−11 to 10−12 M.
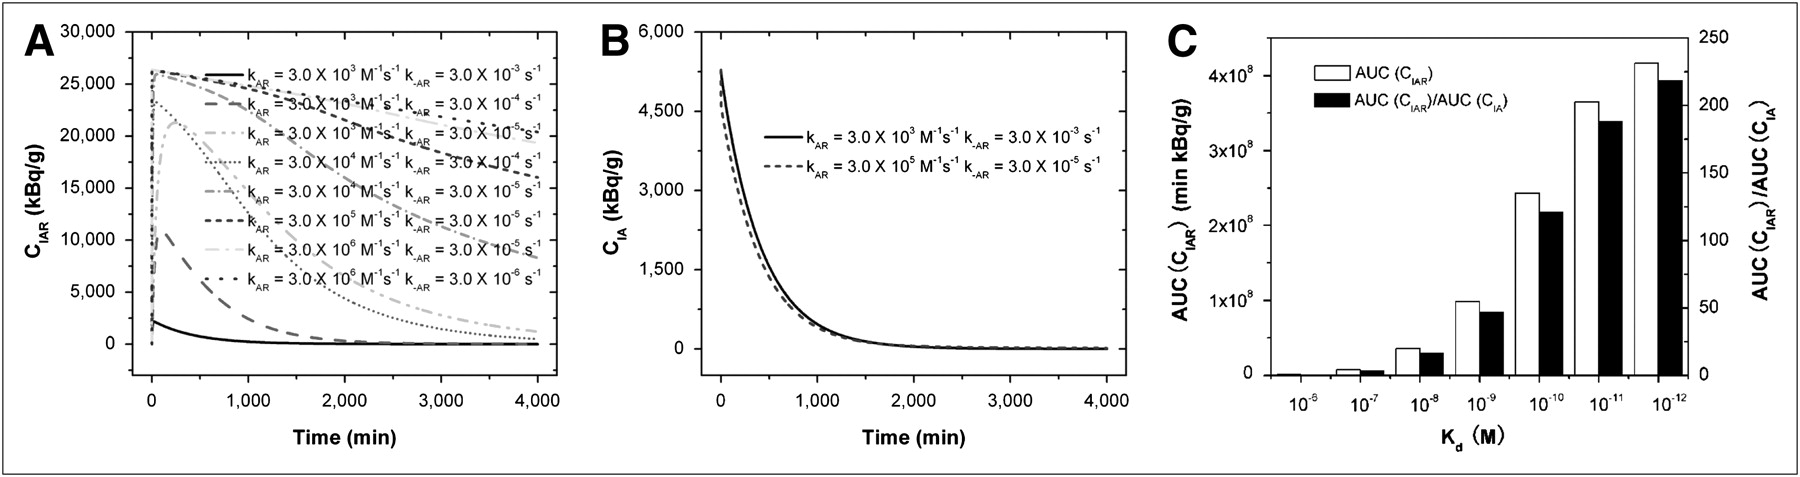
Time-changing radioactivity of bound antibodies CIAR (A) and free antibodies CIA (B) as function of kAR and k−AR rate constants of antibodies to antigens. (C) AUC(CIAR) and AUC(CIAR)/AUC(CIA). Kd equaled  , and V was 140 mL, CLCSF was 20 mL/h, tumor CR0 was 5.73 × 10¹⁴ antigens/mL, DoseA was 2 mg, CI0 was 370 MBq/mg, and t1/2-I was 193 h.
Effect of CLCSF on Therapeutic Ratio
CLCSF may change because of brain disorders (30) and can be reduced using pharmacologic inhibitors (35–38). The influence of CLCSF on AUC(CIAR) and AUC(CIAR)/AUC(CIA) predicted by our model is shown in Figure 4. Reducing CLCSF increases AUC(CIAR) and improves the therapeutic effect. However, reducing CLCSF decreases AUC(CIAR)/AUC(CIA) by increasing more in AUC(CIA). This may induce more toxicity in normal tissues. Fortunately, the decreasing rate of AUC(CIAR)/AUC(CIA) was slow, less than 3%/(mL/h) when CLCSF decreased from 20 to 3 mL/h, whereas the increasing rate of AUC(CIAR) varied, from 8.7%/(mL/h) (CLCSF from 20 to 10 mL/h) to 23.5%/(mL/h) (CLCSF from 5 to 3 mL/h). When CLCSF was from 3 to 0 mL/h, although the increasing rate of AUC(CIAR) was as high as 55.7%/(mL/h), the decreasing rate for AUC(CIAR)/AUC(CIA) droped sharply to 47.0%/(mL/h).

AUC(CIAR) and AUC(CIAR)/AUC(CIA) as function of CLCSF. V was 140 mL, Kd was 10−8 M ( ), tumor CR0 was 5.73 × 10¹⁴ antigens/mL, DoseA was 2 mg, CI0 was 370 MBq/mg, and t1/2-I was 193 h.
Effect of Specific Activity (CI0), Antibody Dose (DoseA), and Antigen Concentration (CR0) on Therapeutic Ratio
Figure 5 shows the model predictions for AUC(CIAR) and AUC(CIAR)/AUC(CIA) as a function of injected DoseA, initial CI0, and initial CR0. The therapeutic effect of the radioisotope-labeled antibody not only depends on its activity, which is the product of DoseA and the specific activity of the labeling isotope (CI), but also depends on the amount of tumor cell antigens (CR0). For tumors with low antigen density, we may need to deliver a smaller amount of antibody but load the antibody with an isotope at a higher specific activity. To show the individual effect of DoseA and CI0 for the same initial activity of 740 MBq used in the phase I clinical trial (11), we used 2 mg for DoseA and 370 MBq/mg for CI0 (11) and 0.2 mg for DoseA and 3,700 MBq/mg for CI0 in Figure 5. For CR0, we estimated that it may vary from 1011 to 1014 antigens/mL based on tumor types (antigens per cell) and coverage percentages on the surface of the CSF space (Supplemental Table 2). For the same activity of 740 MBq, a smaller DoseA (0.2 mg) and larger CI0 (3,700 MBq/mg), compared with a larger DoseA and smaller CI0, increased the AUC(CIAR) by approximately 2.9-fold and AUC(CIAR)/AUC(CIA) by approximately 2.8-fold for all the antigen concentrations. For the amount of tumor antigens considered, there are relatively more antibodies binding to the tumor cells for a smaller DoseA (less unbound), and the bound antibodies with higher CI0 would be more potent. This is also true for the same DoseA and CI0 but for different CR0. The higher the tumor antigen concentration CR0, the more the bound antibodies CIAR, the less the unbound CIA, and the larger the AUC(CIAR) and AUC(CIAR)/AUC(CIA).

AUC(CIAR) and AUC(CIAR)/AUC(CIA) as function of injected DoseA, CI0, and initial CR0. CI0 was 370 MBq/mg protein when DoseA was 2 mg, and CI0 was 3,700 MBq/mg protein when DoseA was 0.2 mg. V was 140 mL, Kd was 10−8 M ( ), and t1/2-I was 193 h.
Effect of Antibody Administration Schedule on Therapeutic Ratio
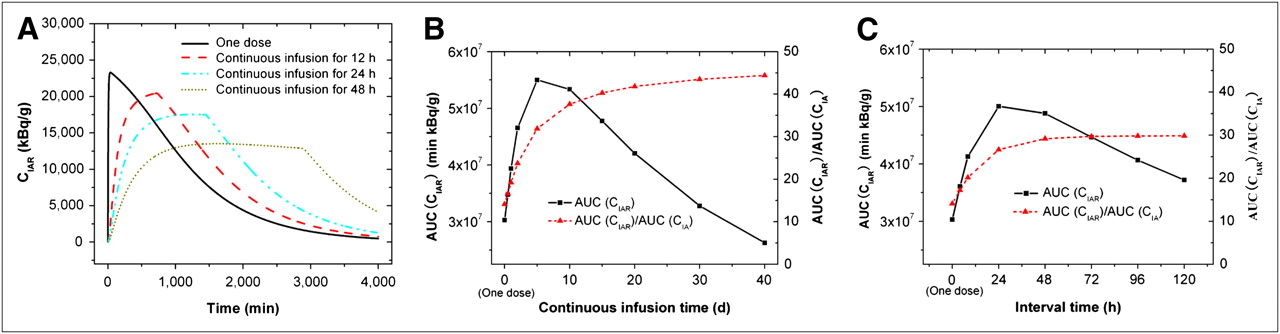
Compared with the single-bolus administration described in the previous sections, continuous infusion and split dosing may improve the therapeutic ratio by maintaining a longer duration of constant drug concentration at therapeutic levels and avoiding high peak concentrations in the CSF to reduce toxicity. We used our model to predict the effect of administration patterns on AUC(CIAR) and AUC(CIAR)/AUC(CIA) in Figure 6. The total antibody amount DoseA of 2 mg was the same for all 3 administration patterns. Figure 6A compares the CIAR-versus-time curves for a 1-dose administration and for continuous infusion for 12 h (infusion rate INFA = 0.167 mg/h), 24 (INFA = 0.083 mg/h) and 48 h (INFA = 0.042 mg/h). Continuous infusions have lower peak values for CIAR and flatter CIAR-versus-time curves. The longer the infusion time, the lower the peak value and the longer the duration for a constant CIAR. In addition, continuous infusion improved AUC(CIAR) and AUC(CIAR)/AUC(CIA). Figure 6B shows that when the infusion time increased, AUC(CIAR) increased and peaked at approximately 5 d but decreased at a longer infusion time. When the infusion time was 12, 24, and 48 h, the improvement over single dosing on AUC(CIAR) was 1.1-, 1.3-, and 1.5-fold, correspondingly. The maximum improvement was 1.8-fold when the infusion time was 5 d. Although there was a peak for AUC(CIAR), AUC(CIAR)/AUC(CIA) increased with the infusion time until it plateaued at approximately 10 d.

(A) CIAR as function of time in CSF compartment for single bolus administration and continuous infusion for 12, 24, and 48 h, correspondingly. (B) AUC(CIAR) and AUC(CIAR)/AUC(CIA) as function of infusion time for continuous infusion. (C) AUC(CIAR) and AUC(CIAR)/AUC(CIA) as function of time interval between dosing for 4 injections. Total dose of 2-mg antibody is same for different administration schedules. V was 140 mL, Kd was 10−8 M ( ), tumor CR0 was 5.73 × 10¹⁴ antigens/mL, CI0 was 370 MBq/mg, and t1/2-I was 193 h.
Split dosing achieved improvements similar to those achieved with continuous infusion. Figure 6C shows the effect of the time interval between dosing for 4 injections on AUC(CIAR) and AUC(CIAR)/AUC(CIA). The amount of antibody for each split administration was 0.5 mg with the total of 2 mg, the same as for single-bolus administration (1 dose). When the time was 4 h (administering 0.5 mg every 4 h for 4 times) and 8 h (administering 0.5 mg every 8 h for 4 times), the improvement over single dosing on AUC(CIAR) was 1.2- and 1.4-fold, respectively. The maximum improvement was 1.7-fold when the time was 24 h. The longer than 24-h time would reduce the improvement. Although there was a peak for AUC(CIAR), AUC(CIAR)/AUC(CIA) increased with the time until it plateaued at approximately 24 h.
Effect of t1/2-I on Therapeutic Ratio
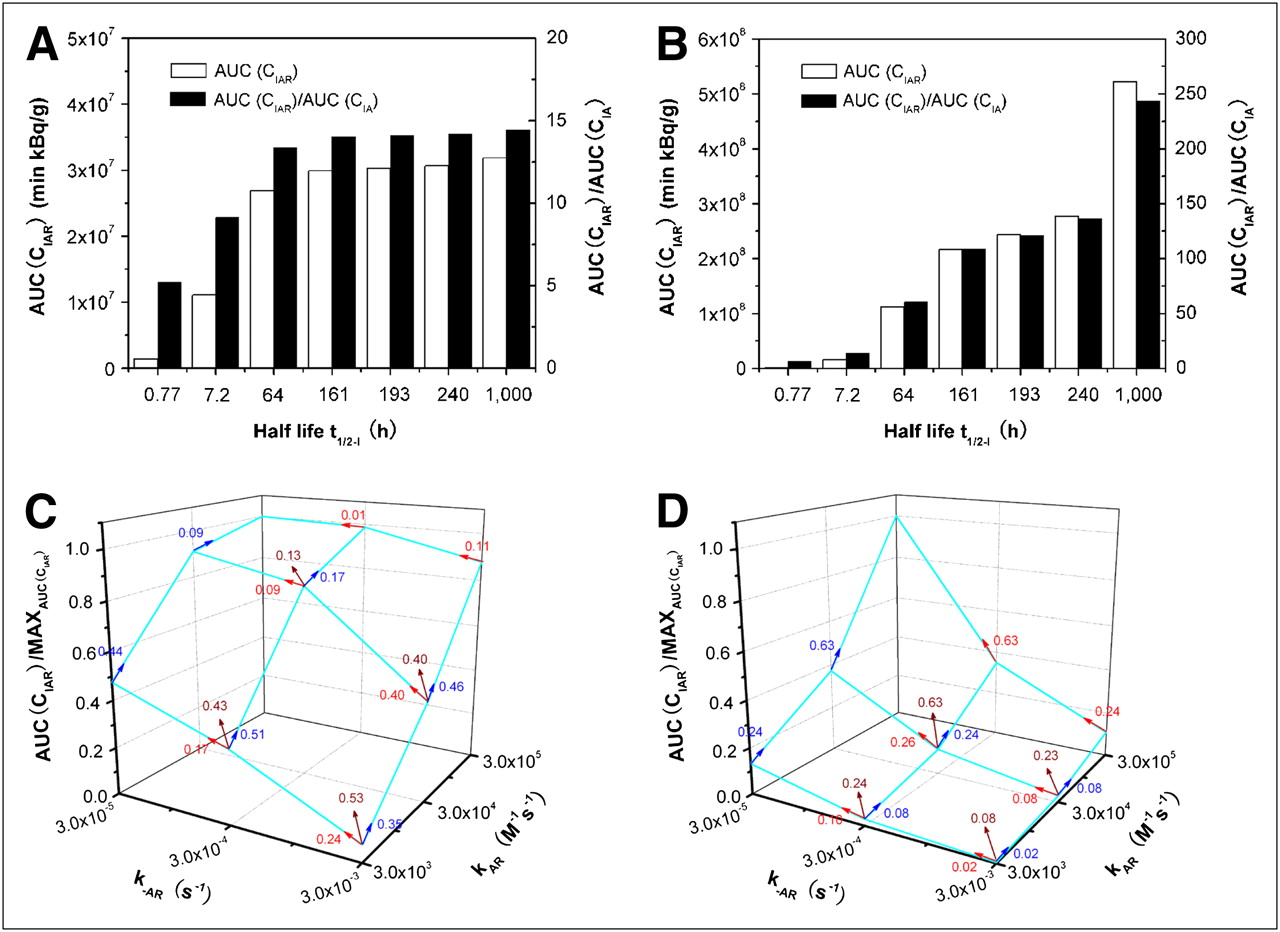
In addition to 131I (t1/2-I = 193 h), many other isotopes with various half-lives can be used in radioimmunotherapy: 225Ac (t1/2-I = 240 h), 172Lu (t1/2-I = 161 h), 90Y (t1/2-I = 64 h), 211At (t1/2-I = 7.2 h), and 213Bi (t1/2-I = 0.77 h) (14–16). Increasing t1/2-I delays the decay of the radioactivity of bound antibodies (CIAR) and would increase the therapeutic ratio. We used our model to predict the effect of t1/2-I on the AUC(CIAR) and AUC(CIAR)/AUC(CIA) (Fig. 7). For 3F8 (anti-GD2) with a Kd of 10−8 M (kAR = 3 × 10⁴ M−1s−1 and k−AR = 3 × 10⁻⁴ s−1) used in a study by Xu et al. (33), Figure 7A shows that increasing t1/2-I from 0.77 to 7.2 h greatly increased the AUC(CIAR) by 7.8-fold and AUC(CIAR)/AUC(CIA) by 1.7-fold; increasing t1/2-I from 7.2 to 64 h moderately increased the AUC(CIAR) by 2.4-fold and AUC(CIAR)/AUC(CIA) by 1.5-fold. Increasing t1/2-I further above 64 h improved only slightly the AUC(CIAR) (<10%) and AUC(CIAR)/AUC(CIA) (<5%). Interestingly, when the affinity Kd was increased to 10−10 M, the t1/2-I effect was different from the effect for a 10−8 M increase (Fig. 7B). Increasing t1/2-I from 0.77 to 7.2 h and from 7.2 to 64 h greatly increased AUC(CIAR) by 9.3- and 6.9-fold, respectively, and AUC(CIAR)/AUC(CIA) by 2.1- and 4.3-fold, respectively. Increasing t1/2-I from 64 to 161 h moderately increased the AUC(CIAR) by 1.9-fold and AUC(CIAR)/AUC(CIA) by 1.8-fold; further increasing t1/2-I from 161 to 193 h and from 193 to 240 h improved AUC(CIAR) and AUC(CIAR)/AUC(CIA) by about 10% for each increment. However, increasing t1/2-I from 240 to 1,000 h significantly increased AUC(CIAR) and AUC(CIAR)/AUC(CIA) by 90% and 80%, respectively. Increasing the affinity from 10−8 to 10−10 M would allow stronger and longer binding of antibody to the antigen (larger CAR and smaller CA), and the much longer t1/2-I of the isotope would greatly delay the decrease in CI; therefore, we have the larger CIAR and smaller CIA at each time point.

AUC(CIAR) and AUC(CIAR)/AUC(CIA) as function of t1/2-I when Kd = 10−8M (A) and Kd = 10−10M (B). Normalized AUC(CIAR) as function of kAR and k−AR rate constants when t1/2-I = 0.77 (C) and t1/2-I = 240.0 h (D). Kd equaled  , and V was 140 mL, tumor CR0 was 5.73 × 10¹⁴ antigens/mL, DoseA was 2 mg, and CI0 was 370 MBq/mg.
To examine the individual effect of binding or dissociation rate constants kAR and k−AR for the same affinity Kd, we predict the AUC(CIAR) (normalized with the value at the highest affinity) as a function of kAR and k−AR in Figure 7C for the isotope with the shortest t1/2-I of 0.77 h and in Figure 7D for the isotope with the longest available t1/2-I of 240 h. The arrow with the quantity (slope) indicates the increase in AUC(CIAR) per unit increase in the equivalent affinity (including the individual effect of kAR and k−AR) when (kAR, k−AR) increases from one set of values to another. The larger the slope, the larger the improvement in AUC(CIAR). For example, for a t1/2-I of 0.77 h, the largest improvement in AUC(CIAR) was when (kAR, k−AR) increased from (3 × 10³ M−1s−1, 3 × 10⁻³ s−1) to (3 × 10⁴ M−1s−1, 3 × 10⁻⁴ s−1) because it had the largest slope of 0.53 in Figure 7C. Further increase from (3 × 10⁴ M−1s−1, 3 × 10⁻⁴ s−1) to (3 × 10⁵ M−1s−1, 3 × 10⁻⁵ s−1) did not gain much improvement—the slope was only 0.13—despite a substantial effort to increase Kd from 10−8 to 10−10 M. In contrast, for a t1/2-I of 240 h, the most improvement in AUC(CIAR) was when (kAR, k−AR) increased from (3 × 10⁴ M−1s−1, 3 × 10⁻⁴ s−1) to (3 × 10⁵ M−1s−1, 3 × 10⁻⁵ s−1) because the slope was 0.63, the largest among others. So, it is worthwhile to increase Kd from 10−8 to 10−10 M for the antibody with a t1/2-I of 240 h.
For a t1/2-I of 0.77 h, the plot of AUC(CIAR) is not symmetric about the (kAR, k−AR) axes. The increase in kAR led to more improvement in AUC(CIAR) than did the decrease in k−AR for the same Kd. For example, if (kAR, k−AR) increased from (3 × 10³ M−1s−1, 3 × 10⁻³ s−1) to (3 × 10⁵ M−1s−1, 3 × 10⁻³ s−1) along the kAR axis, the improvement in AUC(CIAR) was 12.5-fold, whereas from (3 × 10³ M−1s−1, 3 × 10⁻³ s−1) to (3 × 10³ M−1s−1, 3 × 10⁻⁵ s−1) along the k−AR axis, the improvement was only 6.7-fold. For both cases, Kd was from 10−6 M to 10−8 M. However, this asymmetry was lost when the t1/2-I was 240 h. The decrease in k−AR instead of the increase in kAR could bring about slightly higher gain in AUC(CIAR), about 20% when Kd is from 10−6 M to 10−8 M.
DISCUSSION
The validity of any model rests on how well the data fit. We passed that test by showing near-perfect agreement between model predictions and patient pharmacokinetic data obtained in the phase I clinical trial (the correlation coefficients were greater than 0.99). Several of the predictions from the model were intuitive, although not necessarily quantitative, and some of the predictions were unexpected.
We expected that increasing the antibody affinity to the antigen (Kd) would enhance the AUC(CIAR). With a quantitative model, we now can predict how much enhancement to expect with each increment of Kd and what the respective contribution is from kAR or k−AR. When the affinity Kd is improved from 10−6 to 10−7 M, the enhancement in AUC(CIAR) is 7.6-fold. This enhancement is reduced to 4.8-, 2.7-, 2.4-, 1.5-, and 1.1-fold, respectively, as Kd is decreased from 10−7 to 10−8 M, 10−8 to 10−9 M, 10−9 to 10−10 M, 10−10 to 10−11 M, and 10−11 to 10−12 M. These predictions suggest that increasing the affinity up to 10−10 M should bring about the optimal enhancement in AUC(CIAR). Further increases in affinity have diminishing returns, especially when one considers the technical difficulty in developing ligands with Kd beyond 10−10 M. Somewhat unexpected was the prediction that for the same increase in the affinity, increasing kAR provides much more benefit for an isotope with a short t1/2-I (0.77 h); but when the t1/2-I increases to 240 h, decreasing k−AR would bring slightly more enhancement in AUC(CIAR).
The biologic half-life of 131I loaded to the antibody in the CSF was much faster (3–12.9 h) (11) than its physical t1/2-I of 193 h. The half-life of 131I-3F8 in the CSF predicted by our model was 5.2 and 6.7 h, respectively, for 2 representative patients. The strong agreement between the model prediction and the measured patient data suggests that the rapid decrease in the activity of the CSF 131I-3F8 is mainly due to the clearance from the CLCSF, an assumption we made in our model. If we reduce the CLCSF by acetazolamide and furosemide (36), we would increase AUC(CIAR). However, reducing CLCSF would also reduce AUC(CIAR)/AUC(CIA) but at a much slower rate if CLCSF was above 3 mL/h. For the CSF delivery of 131I-3F8, CLCSF of 3 mL/h was an optimal condition. This quantitative conclusion was also unexpected because common sense may suggest that zero CSF flow should be ideal after the antibody injection. For other compartments not through the CSF, such as intraperitoneal administration, a new model needs to be developed to include clearances through peritoneal fluid circulation and excretion through the kidney and liver.
In addition to the antibody clearance from CSF and the half-life of the isotope loaded onto antibodies, the strength (or half-life) of the bonding between the isotope and antibody (iodine bond or metal chelation) may be just as important. Halogen bonds (e.g., iodine or astatine) are broken during systemic circulation (e.g., dehalogenation by the liver) but less so in the intrathecal space. More importantly, unlike serum, CSF does not have the enzymes and proteins to destabilize these bonds; therefore, we expect radioconjugate to be more stable in the CSF versus the blood compartment. As predicted by our model, for the same amount of isotope (total activity) CIA0 (DoseA × CI0), the smaller the antibody dose DoseA, the higher the specific activity CI0, the larger the AUC(CIAR), and more radioimmunotherapy efficacy. However, it is difficult to produce high-specific-activity CI0 before destroying the immunoreactivity of mAb. Using a more potent radioisotope (e.g., α-emitter 225Ac) may be an alternative.
Although continuous infusion and split dosing, compared with a single bolus administration, would improve the radioimmunotherapy efficacy by up to 1.8- and 1.7-fold in AUC(CIAR) it may not be clinically convenient. The maximum enhancement of 1.8- or 1.7-fold requires a 5-d continuous infusion or 4 injections given every 24 h over 4 d.
Parameters in Equation A5 in the supplemental materials (i.e., CLCSF/V, S/V, CIA0, and CR0) are species-specific, and a different set of values will need to be used if one were to apply these equations to nonhuman primates or small rodents. However, predictions from our model should be valid irrespective of species. Before translating these predictions to patient clinical trials, they can be further tested using these preclinical animal systems.
CONCLUSION
The strong agreement between model predictions and patient pharmacokinetic data obtained from patients in a clinical trial validates the assumptions and simplifications in our model. Using this model to optimize therapeutic ratio, we made predictions on critical kinetic and transport parameters, which will require further clinical validation. We believe that this model can provide an efficient and cost-effective approach in improving the clinical efficacy in this emerging treatment modality.
Acknowledgments
We thank Dr. John Humm and Dr. Larson, Nuclear Medicine, Department of Radiology, and Dr. Kim Kramer, Department of Pediatrics, for their expert input regarding patients treated with intra-Ommaya 131I3F8. This work was supported in part by grants from the National Institutes of Health (CA106450 and P20 CA118861-01), Robert Steel Foundation, Hope Street Kids, William H. Goodwin and Alice Goodwin, the Commonwealth Foundation for Cancer Research, and the Experimental Research Center of MSKCC. 3F8 was licensed by Memorial Sloan-Kettering Cancer Center to United Therapeutics, Inc., Silver Spring, MD.
Footnotes
-
COPYRIGHT © 2009 by the Society of Nuclear Medicine, Inc.
References
- Received for publication December 1, 2008.
- Accepted for publication May 4, 2009.


Jump to section
Related Articles
Cited By...
- No citing articles found.