


Abstract
The aim of this study was to compare nonfluoroscopic electroanatomic mapping (NOGA), SPECT perfusion imaging, and PET metabolic imaging for assessment of myocardial viability. In particular, we sought to elucidate differences of electromechanical properties between the perfusion/metabolism mismatch as an indicator of a potentially reversible ischemic injury and the perfusion/metabolism match indicating irreversibly damaged myocardial tissue. Methods: Twenty-one patients with coronary artery disease underwent NOGA mapping of endocardial unipolar voltage, cardiac 18F-FDG PET of glucose utilization, and resting 201Tl SPECT of myocardial perfusion. Results: Electrical activity was 10.8 ± 4.6 mV (mean ± SD) in normal myocardium and was unchanged in hypoperfused segments with maintained glucose metabolism (perfusion/metabolism mismatch), 9.3 ± 3.4 mV (P = not significant). In contrast, hypoperfused segments with a perfusion/metabolism match and nonviable segments showed significantly lower voltage (6.9 ± 3.1 mV, P < 0.0001 and 4.1 ± 1.1 mV, P < 0.0001 vs. normal). In hypoperfused segments, metabolic activity was more closely related to endocardial voltage than was myocardial perfusion (201Tl vs. voltage: r = 0.38, SEE = 3.2, P < 0.001; 18F-FDG PET vs. voltage: r = 0.6, SEE = 2.8, P < 0.0001). Conclusion: In hypoperfused myocardium, electrical activity by NOGA mapping is more closely related to PET metabolic activity than to SPECT myocardial perfusion. As NOGA mapping does not differentiate hypoperfused myocardium with enhanced glucose utilization from normal myocardium, results from NOGA mapping need to be correlated with results from perfusion imaging to identify hypoperfused, yet viable, myocardium and to stratify patients for revascularization procedures.
- myocardial metabolism
- myocardial perfusion
- nonfluoroscopic electroanatomic mapping
- PET
- coronary artery disease
Contractile dysfunction due to ischemic events has been shown to be potentially reversible when viability is maintained, such as in hibernating or stunned myocardium (1–4). Thus, the therapeutic stratification of patients with significant left ventricular (LV) dysfunction is strongly influenced by the detection of viable myocardium (5). By predicting the capacity of improvement of LV function after revascularization, viability assessment yields important additional prognostic information and aids in the clinical management of patients with ischemic heart disease (6–8).
Besides standard techniques such as conventional SPECT scintigraphy with 201Tl or 99mTc-labeled tracers and low-dose dobutamine stress echocardiography for viability imaging, cardiac 18F-FDG PET has been used for the assessment of myocardial tissue injury (9,10). The presence of maintained glucose metabolism in hypoperfused myocardium (perfusion/metabolism mismatch) has been demonstrated to accurately predict the recovery of contractile function and an improvement in the clinical course of the patient (6–8).
Recently, novel methods—such as transmyocardial revascularization approaches with the possibility of injection of growth factors, stem cells, plasmids encoding growth factors, or myoblasts—have become available that may offer treatment options to patients with severe ischemic heart disease who have no alternative of percutaneous or surgical revascularization. These new techniques are performed in the catheterization laboratory and therefore require the capability for an online detection of ischemically injured, yet viable, myocardial areas.
Nonfluoroscopic catheter-based electroanatomic mapping (NOGA) enables identification and localization of viable myocardial tissue by simultaneous assessment of electrical activation and local mechanical response of the heart in the catheterization laboratory (11,12). The overall diagnostic value of endocardial mapping has been previously compared with SPECT (13–15), PET (16–19), and MRI (20). However, the specific electromechanical pattern of the perfusion/metabolism mismatch—characterized by decreased myocardial perfusion but enhanced 18F-FDG uptake due to increased glucose metabolism in ischemic territories—has not been elucidated in detail.
Therefore, the aim of this study was to compare NOGA mapping with PET metabolic imaging and SPECT perfusion imaging. Polar map analysis was used to compare electromechanical properties of hypoperfused segments with maintained PET metabolic activity (perfusion/metabolism mismatch), as an indicator of a potentially reversible ischemic injury, with hypoperfused segments with reduced PET metabolic activity (perfusion/metabolism match) indicating irreversibly damaged myocardial tissue.
MATERIALS AND METHODS
Study Population
Twenty-one consecutive patients (16 men, 5 women; mean age ± SD, 61 ± 11 y) with angiographically proven significant coronary artery disease and stable angina pectoris were included in the study. Exclusion criteria were recent myocardial infarction (within 3 wk before the endocardial mapping and 18F-FDG PET procedures), unstable angina, a LV ejection fraction < 30%, a LV wall thickness < 10 mm in any part of the left ventricle (to avoid an increased risk of perforating the thinned myocardium by an endocardial catheter), severe valvular heart disease, and severe peripheral atherosclerotic disease. Thirteen patients had experienced a previous myocardial infarction (3 ± 2 y before the study). Coronary angiography revealed multivessel disease in 13 patients. The LV ejection fraction measured by ventriculography (area length method) was 49% ± 17%.
Patients who were stratified to undergo NOGA mapping were studied by cardiac 18F-FDG PET of glucose utilization and 201Tl myocardial resting perfusion imaging 8 ± 2 and 4 ± 2 d, respectively, before NOGA mapping. All procedures were performed according to institutional guidelines. Informed consent was obtained from all patients.
201Tl SPECT Perfusion Imaging
To evaluate myocardial perfusion, 100 MBq 201Tl were injected intravenously under resting conditions. Ten minutes later, SPECT image acquisition was performed using a dual-detector γ-camera with a noncircular clockwise orbit (Vertex MCD; ADAC Laboratories). A total of 32 projections (16 per head) was obtained by step-and-shoot acquisition over 180°, performing a simultaneous transmission scan with 153Gd to obtain attenuation-corrected images. Transaxial images were reconstructed using fully automated software for attenuation and scatter correction (Vantage, ADAC Laboratories; ExSPECT, Emory University).
18F-FDG PET of Glucose Utilization
Patients were studied after fasting for at least 6 h. If fasting glucose levels were within the normal range, a 75-g oral glucose load was given to improve myocardial glucose uptake. Forty-five to 60 min later, the glucose level was determined, and 2–6 international units of insulin were injected intravenously if the glucose levels exceeded 140 mg/dL. This procedure was repeated until the glucose level was <140 mg/dL, at which time 400–500 MBq 18F-FDG were injected. Thirty to 90 min after tracer injection, image acquisition was performed on a high-resolution, full-ring PET camera (Advance; General Electric). A 1-min scout scan for correct positioning of the heart was followed by a 10-min transmission scan for attenuation correction (using a 68Ge source) and a 30-min static emission scan for myocardial 18F-FDG uptake. Image reconstruction was performed to generate 35 transaxial images.
Analysis of SPECT and PET Images
Transaxial 201Tl SPECT and 18F-FDG PET images were transferred to an image-processing workstation (Onyx; SGI) for image analysis. For both SPECT and PET images, transaxial images were reoriented into short-axis and long-axis images, and a polar map analysis was performed (Munich Heart software) to derive segmental tracer uptake in 12 segments (4 anatomic regions: septal, anterior, lateral, and posterior; 3 short-axis planes: apical, midventricular, and basal) in accordance with the results available from the NOGA mapping system.
To define segments without perfusion abnormality as the segments with “normal” glucose uptake (21), average segmental 201Tl and 18F-FDG uptake values were normalized to the respective regions exhibiting the maximal 201Tl uptake. Myocardial segments were classified into 4 groups according to viability criteria published in previous reports (17,22–26) differentiating viable myocardium (segments with normal perfusion or maintained glucose metabolism) from nonviable myocardium (hypoperfused segments with severely reduced glucose metabolism) as follows:
•Normal: Segments with 201Tl uptake > 70% were considered as normally perfused.
All segments with reduced 201Tl uptake (≤70%) were considered as hypoperfused and classified as:
Perfusion/metabolism mismatch: hypoperfused myocardium with relatively increased glucose metabolism (201Tl uptake ≤ 70%; 18F-FDG uptake > 70%),
Perfusion/metabolism match: hypoperfused myocardium with concordantly reduced glucose metabolism (201Tl uptake ≤ 70%; 18F-FDG uptake > 50% and ≤ 70%),
Nonviable: hypoperfused myocardium without evidence of residual glucose metabolism (201Tl uptake ≤ 70%; 18F-FDG uptake ≤ 50%).
NOGA Mapping
After diagnostic coronary angiography and contrast ventriculography, electroanatomic mapping was performed. Under fluoroscopic guidance, a 7-French mapping catheter with a deflectable tip was advanced into the LV cavity. Electroanatomic mapping was performed as previously described (11,27,28) to measure endocardial unipolar voltage (UpV) and local linear shortening (LLS). Polar map analysis was used to generate segmental values of the LV endocardial voltage and LLS in 12 myocardial segments indicated earlier. Thus, a direct segmental comparison of the maps for endocardial voltage and LLS with myocardial perfusion and glucose utilization was achieved (Figs. 1 and 2).

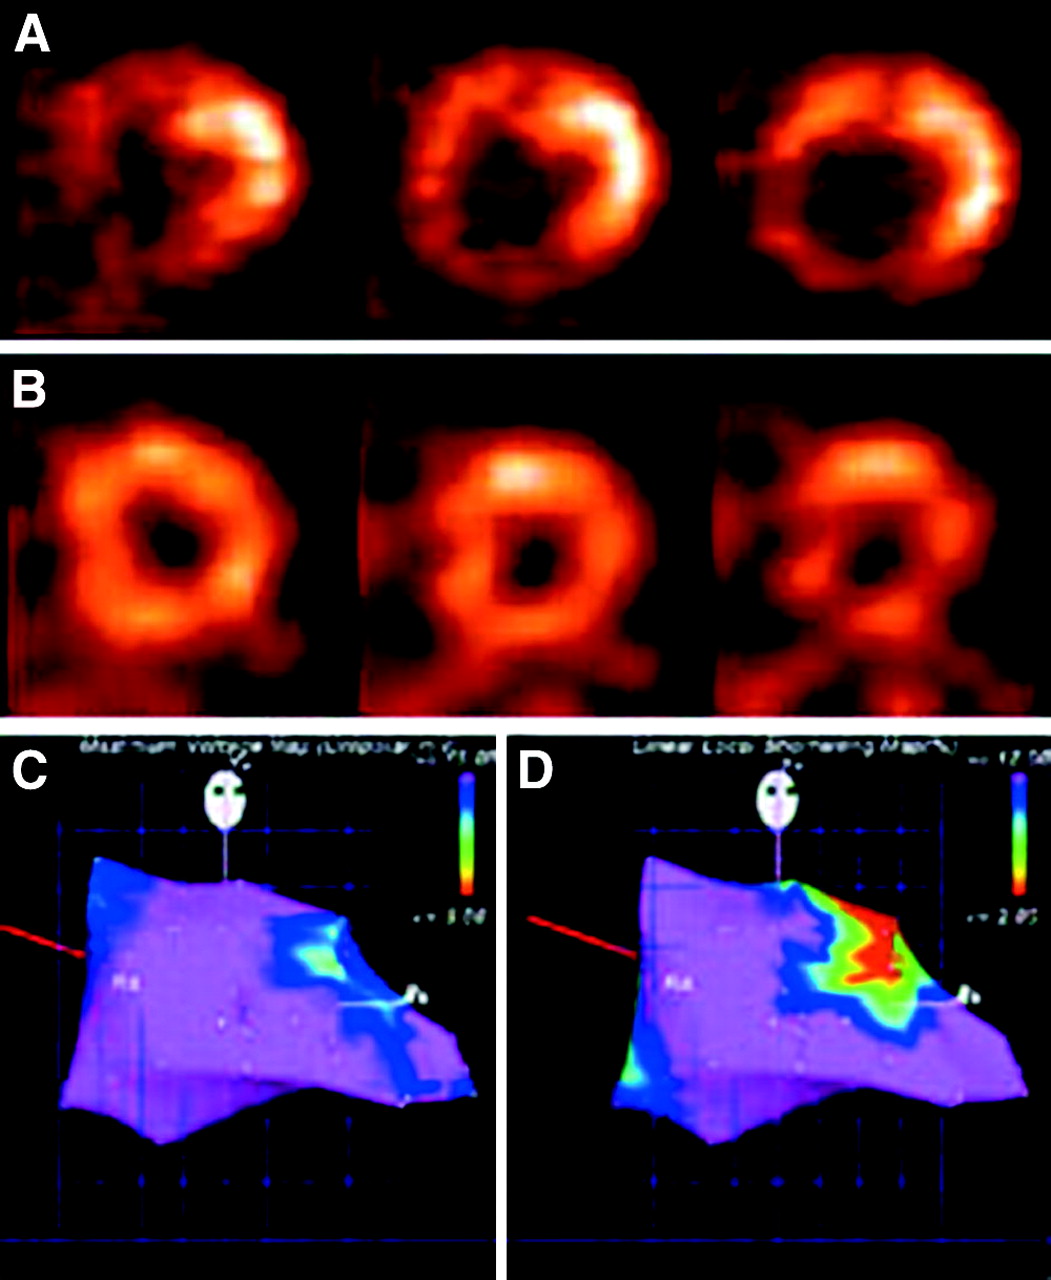
Short-axis views of 18F-FDG PET (A) and 201Tl SPECT scintigraphy (B) of 50-y-old patient with significant stenosis of circumflex artery with moderately decreased global LV function. Perfusion/metabolism mismatch is present in midlateral wall with reduced 201Tl uptake and increased 18F-FDG uptake. Electrical activity (unipolar voltage) was nearly normal in all segments (C), whereas LLS showed decreased values in midlateral wall (D).
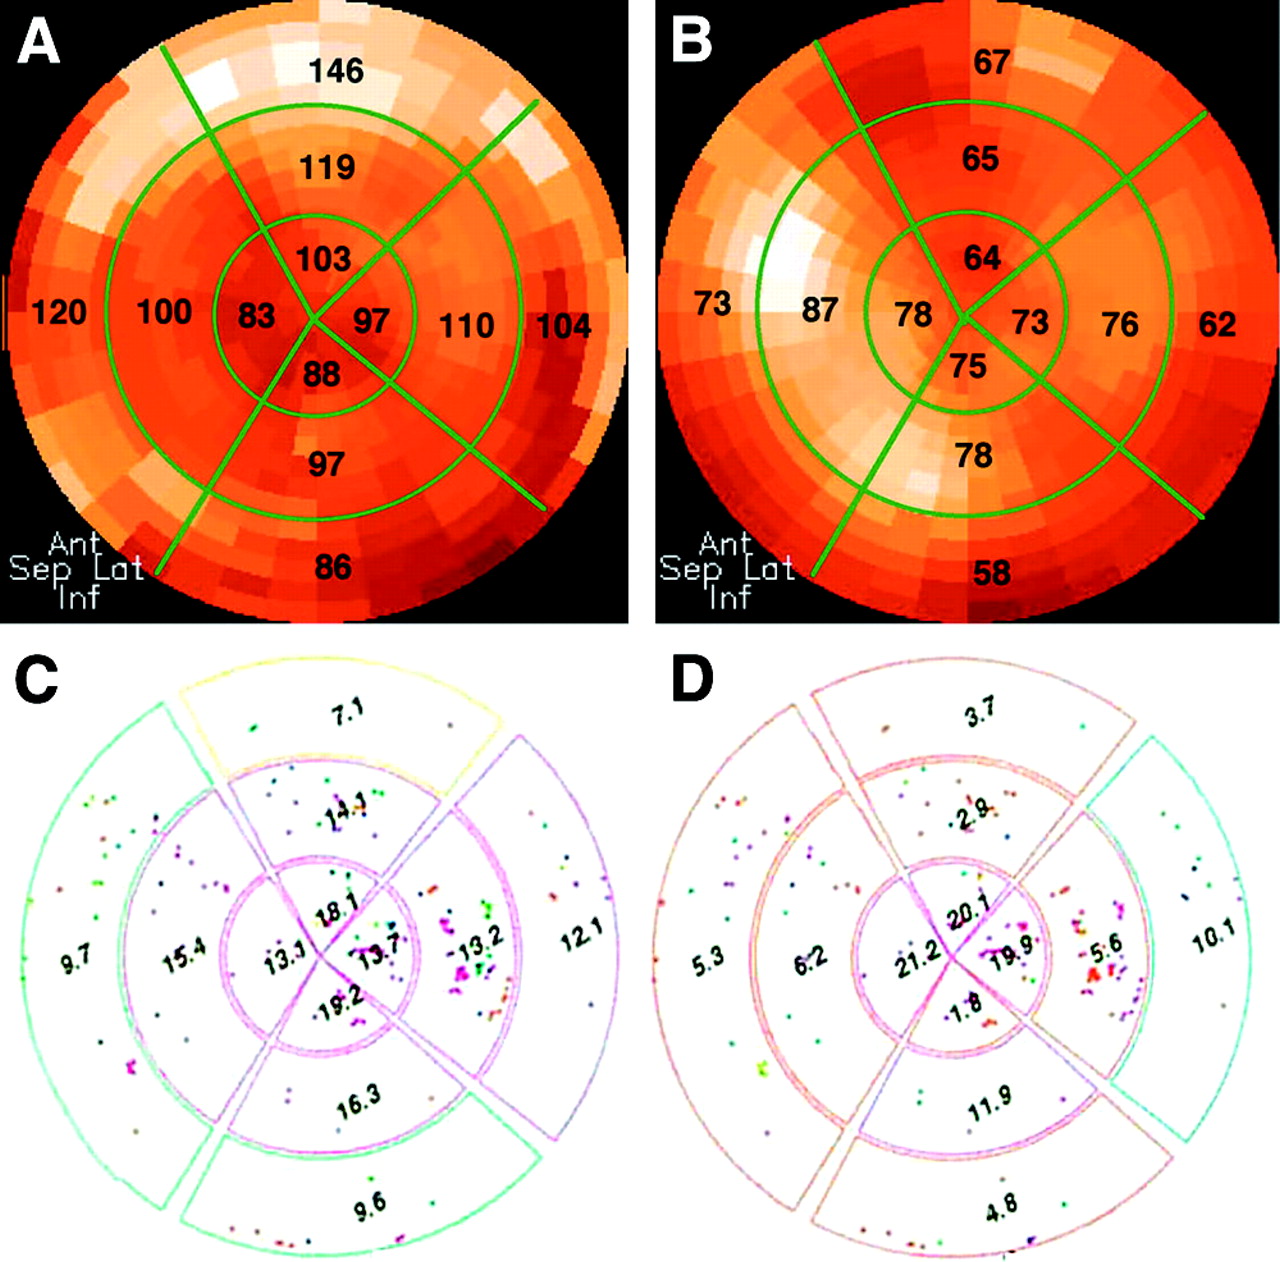
Polar map analysis of 18F-FDG PET metabolic imaging (A) and 201Tl perfusion imaging (B) and NOGA mapping (C, unipolar voltage; D, LLS) of patient with severe stenosis of diagonal branch of left anterior descending artery with perfusion/metabolism mismatch in basal and middle anterior and anterolateral walls with unipolar voltage values within normal range and reduced LLS values.
During NOGA mapping an average of 95 ± 28 endocardial points per patient was investigated. After filtering endocardialpoints with inadequate voltage signals due to unstable location of the catheter or due to rhythm disturbances, the average number of points drawing the LV silhouette was 78 ± 22. Since the septal and posterolateral basal segments in the polar map analysis of the endocardial mapping in most cases exhibit low voltage values of the mitral valve apparatus and the base of the heart (12), these basal segments (n = 63) were excluded from further analysis. In 17 segments, no definite interpretation could be made because of too few (<3) sampled data points. Thus, 172 (68%) of the 252 myocardial segments were available for data analysis.
Statistics
The mean ± SD is given for continuous data. Categoric variables are described as frequency distribution. ANOVA was used for data comparison between groups; regression analysis was used to compare continuous data. Receiver-operating-characteristic (ROC) analysis was used to derive the optimal threshold level (highest diagnostic accuracy) for UpV to differentiate PET viable myocardium and PET nonviable myocardium. P values < 0.05 indicated statistical significance. Statistical analyses were performed with the Statview software package (Statview 5.0.1; SAS Institute) and the CLABROC and LABROC computer software (29).
RESULTS
Endocardial Voltage
Endocardial voltage was 10.8 ± 4.6 mV in normal segments (n = 88), 9.3 ± 3.4 mV in hypoperfused segments with a perfusion/metabolism mismatch (n = 29), 6.9 ± 3.1 mV in hypoperfused segments with a perfusion/metabolism match (n = 40), and 4.1 ± 1.1 mV in nonviable segments (n = 15). Endocardial voltage was not significantly different between normal segments and hypoperfused segments with a perfusion/metabolism mismatch (P = not significant [NS]) but was significantly lower in hypoperfused segments with a perfusion/metabolism match and in nonviable segments (P < 0.0001; Table 1).
Mean Endocardial Voltage (UpV), LLS, Normalized 18F-FDG Uptake, and Normalized 201Tl Uptake in Normal Myocardium, in Hypoperfused Myocardium with Maintained Glucose Metabolism (Mismatch), in Hypoperfused Myocardium with Concordantly Reduced Glucose Metabolism (Match), and in Hypoperfused Myocardium with Nonviable Tissue
Relation Between Myocardial Perfusion, Glucose Metabolism, and Endocardial Voltage
Correlation between myocardial perfusion and endocardial voltage was moderate for all myocardial segments (r = 0.41, r2 = 0.17, SEE = 4.1, P < 0.0001; Fig. 3A) and decreased slightly when only hypoperfused segments were included in the analysis (r = 0.38, r2 = 0.14, SEE = 3.2, P < 0.001; Fig. 3C). There was no significant correlation between myocardial perfusion and endocardial voltage in hypoperfused segments with a perfusion/metabolism mismatch (r = 0.2, r2 = 0.04, SEE = 3.4, P = NS; Fig. 3E).
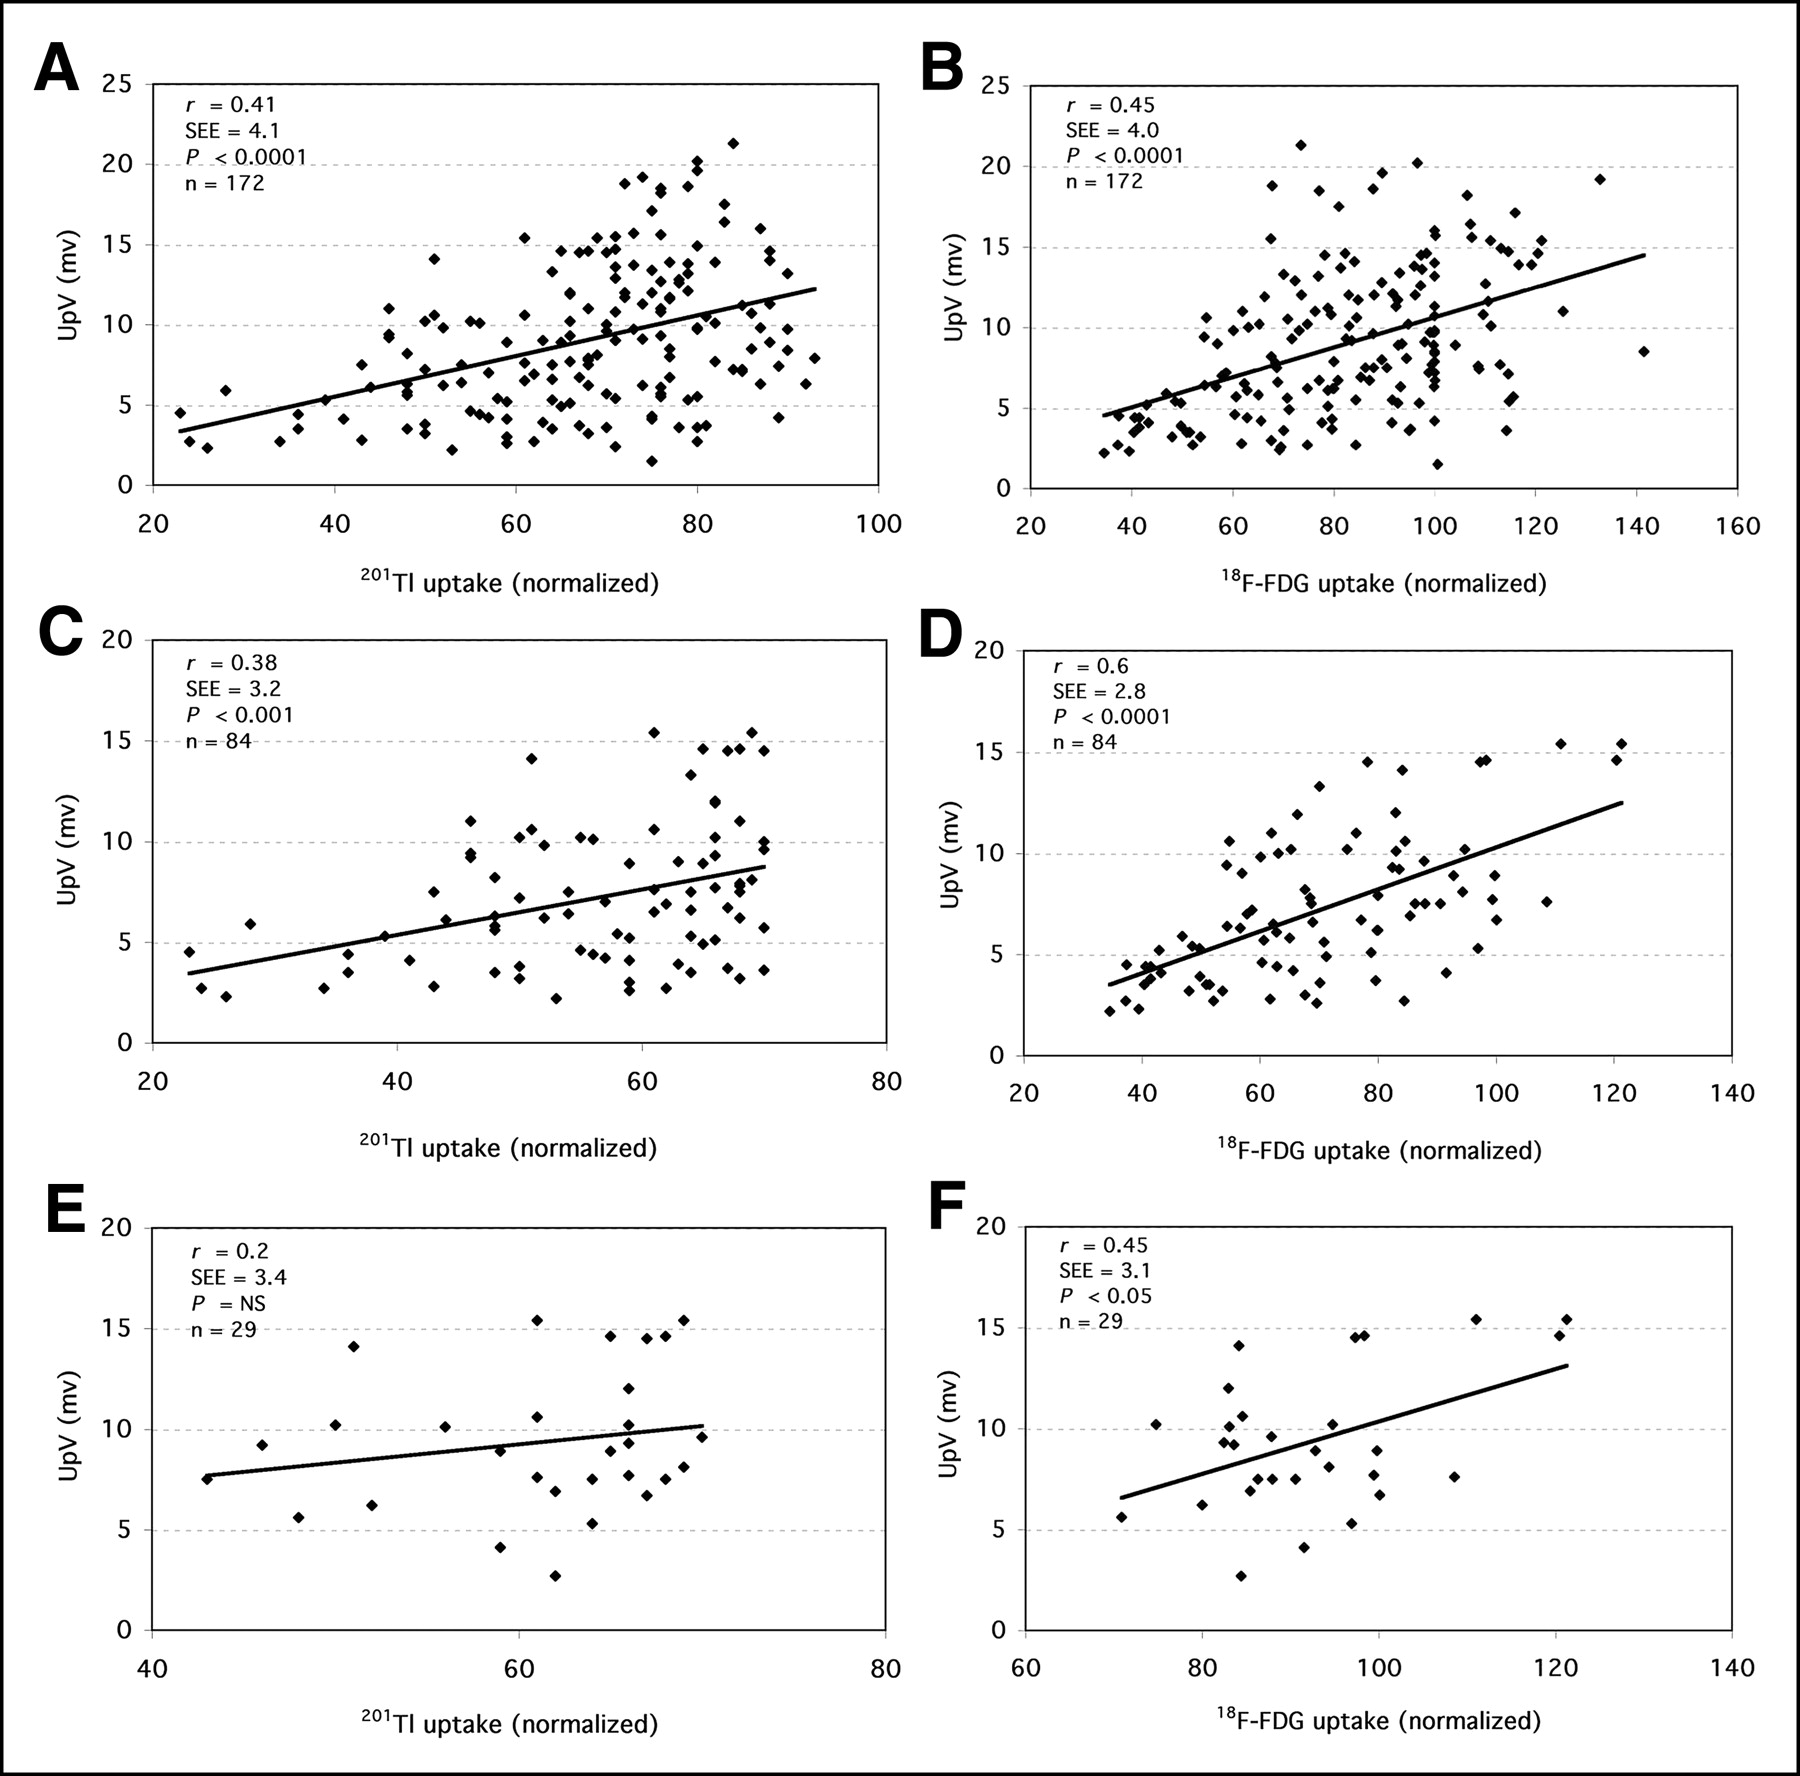
Linear correlation between UpV by NOGA mapping and normalized 201Tl and 18F-FDG uptake in all myocardial segments (A, 201Tl: P < 0.0001, r = 0.41, r2 = 0.17, SEE = 4.1; B, 18F-FDG: P < 0.0001, r = 0.45, r2 = 0.20, SEE = 4.0), in hypoperfused segments (C, 201Tl: P < 0.001, r = 0.38, r2 = 0.14, SEE = 3.2; D, 18F-FDG: P < 0.0001, r = 0.6, r2 = 0.36, SEE = 2.8), and in segments with perfusion/metabolism mismatch (E, 201Tl: P = NS, r = 0.2, r2 = 0.04, SEE = 3.4; F, 18F-FDG: P < 0.05, r = 0.45, r2 = 0.21, SEE = 3.1).
In contrast, correlation between glucose metabolism and endocardial voltage was moderate when all myocardial segments were included in the analysis (r = 0.45, r2 = 0.20, SEE = 4.0, P < 0.0001; Fig. 3B) and increased when only hypoperfused segments were considered (r = 0.6, r2 = 0.36, SEE = 2.8, P < 0.0001; Fig. 3D). In hypoperfused segments with a perfusion/metabolism mismatch, glucose metabolism was significantly related to endocardial voltage (r = 0.45, r2 = 0.21, SEE = 3.1, P < 0.05; Fig. 3F).
LLS
LLS was 9.5% ± 7.1% in normal segments, 9.6% ± 7.2% in hypoperfused segments with a perfusion/metabolism mismatch, 9.4% ± 8.3% in hypoperfused segments with a perfusion/metabolism match, and 5.4% ± 5.0% in nonviable segments. There was no significant difference between normal segments, hypoperfused segments with a perfusion/metabolism mismatch, and hypoperfused segments with a perfusion/metabolism match (Table 1).
ROC Analysis
The threshold level for endocardial voltage to identify PET viable segments with the highest achievable accuracy by ROC analysis was 5.2 mV. This threshold level was associated with a sensitivity and specificity of 85% for the detection of PET viable tissue by the mapping of endocardial voltage (Fig. 4A). ROC analysis of endocardial voltage and LLS to differentiate between PET viable segments (18F-FDG uptake > 50%) and PET nonviable segments (18F-FDG uptake ≤ 50%) showed an area under the ROC curve of 0.9 ± 0.03 and 0.69 ± 0.06, respectively (Fig. 4B).

(A) Determination of threshold value of unipolar endocardial voltage for identification of PET viable myocardium with sensitivity and specificity of 85% based on threshold of 5.2 mV. (B) ROC curves of UpV and LLS for differentiation between PET viable and PET nonviable myocardium with area under the curve of 0.9 ± 0.03 and 0.69 ± 0.06, respectively.
For the 4 anatomic regions, ROC analysis of endocardial voltage revealed an area under the curve of 0.91 ± 0.06 for the septal region, 0.91 ± 0.04 for the anterior region, 0.83 ± 0.07 for the lateral region, and 0.87 ± 0.09 for the inferior region.
DISCUSSION
This study investigated the relation between the electrical properties of myocardial tissue and imaging of myocardial perfusion and glucose metabolism for viability assessment. The impact of perfusion/metabolism imaging for the prediction of major adverse cardiac events (death and myocardial infarction) and the improvement of LV function after revascularization has previously been well described (6–8,30,31). The new catheter technique of electromechanical NOGA mapping has previously been compared with different scintigraphic methods (13–19) (Table 2). However, to our knowledge, the electromechanical properties of hypoperfused myocardial segments with a perfusion/metabolism mismatch as the hallmark for reversibly injured tissue have not been investigated in detail.
Comparison of Electromechanical NOGA Mapping with Different Myocardial Imaging Methods
Endocardial Voltage
Measurements of voltage obtained in normal myocardium (10.8 ± 4.6 mV) and in scarred segments (4.1 ± 1.1 mV) in this study are in good agreement with results of previous studies, which demonstrated that NOGA mapping can be used to identify viable myocardium (13–20) (Table 2).
Hypoperfused myocardial segments that exhibit a maintained glucose metabolism in the absence of adequate oxygen supply showed values for endocardial voltage that were similar to values derived in segments with a normal perfusion. This finding suggests that “electrical viability” is closely related to the metabolic state of the myocardial cell and can be retained even when perfusion is reduced.
A moderate correlation was found between myocardial 18F-FDG uptake and endocardial voltage (r = 0.45) when all segments were included in the analysis. The exclusion of myocardial segments with normal perfusion resulted in an improved correlation between 18F-FDG uptake and endocardial voltage (r = 0.6). In contrast, the correlation between endocardial voltage and myocardial perfusion decreased when only hypoperfused segments were investigated and became insignificant when only hypoperfused segments with a perfusion/metabolism mismatch were included. These findings support the concept of a close concordance between maintained or increased myocardial glucose metabolism and electrical activity in hypoperfused myocardium.
The present study confirms that resting perfusion imaging by 201Tl is unable to differentiate hypoperfused segments with enhanced or preserved metabolism and preserved electrical activity from hypoperfused segments with a concordant reduction in metabolism and electrical activity.
In this study, the sensitivity and specificity of endocardial voltage for assessment of viability were 85% and, thus, comparable to data obtained by other techniques. The threshold value of endocardial voltage to differentiate viable and nonviable myocardium obtained by ROC analysis in this study was 5.2 mV and differed slightly from our previously published threshold value of 6.4 mV, which was obtained on the basis of 201Tl late resting uptake (13). This lower threshold may partly be attributed to a lower accuracy of viability detection by 201Tl and to differences in the study population.
LLS
Measurements of LLS were similar between normal segments, segments with a perfusion/metabolism mismatch, and segments with a perfusion/metabolism match. Accordingly, LLS cannot differentiate between normal and hypoperfused myocardium with maintained viability, as demonstrated by ROC analysis. The sensitivity and specificity of LLS for detection of viable and nonviable tissues were low, as demonstrated in previous studies (13,14,16,19) (Table 2). Therefore, our study confirms the limited value of LLS for the assessment of myocardial viability.
Limitations
This study included patients with an ejection fraction > 30%, as initially NOGA mapping with a 7-French catheter was considered to carry an increased risk of myocardial perforation in myocardium with a thinned wall. Therefore, whether the results also would apply to patients with a severely reduced LV function (<30% ejection fraction) remains to be determined.
Different criteria to define myocardial viability by 201Tl or 18F-FDG imaging have been proposed in previous studies (6,22,23,25,32,33). In agreement with the study of Koch et al. (17), who compared NOGA mapping with SPECT and PET, in the present study a normalized 201Tl tracer uptake > 70% was used for definition of normal perfusion and a normalized 18F-FDG tracer uptake ≤ 50% was used for definition of nonviable myocardium. Unlike an earlier study that used late 201Tl imaging to delineate myocardial viability (13), resting 201Tl SPECT in the present study was performed immediately after tracer injection to delineate resting myocardial perfusion.
The commercial software for NOGA analysis generates data displays in a polar map format. Therefore, segmental polar map analysis was used to achieve a direct semiquantitative comparison of results from NOGA mapping and scintigraphic imaging. However, differences may have occurred, as the 2 methods use different principles of signal processing: NOGA is based on a discrete point-per-point registration of values by a catheter, whereas scintigraphic images obtained by a tomographic acquisition represent a continuous imaging map. Moreover, small misalignments between SPECT and PET data cannot be excluded, as both studies were performed on different days and with different cameras. However, because all scintigraphic studies were processed with the same image analysis software, significant errors due to misalignment of segments are unlikely.
In NOGA mapping, the basal portion of the septal and posterolateral segments of the left ventricle are difficult to evaluate. Moreover, nondiagnostic endocardial signals due to an unstable location of the catheter or due to arrhythmias had to be excluded from analysis. Thus, NOGA mapping frequently does not cover the entire endocardial surface. Furthermore, segments with a perfusion/metabolism mismatch are not common in clinical practice, as reflected by the low number of 29 mismatch segments (17% of all measurable segments). Also, small areas of a perfusion/metabolism mismatch can be missed by segmental polar map analysis, particularly when overlapping between segments occurs.
Finally, even though the accuracy of PET viability imaging to predict functional recovery is well established (8,34), functional recovery as an endpoint of viability was not investigated independently in the present study.
CONCLUSION
In hypoperfused myocardium, endocardial electrical activity by NOGA mapping is more closely related to PET metabolic activity than to SPECT myocardial perfusion. Hypoperfused myocardial segments with a perfusion/metabolism mismatch as a hallmark of maintained myocardial viability exhibit maintained endocardial potential similar to segments with a normal perfusion. Thus, although NOGA mapping correlates with maintained metabolic activity, an assessment of myocardial perfusion needs to be made if NOGA mapping is to be used to differentiate normal myocardium from hypoperfused myocardium with preserved viability and to guide online decision making for endocavitary or intraluminal revascularization procedures. Moreover, a complementary imaging technique for assessment of myocardial viability may be needed, as NOGA mapping rarely covers the entire endocardial surface.
Acknowledgments
We are grateful for the support and superb technical assistance of the technicians in the laboratory for cardiovascular nuclear medicine as well as the nurses working in the coronary catheterization laboratory of the Department of Cardiology and the technologists of the PET center of the Department of Nuclear Medicine at the Medical University of Vienna Medical School. This work was supported in part by the Verein zur Förderung der Wissenschaftlichen Forschung am Rudolfinerhaus.
Footnotes
Received Nov. 6, 2003; revision accepted Apr. 12, 2004.
For correspondence or reprints contact: Senta Graf, MD, Department of Cardiology, Medical University of Vienna, Waehringer Guertel 18-20, A-1090 Vienna, Austria.
E-mail: senta.graf{at}akh-wien.ac.at


