
Main menu

  • Home
  • Content
    • Current
    • Ahead of print
    • Past Issues
    • JNM Supplement
    • SNMMI Annual Meeting Abstracts
    • Continuing Education
    • JNM Podcasts
  • Subscriptions
    • Subscribers
    • Institutional and Non-member
    • Rates
    • Journal Claims
    • Corporate & Special Sales
  • Authors
    • Submit to JNM
    • Information for Authors
    • Assignment of Copyright
    • AQARA requirements
  • Info
    • Reviewers
    • Permissions
    • Advertisers
  • About
    • About Us
    • Editorial Board
    • Contact Information
  • More
    • Alerts
    • Feedback
    • Help
    • SNMMI Journals
  • SNMMI
    • JNM
    • JNMT
    • SNMMI Journals
    • SNMMI

User menu

  • Subscribe
  • My alerts
  • Log in
  • Log out
  • My Cart

Search

  • Advanced search
Journal of Nuclear Medicine
  • SNMMI
    • JNM
    • JNMT
    • SNMMI Journals
    • SNMMI
  • Subscribe
  • My alerts
  • Log in
  • Log out
  • My Cart
Journal of Nuclear Medicine

Advanced Search

  • Home
  • Content
    • Current
    • Ahead of print
    • Past Issues
    • JNM Supplement
    • SNMMI Annual Meeting Abstracts
    • Continuing Education
    • JNM Podcasts
  • Subscriptions
    • Subscribers
    • Institutional and Non-member
    • Rates
    • Journal Claims
    • Corporate & Special Sales
  • Authors
    • Submit to JNM
    • Information for Authors
    • Assignment of Copyright
    • AQARA requirements
  • Info
    • Reviewers
    • Permissions
    • Advertisers
  • About
    • About Us
    • Editorial Board
    • Contact Information
  • More
    • Alerts
    • Feedback
    • Help
    • SNMMI Journals
  • View or Listen to JNM Podcast
  • Visit JNM on Facebook
  • Join JNM on LinkedIn
  • Follow JNM on Twitter
  • Subscribe to our RSS feeds
OtherBasic Science Investigations

Impact of Nodal Regression on Radiation Dose for Lymphoma Patients After Radioimmunotherapy

Christine L. Hartmann Siantar, Gerald L. DeNardo and Sally J. DeNardo
Journal of Nuclear Medicine August 2003, 44 (8) 1322-1329;
Christine L. Hartmann Siantar
  • Find this author on Google Scholar
  • Find this author on PubMed
  • Search for this author on this site
Gerald L. DeNardo
  • Find this author on Google Scholar
  • Find this author on PubMed
  • Search for this author on this site
Sally J. DeNardo
  • Find this author on Google Scholar
  • Find this author on PubMed
  • Search for this author on this site
  • Article
  • Figures & Data
  • Info & Metrics
  • PDF
Loading

Article Figures & Data

Figures

  • Tables
  • FIGURE 1.
    • Download figure
    • Open in new tab
    • Download powerpoint
    FIGURE 1.

    Empiric, analytic fit to Monte Carlo-simulated absorbed fraction data for water spheres ranging in size from 0.01 to 1,000 g. R2 is square of R for fitted curve.
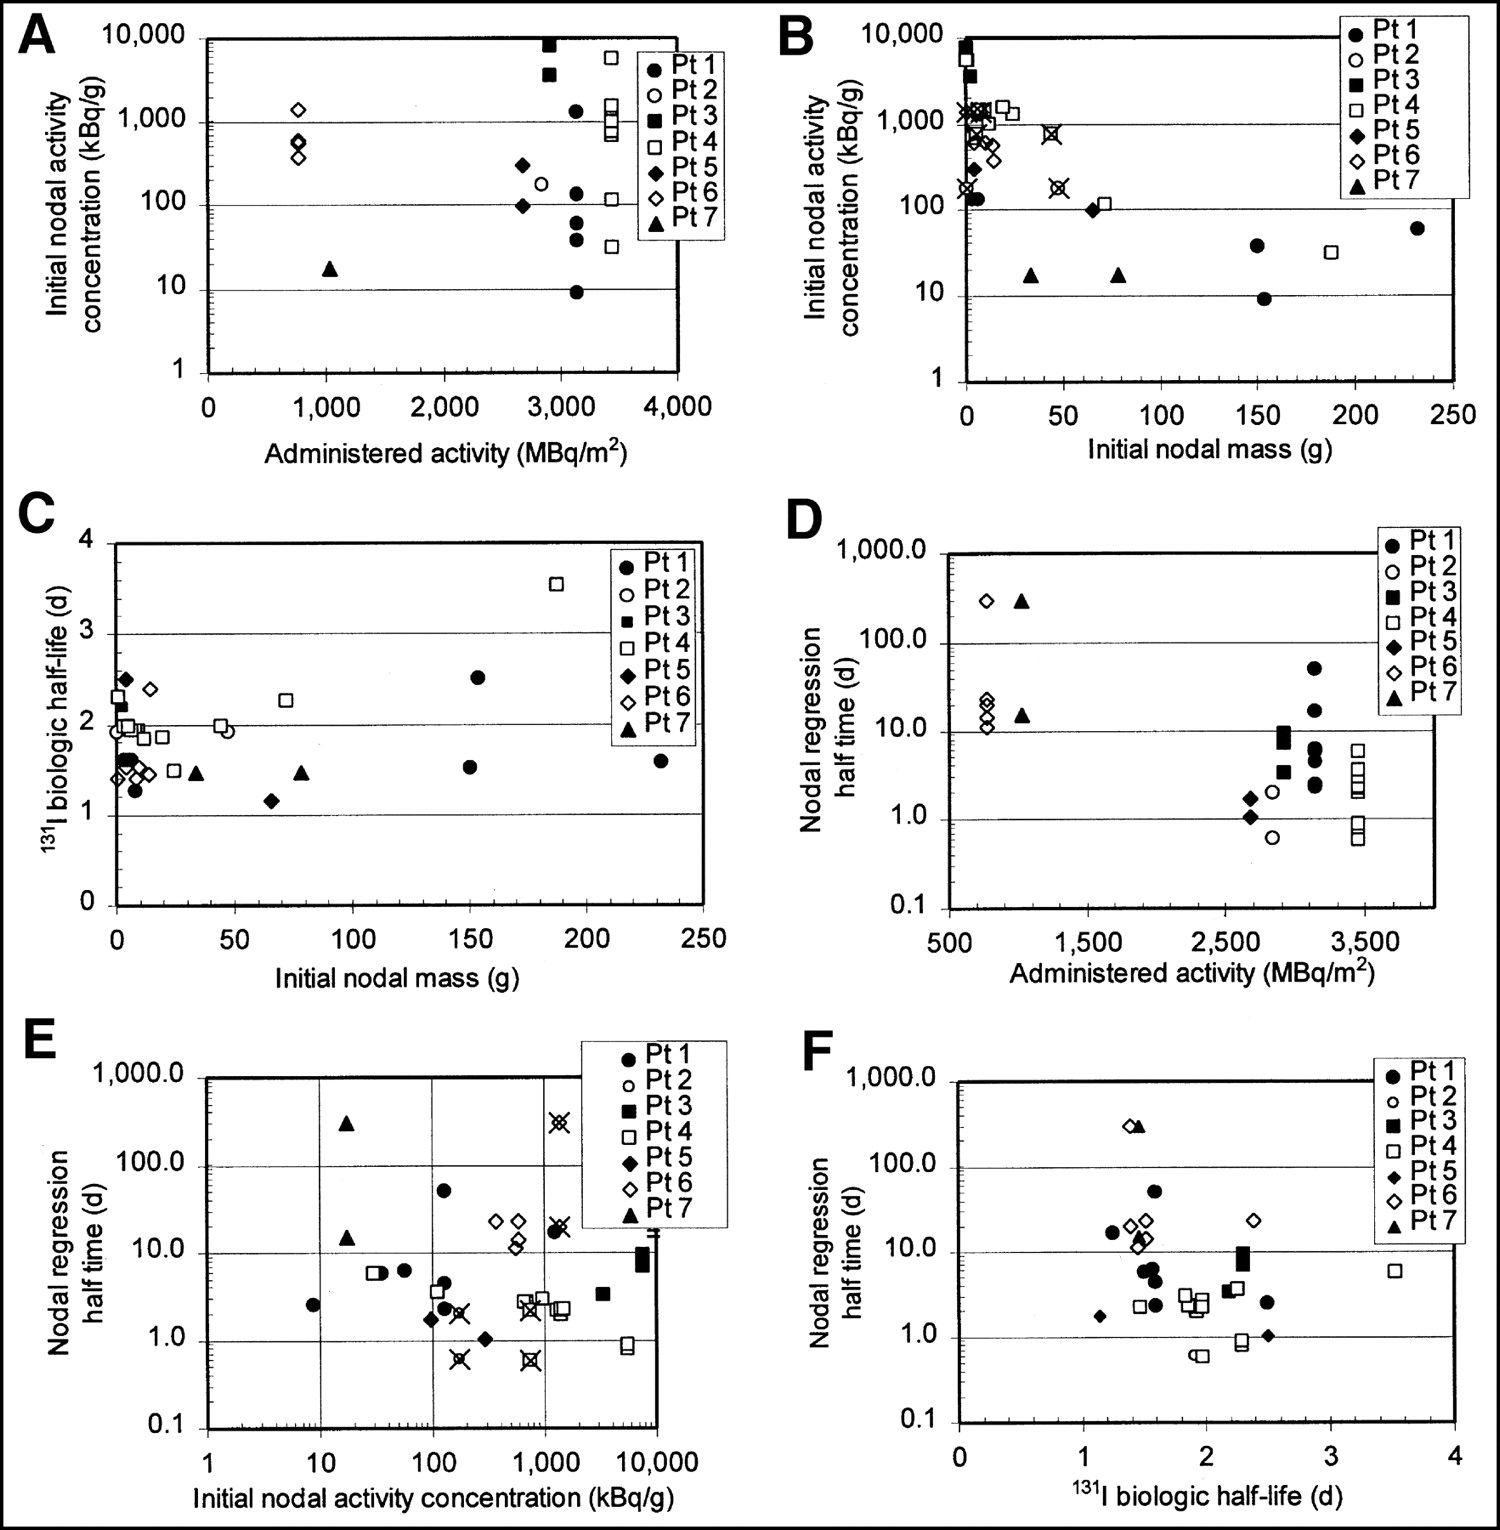
  • FIGURE 2.
    • Download figure
    • Open in new tab
    • Download powerpoint
    FIGURE 2.

    Relationship between administered activity, initial nodal mass, initial nodal activity concentration, and nodal regression half-time, 131I biologic half-life. Initial nodal activity concentrations appear to be more related to nodal mass (A) than to administered activity (B). 131I biologic half-life did not appear to depend strongly on initial nodal mass (C). Nodal regression half-time is >10 d in all nodes for those patients treated with 700–1,000 MBq/m2 injected activities and is <10 d for all except 2 nodes in patients treated with >2,800 MBq/m2 (D). In contrast, nodal regression half-time does not appear to depend strongly on node’s initial activity concentration (E). Wide variation in nodal regression half-times, ranging from <1 d to no change in mass (arbitrarily assigned to 300 d for plotting on graph), were associated with relatively small variation in 131I biologic half-life (F). X marks in B and E identify pairs of dissimilar masses that were imaged in same ROI and assigned same activity per nodal mass. Pt = patient.
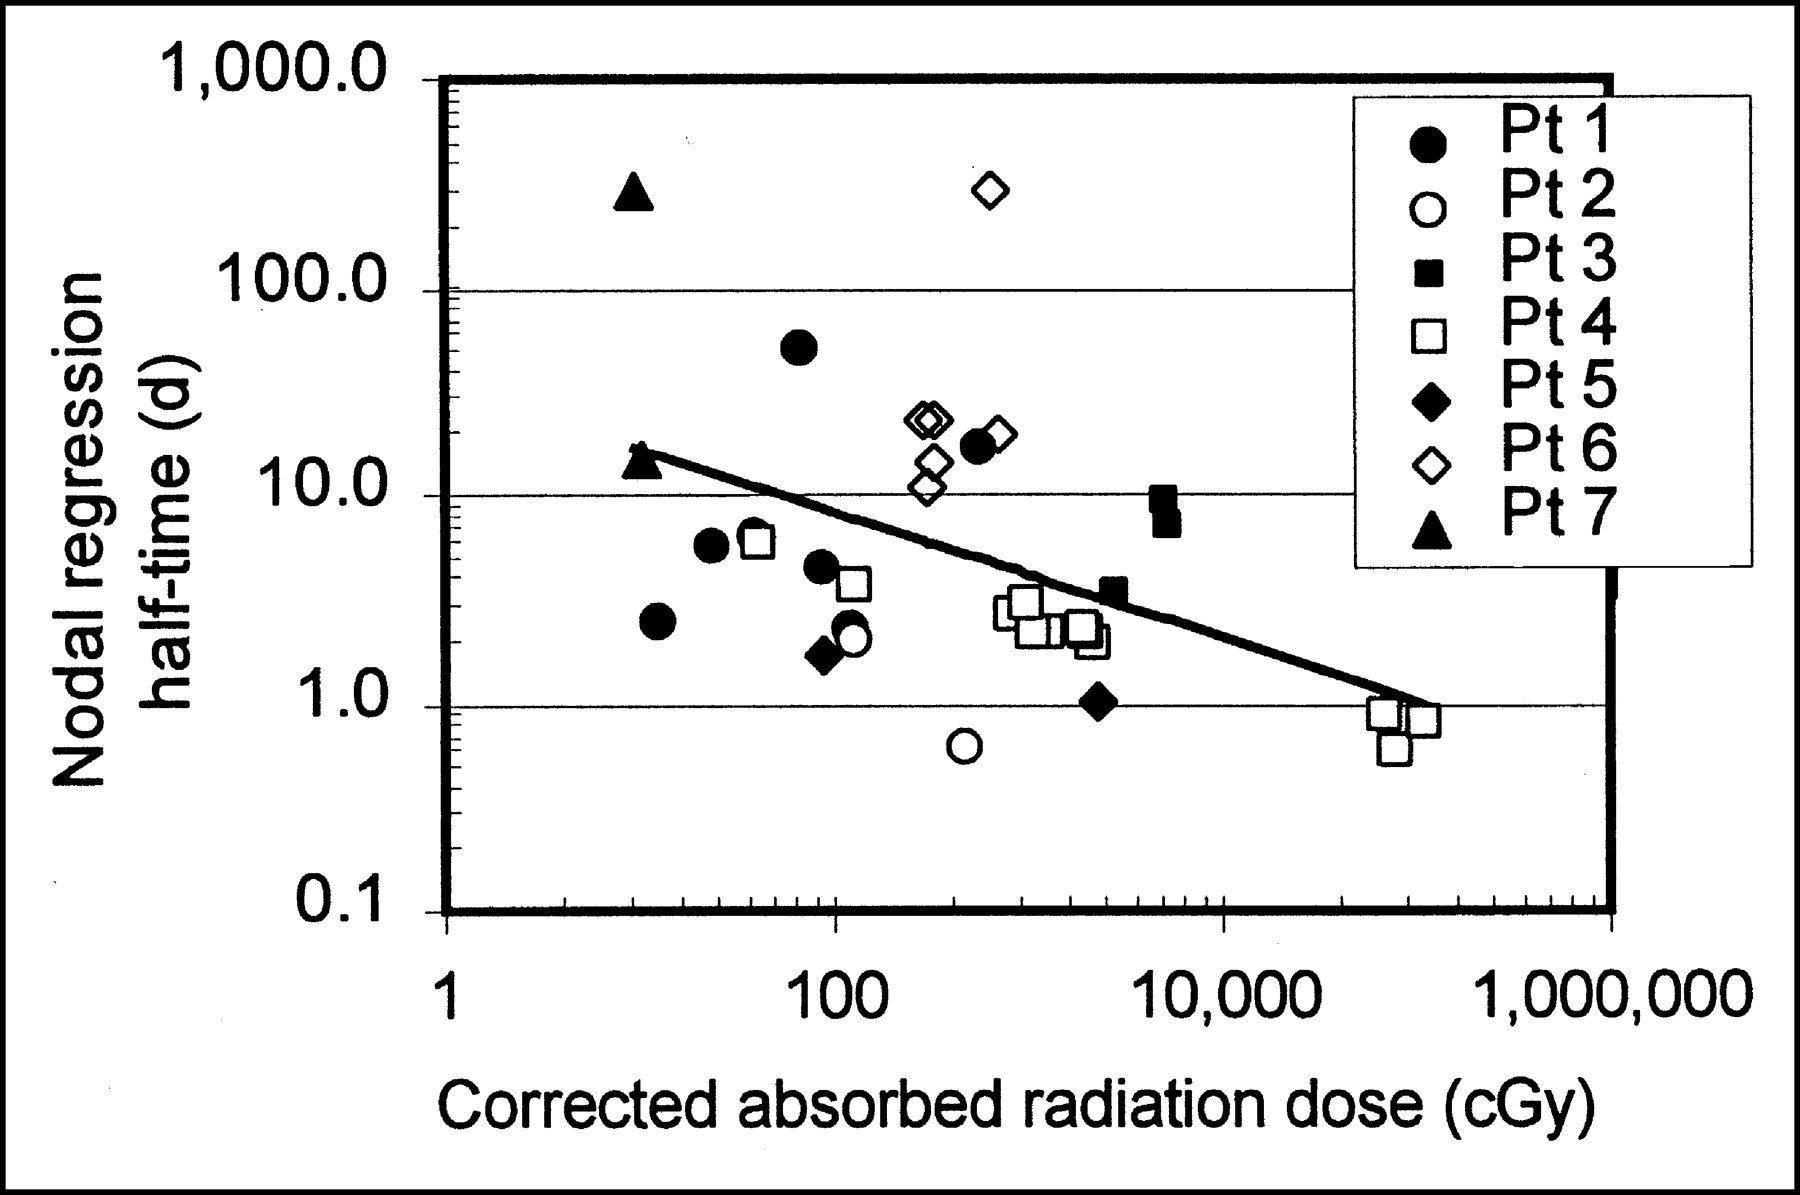
  • FIGURE 3.
    • Download figure
    • Open in new tab
    • Download powerpoint
    FIGURE 3.

    Greater corrected absorbed radiation doses were generally associated with shorter nodal regression half-times. Line shows least-squares fit, which has P = 0.004. Pt = patient.
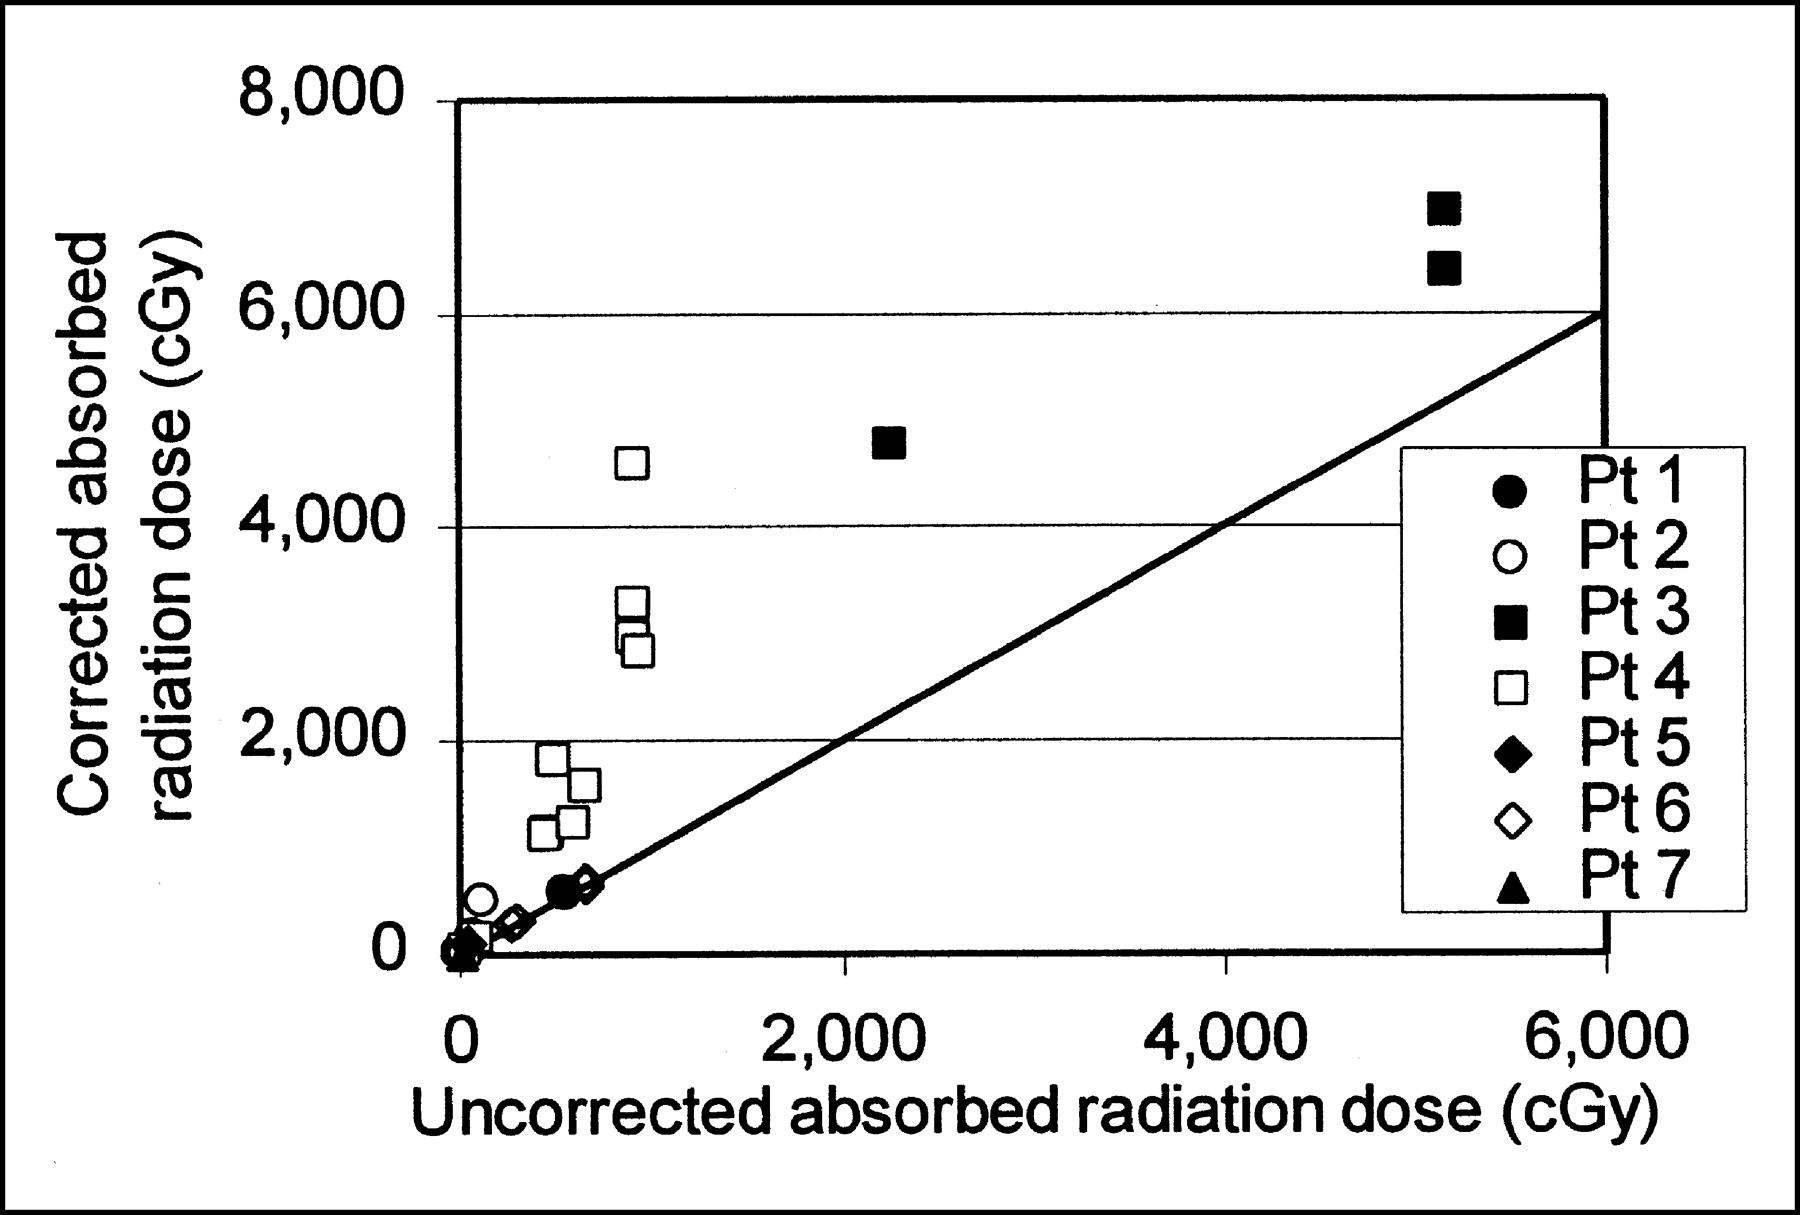
  • FIGURE 4.
    • Download figure
    • Open in new tab
    • Download powerpoint
    FIGURE 4.

    Corrected and uncorrected absorbed radiation dose. Dose correction generally increases with increasing absorbed radiation dose. Plot does not include nodes whose regression half-time was shorter than activity effective half-life. Plot does include line of identity for corrected and uncorrected absorbed radiation dose. Pt = patient.
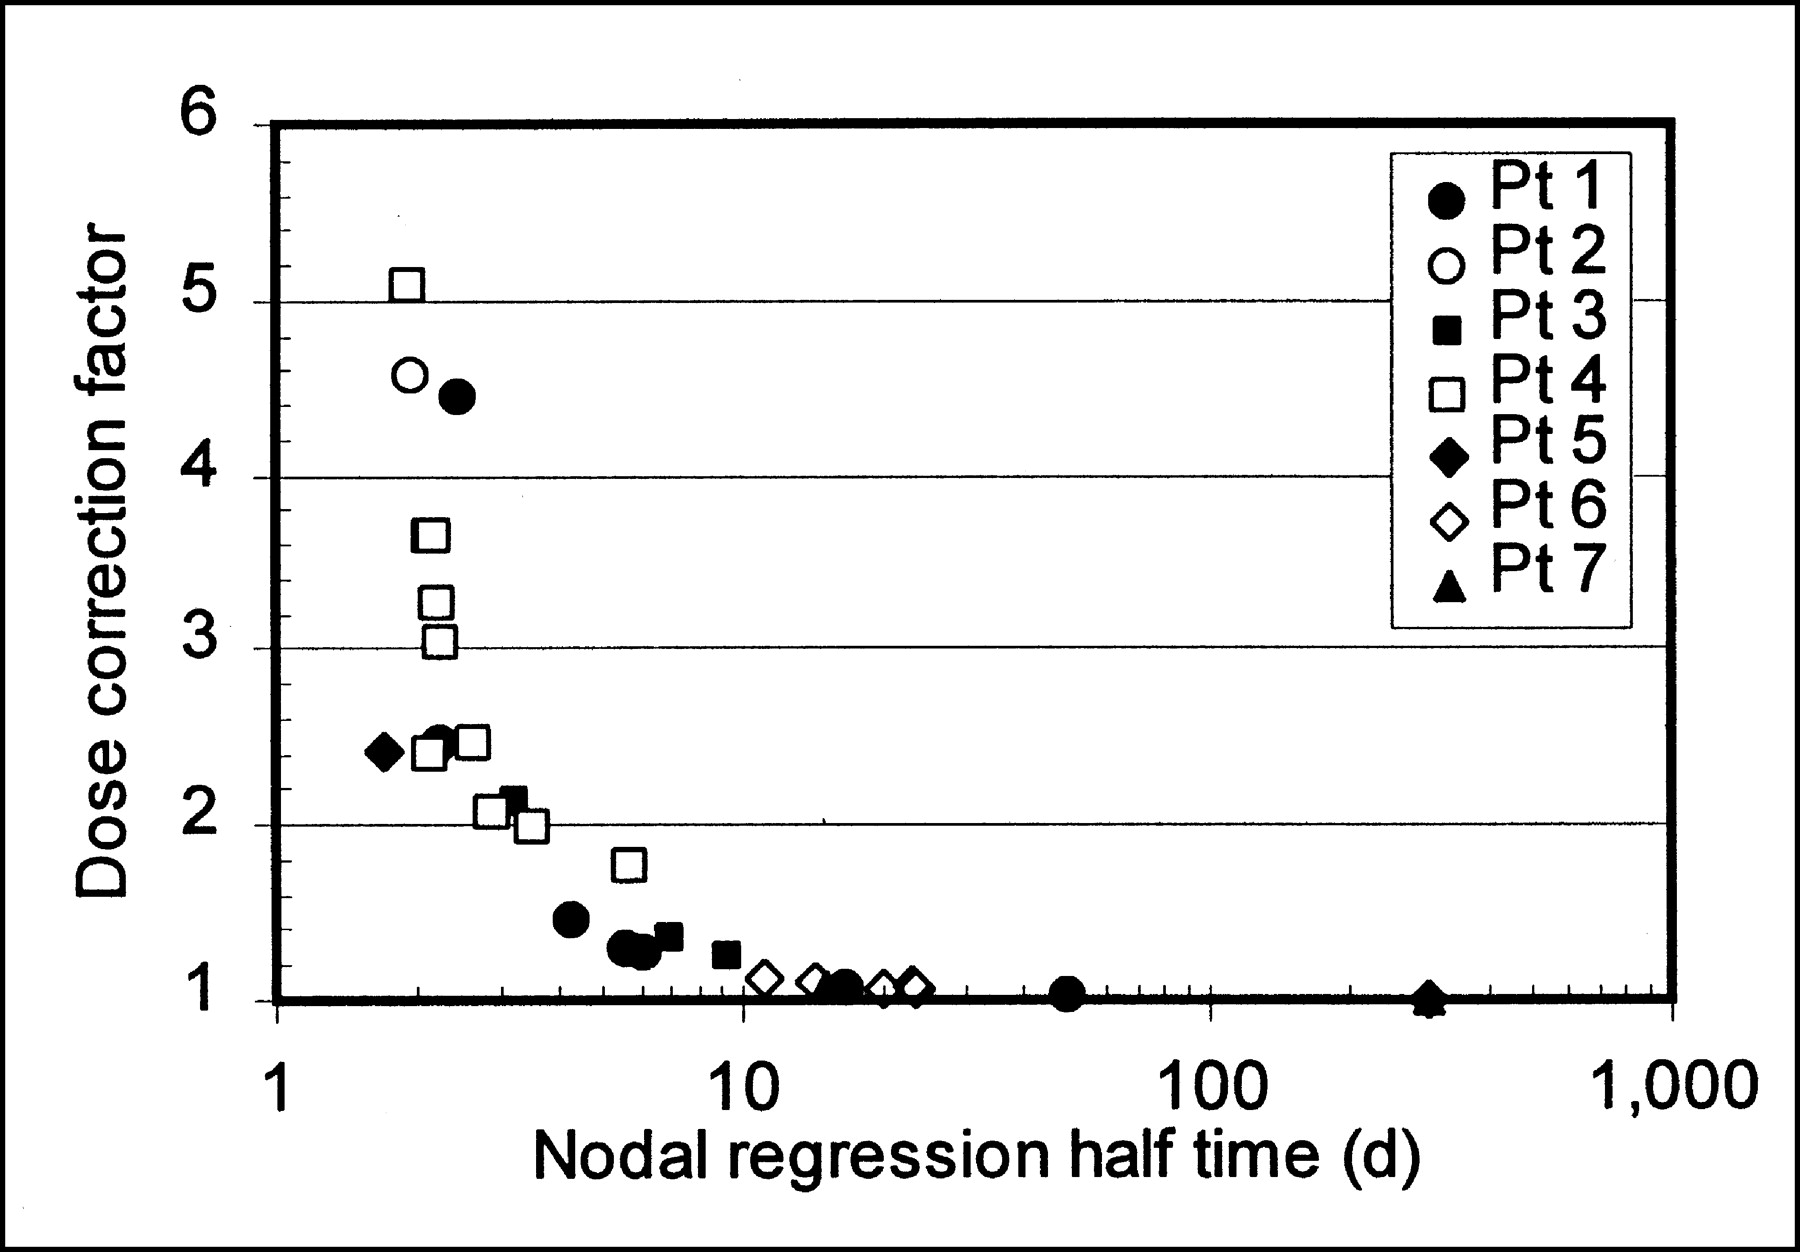
  • FIGURE 5.
    • Download figure
    • Open in new tab
    • Download powerpoint
    FIGURE 5.

    Correction factor for absorbed radiation dose resulting from nodal regression. Plot does not include nodes whose regression half-time was shorter than 131I effective half-life. Pt = patient.
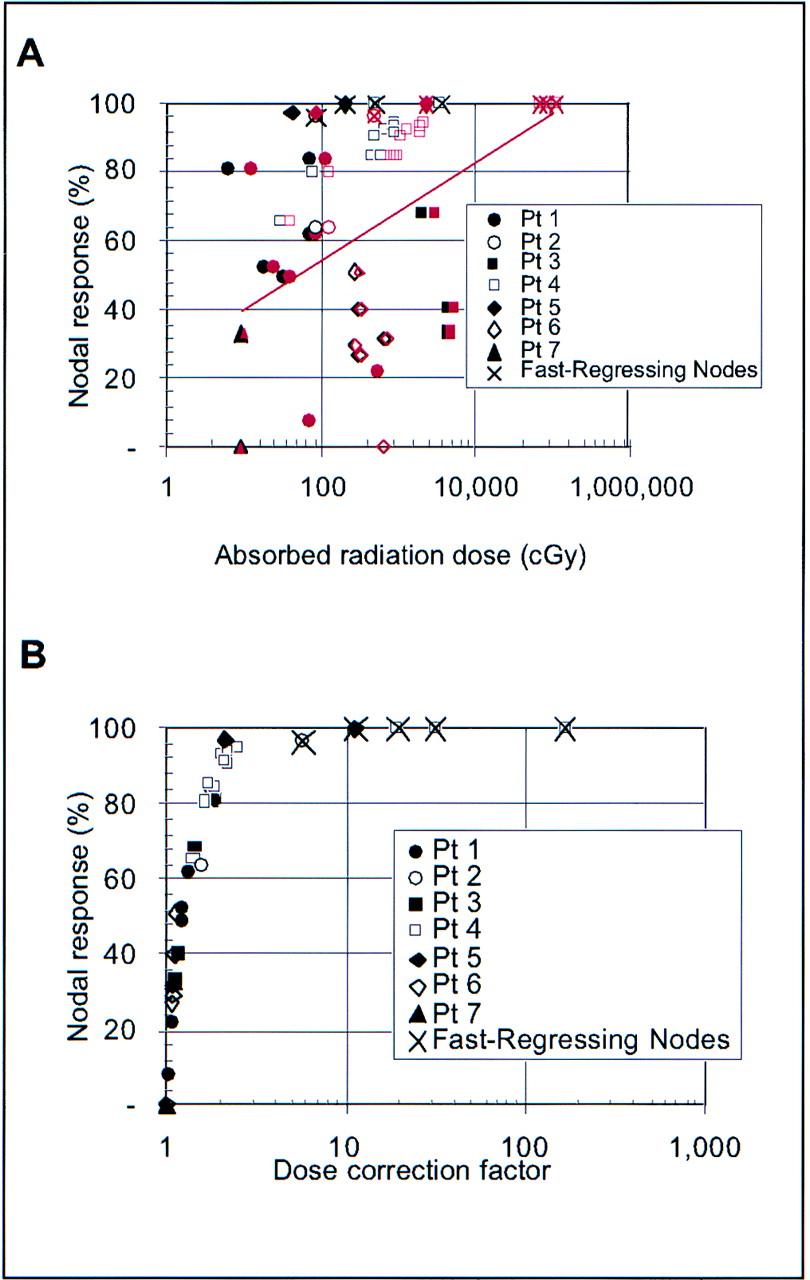
  • FIGURE 6.
    • Download figure
    • Open in new tab
    • Download powerpoint
    FIGURE 6.

    Nodal regression compared with uncorrected (black symbols) and corrected (red symbols) absorbed radiation dose (A) and dose correction factor (B). In A, uncorrected dose is shown with black symbols and corrected dose with red symbols, and red line shows least-squares fit (P = 0.005) to nodal regression vs. corrected absorbed radiation dose. Absorbed radiation dose was calculated by integrating only to final measurement time. Pt = patient.

  • FIGURE 7.
    • Download figure
    • Open in new tab
    • Download powerpoint
    FIGURE 7.

    Nodes with highest doses were small in size (A), which was consistent with higher initial 131I activity concentration, and were located in patients who received high administered activities (B). Pt = patient.

Tables

  • Figures
    • View popup
    TABLE 1

    Summary of Administered Dose, Number of Accessible Nodes, Number of Nodes With Activity Measurements, and Number of Nodes Carried Through Study

    Patient no.Administered dose (GBq/m2)Accessible nodes*Accessible nodes with activity measurementsNodes carried through study†
    13.151287
    22.85722
    32.92333
    43.45201414
    52.68332
    60.781776
    71.03633
    • ↵* Measured with calipers.

    • ↵† Had both activity and caliper measurements and met assessment criteria.

PreviousNext
Back to top

In this issue

Journal of Nuclear Medicine
Vol. 44, Issue 8
August 1, 2003
  • Table of Contents
  • Index by author
Print
Download PDF
Article Alerts
Sign In to Email Alerts with your Email Address
Email Article

Thank you for your interest in spreading the word on Journal of Nuclear Medicine.

NOTE: We only request your email address so that the person you are recommending the page to knows that you wanted them to see it, and that it is not junk mail. We do not capture any email address.

Enter multiple addresses on separate lines or separate them with commas.
Impact of Nodal Regression on Radiation Dose for Lymphoma Patients After Radioimmunotherapy
(Your Name) has sent you a message from Journal of Nuclear Medicine
(Your Name) thought you would like to see the Journal of Nuclear Medicine web site.
Citation Tools
Impact of Nodal Regression on Radiation Dose for Lymphoma Patients After Radioimmunotherapy
Christine L. Hartmann Siantar, Gerald L. DeNardo, Sally J. DeNardo
Journal of Nuclear Medicine Aug 2003, 44 (8) 1322-1329;

Citation Manager Formats

  • BibTeX
  • Bookends
  • EasyBib
  • EndNote (tagged)
  • EndNote 8 (xml)
  • Medlars
  • Mendeley
  • Papers
  • RefWorks Tagged
  • Ref Manager
  • RIS
  • Zotero
Share
Impact of Nodal Regression on Radiation Dose for Lymphoma Patients After Radioimmunotherapy
Christine L. Hartmann Siantar, Gerald L. DeNardo, Sally J. DeNardo
Journal of Nuclear Medicine Aug 2003, 44 (8) 1322-1329;
Twitter logo Facebook logo LinkedIn logo Mendeley logo
  • Tweet Widget
  • Facebook Like
  • Google Plus One
Bookmark this article

Jump to section

  • Article
    • Abstract
    • MATERIALS AND METHODS
    • RESULTS
    • DISCUSSION
    • CONCLUSION
    • Acknowledgments
    • Footnotes
    • REFERENCES
  • Figures & Data
  • Info & Metrics
  • PDF

Related Articles

  • No related articles found.
  • PubMed
  • Google Scholar

Cited By...

  • Dosimetry in Clinical Radiopharmaceutical Therapy of Cancer: Practicality Versus Perfection in Current Practice
  • 131I-Tositumomab Radioimmunotherapy: Initial Tumor Dose-Response Results Using 3-Dimensional Dosimetry Including Radiobiologic Modeling
  • Methodology to Incorporate Biologically Effective Dose and Equivalent Uniform Dose in Patient-Specific 3-Dimensional Dosimetry for Non-Hodgkin Lymphoma Patients Targeted with 131I-Tositumomab Therapy
  • Dose-Fractionated Radioimmunotherapy in Non-Hodgkin's Lymphoma Using DOTA-Conjugated, 90Y-Radiolabeled, Humanized Anti-CD22 Monoclonal Antibody, Epratuzumab
  • Google Scholar

More in this TOC Section

  • 11C-Methionine PET of Myocardial Inflammation in a Rat Model of Experimental Autoimmune Myocarditis
  • Counting Rate Characteristics and Image Distortion in Preclinical PET Imaging During Radiopharmaceutical Therapy
  • Design and Fabrication of Kidney Phantoms for Internal Radiation Dosimetry Using 3D Printing Technology
Show more Basic Science Investigations

Similar Articles

SNMMI

© 2025 SNMMI

Powered by HighWire