


Article Figures & Data
Figures
- FIGURE 1.
Brain systematization. (A) Lateral side. (B) Medial side. Broca = Broca region; Calc = calcarine region; CinA = anterior cingulate region; EF = external frontal region; IF = internal frontal region; Insul = insular region; LobQ = lobulus quadrilatere; LT = lateral temporal region; MT = medial temporal region; Occ = occipital region; OF = orbitofrontal region; P = parietal lobe; PreC = precentral region; PreF = prefrontal region; SM = sensorimotor region; Tha = thalamus; TP = temporal pole; W = Wernicke region.
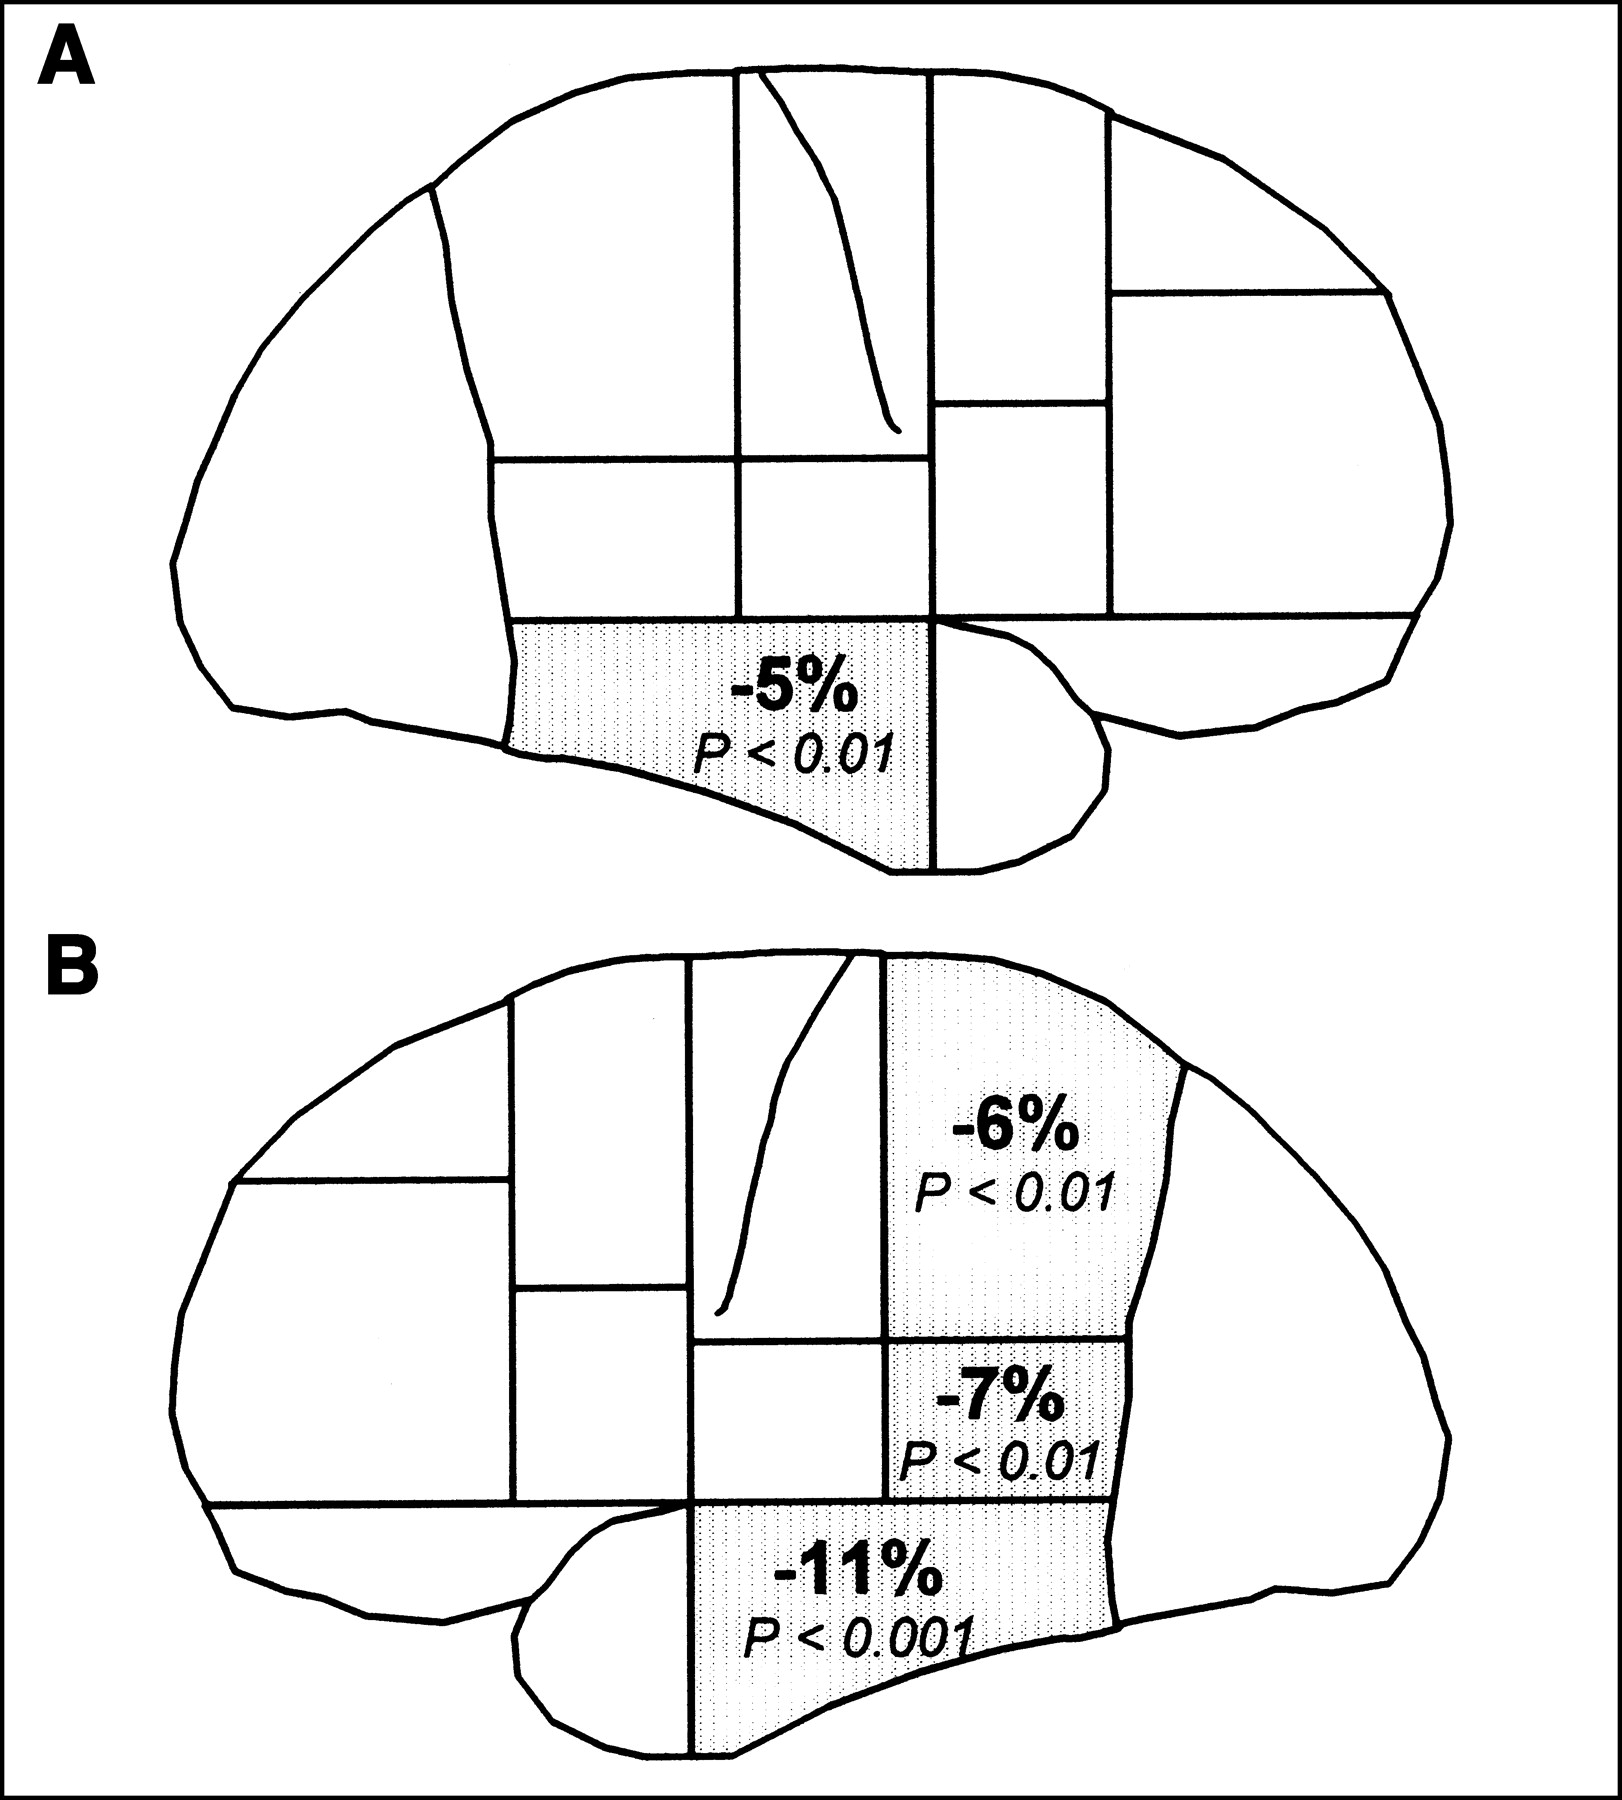
- FIGURE 2.
Percentage of PI decrease in 29 patients vs. 12 control subjects. (A) Right hemisphere. (B) Left hemisphere.
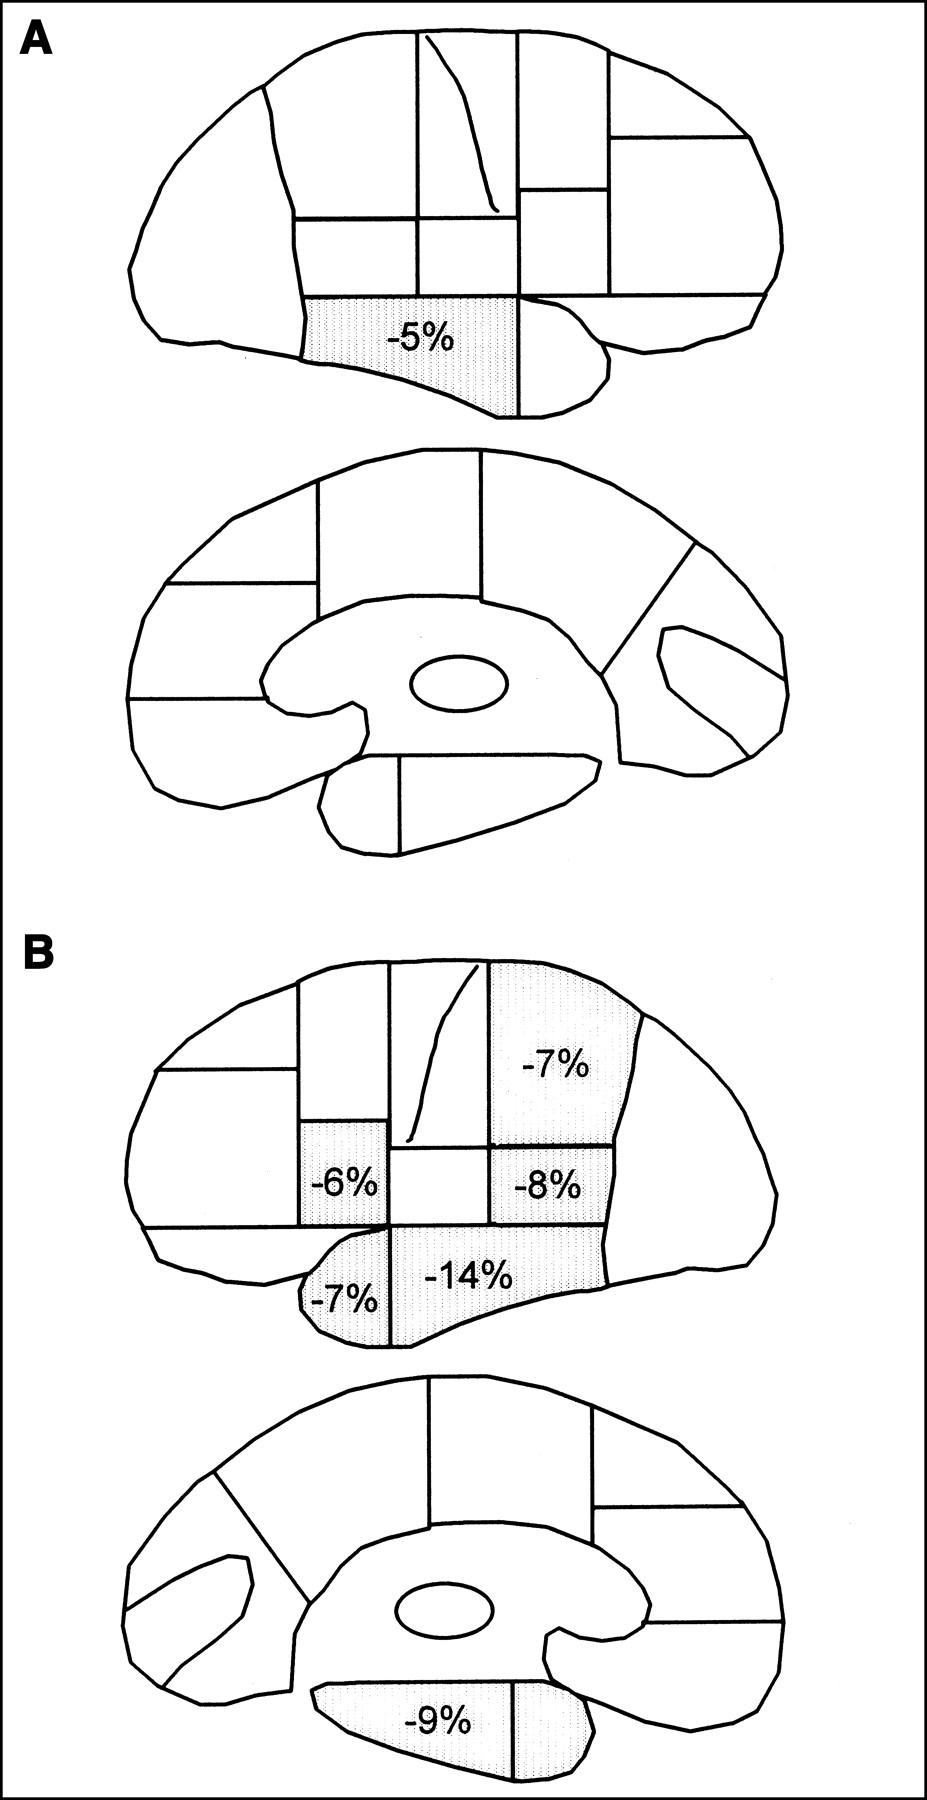
- FIGURE 3.
Comparison of PI in patients with lexicosemantic disorders and control subjects. (A) Right hemisphere, lateral and medial side. (B) Left hemisphere, lateral and medial side.
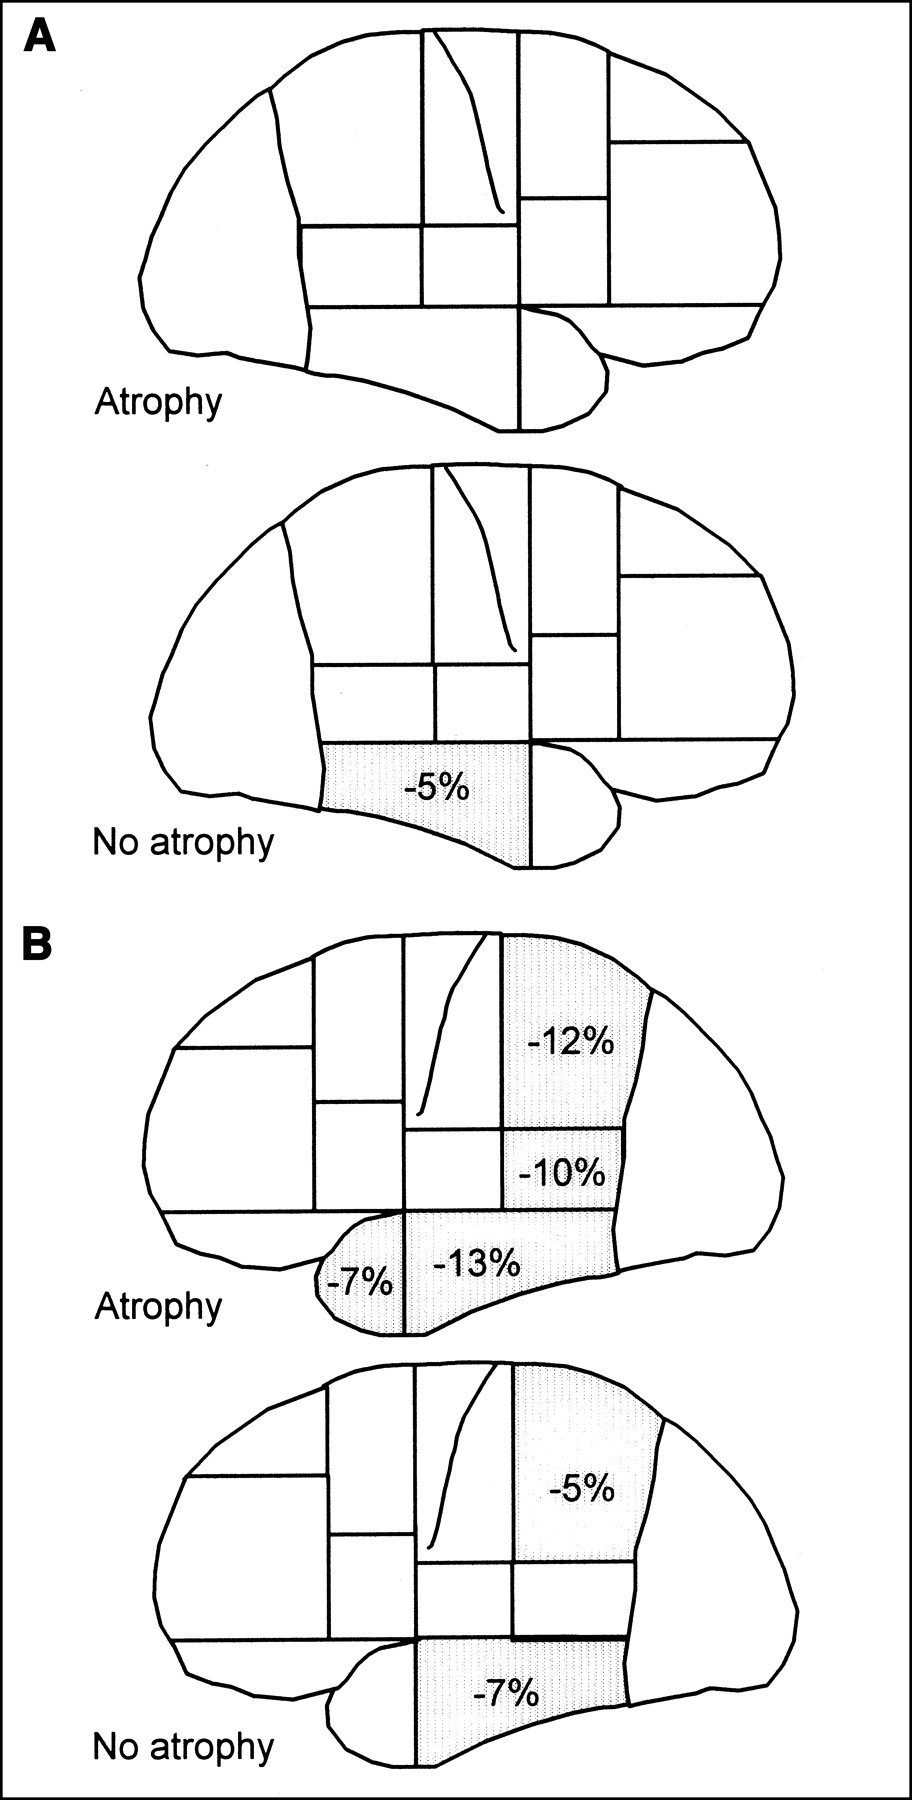
- FIGURE 4.
Comparison of PI in patients with or without atrophy and control subjects. (A) Right hemisphere, atrophic and nonatrophic groups. (B) Left hemisphere, atrophic and nonatrophic groups.


Tables
Patient no. Lexicosemantic Arthritic BDAE02 (n = 72) DES1 (n = 48) DES2 (n = 27) Verbal Cat (n = 220) Visual Cat (n = 220) Verbal App (n = 20) Visual App (n = 20) LS+/LS− BDAE08 (n = 14) BDAE06 (n = 7) Rep (%) A+/A− 1 72 47 27 208 213 20 20 LS− 9 5 32 A+ 2 72 48 27 212 206 18 19 LS− 9 6 12 A+ 3 66 47 ND 206 202 18 19 LS− 7 4 47 A+ 4 72 47 ND 208 198 19 19 LS− 8 6 12.5 A+ 5 72 47 27 201 201 20 19 LS− 6 3 59.5 A+ 6 70 48 27 211 207 19 18 LS− 2 3 84.6 A+ 7 71 48 25 198 201 19 19 LS− 3 5 100 A+ 8 71 48 27 194 181 18 19 LS− 8 4 54.5 A+ 9 70 47 27 179 184 17 19 LS+ 5 5 78.8 A+ 10 69 47 ND 149 212 20 20 LS+ 9 6 7.5 A+ 11 71 48 22 187 187 16 18 LS+ 12 7 0 A− 12 35 Imp Imp Imp Imp Imp Imp LS+ 12 7 0 A− 13 69 47 ND 179 165 17 19 LS+ Imp 7 0 A− 14 66 46 26 189 174 18 18 LS+ 9 7 0 A− 15 65 46 27 192 202 18 19 LS+ 12 7 0 A− 16 66 47 ND 192 190 16 18 LS+ 10 7 0 A− 17 38 Imp Imp Imp Imp Imp Imp LS+ Imp 7 0 A− 18 48 33 ND 152 187 13 13 LS+ 11 7 0 A− 19 71 48 24 193 189 19 20 LS+ 10 7 0 A− 20 48 Imp Imp 13 15 Imp Imp LS+ 12 7 0 A− 21 38 22 14 105 144 11 9 LS+ 14 7 0 A− 22 38 27 21 Imp Imp Imp Imp LS+ Imp 7 0 A− 23 45 32 16 101 167 10 15 LS+ 14 7 0 A− 24 69 48 27 205 202 20 18 LS− 13 7 0 A− 25 71 46 ND 209 205 19 19 LS− 14 7 0 A− 26 72 48 ND 204 208 20 20 LS− 14 7 0 A− 27 72 48 26 219 210 19 20 LS− 14 7 0 A− 28 71 48 27 207 208 20 19 LS− 14 7 0 A− 29 70 48 26 197 202 19 20 LS− 14 7 0 A− ND = not done; Imp = impossible; BDAE = Boston Diagnostic Aphasia Examination; DES = Designation.
See text for description of neuropsychologic tests.
Region Left Right Patients (n = 29) Mean ± SD Control subjects (n = 12) Mean ± SD F P Patients (n = 29) Mean ± SD Control subjects (n = 12) Mean ± SD F P Temp W 0.905 ± 0.075 0.973 ± 0.028 9.370 0.0040 0.967 ± 0.057 0.972 ± 0.023 0.077 0.7824 TP 0.776 ± 0.052 0.812 ± 0.031 5.096 0.0297 0.819 ± 0.053 0.828 ± 0.034 0.263 0.6110 LT 0.833 ± 0.062 0.929 ± 0.033 25.181 <0.0001 0.883 ± 0.045 0.928 ± 0.022 11.031 0.0020 MT 0.748 ± 0.077 0.790 ± 0.038 3.250 0.0792 0.776 ± 0.068 0.789 ± 0.036 0.426 0.5176 Front Broc 0.856 ± 0.058 0.888 ± 0.030 3.335 0.0755 0.903 ± 0.056 0.918 ± 0.020 0.826 0.3691 Insul 0.869 ± 0.051 0.861 ± 0.049 0.240 0.6272 0.897 ± 0.060 0.887 ± 0.047 0.234 0.6315 PreC 0.858 ± 0.061 0.883 ± 0.049 1.586 0.2154 0.892 ± 0.058 0.902 ± 0.042 0.287 0.5951 PreF 0.844 ± 0.065 0.859 ± 0.037 0.565 0.4569 0.869 ± 0.062 0.880 ± 0.043 0.313 0.5792 EF 0.905 ± 0.072 0.924 ± 0.037 0.770 0.3856 0.942 ± 0.062 0.957 ± 0.026 0.693 0.4101 IF 0.887 ± 0.068 0.918 ± 0.042 2.181 0.1477 0.908 ± 0.057 0.921 ± 0.051 0.456 0.5033 OF 0.811 ± 0.078 0.809 ± 0.033 0.009 0.9256 0.828 ± 0.062 0.825 ± 0.036 0.023 0.8794 CinA 0.800 ± 0.063 0.817 ± 0.057 0.629 0.4326 0.814 ± 0.057 0.816 ± 0.044 0.005 0.9418 SM 0.852 ± 0.059 0.876 ± 0.033 1.678 0.2029 0.881 ± 0.059 0.880 ± 0.034 0.003 0.9550 Par Par 0.880 ± 0.062 0.940 ± 0.025 10.147 0.0028 0.926 ± 0.060 0.941 ± 0.035 0.673 0.4170 LobQ 0.913 ± 0.083 0.913 ± 0.067 4.543 0.9831 0.920 ± 0.080 0.904 ± 0.060 0.393 0.5343 Occ OcA 0.999 ± 0.057 1.005 ± 0.029 0.134 0.7167 1.009 ± 0.052 1.001 ± 0.030 0.254 0.6171 Calc 1.148 ± 0.058 1.122 ± 0.044 1.896 0.1764 1.151 ± 0.062 1.112 ± 0.044 3.933 0.0544 Tha 0.821 ± 0.051 0.813 ± 0.043 0.278 0.6012 0.825 ± 0.050 0.828 ± 0.045 0.036 0.8500 F = F test; Temp = temporal region; W = Wernicke region; TP = temporal pole; LT = lateral temporal region; MT = medial temporal region; Front = frontal region; Broc = Broca region; Insul = insular region; PreC = precentral region; PreF = prefrontal region; EF = external frontal region; IF = internal frontal region; OF = orbitofrontal region; CinA = anterior cingulate region; SM = sensorimotor region; Par = parietal lobe; LobQ = lobulus quadrilatere; Occ = occipital region; OcA = occipital cortex; Calc = calcarine region; Tha = thalamus.
Bold values correspond to significant differences when a global test was performed.
- TABLE 3
Comparison of PI in Patients With (LS+) or Without (LS−) Lexicosemantic Disorders vs. Control Subjects
Region Left Right LS+ (n = 15) Mean ± SD LS− (n = 14) Mean ± SD Control subjects (n = 12) Mean ± SD F P LS+ (n = 15) Mean ± SD LS− (n = 14) Mean ± SD Control subjects (n = 12) Mean ± SD F P Temp W 0.886* ± 0.073 0.925 ± 0.074 0.973 ± 0.028 6.242 0.0045 0.967 ± 0.065 0.967 ± 0.050 0.972 ± 0.023 0.038 0.9627 TP 0.755* ± 0.049 0.797 ± 0.047 0.812 ± 0.031 6.248 0.0045 0.823 ± 0.056 0.814 ± 0.051 0.828 ± 0.034 0.253 0.7781 LT 0.805*† ± 0.062 0.864* ± 0.049 0.929 ± 0.033 20.435 <0.0001 0.885* ± 0.045 0.881* ± 0.046 0.928 ± 0.022 5.436 0.0084 MT 0.717*† ± 0.075 0.781 ± 0.065 0.790 ± 0.038 5.753 0.0066 0.779 ± 0.065 0.772 ± 0.074 0.789 ± 0.036 0.249 0.7810 Front Broc 0.833*† ± 0.068 0.881 ± 0.031 0.888 ± 0.030 5.545 0.0077 0.897 ± 0.069 0.909 ± 0.039 0.918 ± 0.020 0.621 0.5430 Insul 0.858 ± 0.062 0.881 ± 0.033 0.861 ± 0.049 0.914 0.4095 0.898 ± 0.078 0.896 ± 0.033 0.887 ± 0.047 0.120 0.8876 PreC 0.850 ± 0.077 0.867 ± 0.039 0.883 ± 0.049 1.099 0.3436 0.893 ± 0.074 0.891 ± 0.037 0.902 ± 0.042 0.145 0.8659 PreF 0.825 ± 0.081 0.865 ± 0.031 0.859 ± 0.037 2.158 0.1295 0.859 ± 0.081 0.880 ± 0.031 0.880 ± 0.043 0.566 0.5252 EF 0.884 ± 0.088 0.927 ± 0.043 0.924 ± 0.037 2.157 0.1307 0.934 ± 0.077 0.951 ± 0.039 0.957 ± 0.026 0.688 0.5087 IF 0.861 ± 0.076 0.915 ± 0.047 0.918 ± 0.042 4.397 0.0191 0.900 ± 0.069 0.916 ± 0.042 0.921 ± 0.051 0.538 0.5880 OF 0.791 ± 0.103 0.834 ± 0.028 0.809 ± 0.033 1.495 0.2371 0.824 ± 0.084 0.832 ± 0.027 0.825 ± 0.036 0.086 0.9173 CinA 0.797 ± 0.076 0.804 ± 0.047 0.817 ± 0.057 0.352 0.7056 0.808 ± 0.072 0.821 ± 0.036 0.816 ± 0.044 0.227 0.7982 SM 0.850 ± 0.072 0.855 ± 0.043 0.876 ± 0.033 0.851 0.4352 0.881 ± 0.075 0.881 ± 0.037 0.880 ± 0.034 0.002 0.9977 Par Par 0.866* ± 0.073 0.896 ± 0.047 0.940 ± 0.025 6.339 0.0042 0.925 ± 0.075 0.926 ± 0.042 0.941 ± 0.035 0.332 0.7199 LobQ 0.904 ± 0.092 0.922 ± 0.074 0.913 ± 0.067 0.190 0.8275 0.920 ± 0.095 0.921 ± 0.064 0.904 ± 0.060 0.192 0.8262 Occ OcA 0.985 ± 0.057 1.014 ± 0.055 1.005 ± 0.029 1.282 0.2892 1.002 ± 0.062 1.016 ± 0.041 1.001 ± 0.030 0.464 0.6321 Calc 1.133 ± 0.054 1.163 ± 0.061 1.122 ± 0.044 2.057 0.1419 1.135 ± 0.068 1.169 ± 0.053 1.1120 ± 0.044 3.342 0.0460 Tha 0.809 ± 0.063 0.834 ± 0.032 0.813 ± 0.043 1.100 0.3433 0.819 ± 0.058 0.832 ± 0.039 0.828 ± 0.045 0.296 0.7458 - TABLE 4
Comparison of PI in Patients With (A+) or Without (A−) Arthritic Disorders vs. Control Subjects
Region Left Right A+ (n = 10) Mean ± SD A− (n = 19) Mean ± SD Control subjects (n = 12) Mean ± SD F P A+ (n = 10) Mean ± SD A− (n = 19) Mean ± SD Control subjects (n = 12) Mean ± SD F P Temp W 0.936 ± 0.069 0.888* ± 0.074 0.973 ± 0.028 6.880 0.0028 0.980 ± 0.051 0.960 ± 0.060 0.972 ± 0.023 0.564 0.5735 TP 0.795 ± 0.049 0.765 ± 0.051 0.812 ± 0.031 4.056 0.0253 0.820 ± 0.025 0.818 ± 0.064 0.828 ± 0.034 0.132 0.8772 LT 0.885† ± 0.034 0.806* ± 0.057 0.929 ± 0.033 28.293 <0.0001 0.895 ± 0.034 0.877* ± 0.049 0.928 ± 0.022 6.263 0.0045 MT 0.788 ± 0.082 0.727 ± 0.067 0.790 ± 0.038 4.821 0.0136 0.781 ± 0.056 0.773 ± 0.075 0.789 ± 0.036 0.269 0.7657 Front Broc 0.859 ± 0.065 0.854 ± 0.056 0.888 ± 0.030 1.654 0.2047 0.894 ± 0.040 0.908 ± 0.064 0.918 ± 0.020 0.670 0.5177 Insul 0.879 ± 0.037 0.864 ± 0.057 0.861 ± 0.049 0.397 0.6753 0.895 ± 0.028 0.898 ± 0.072 0.887 ± 0.047 0.122 0.8853 PreC 0.848 ± 0.055 0.864 ± 0.065 0.883 ± 0.049 1.019 0.3707 0.874 ± 0.041 0.901 ± 0.064 0.902 ± 0.042 0.980 0.3845 PreF 0.840 ± 0.064 0.846 ± 0.067 0.859 ± 0.037 0.313 0.7329 0.857 ± 0.051 0.875 ± 0.068 0.880 ± 0.043 0.483 0.6208 EF 0.891 ± 0.084 0.912 ± 0.067 0.924 ± 0.037 0.733 0.4871 0.923 ± 0.035 0.952 ± 0.071 0.957 ± 0.026 1.330 0.2765 IF 0.894 ± 0.082 0.883 ± 0.062 0.918 ± 0.042 1.166 0.3225 0.903 ± 0.058 0.911 ± 0.059 0.921 ± 0.051 0.282 0.7562 OF 0.811 ± 0.048 0.812 ± 0.091 0.809 ± 0.033 0.005 0.9955 0.818 ± 0.018 0.833 ± 0.076 0.825 ± 0.036 0.249 0.7809 CinA 0.808 ± 0.053 0.796 ± 0.068 0.817 ± 0.057 0.436 0.6498 0.827 ± 0.032 0.808 ± 0.066 0.816 ± 0.044 0.417 0.6619 SM 0.850 ± 0.044 0.854 ± 0.066 0.876 ± 0.033 0.834 0.4423 0.881 ± 0.038 0.881 ± 0.068 0.880 ± 0.034 0.002 0.9984 Par Par 0.906 ± 0.036 0.867* ± 0.070 0.940 ± 0.025 7.212 0.0022 0.936 ± 0.050 0.920 ± 0.066 0.941 ± 0.035 0.613 0.5471 LobQ 0.932 ± 0.068 0.903 ± 0.090 0.913 ± 0.067 0.457 0.6365 0.948 ± 0.046 0.906 ± 0.091 0.904 ± 0.060 1.265 0.2939 Occ OcA 1.032 ± 0.039 0.981 ± 0.058 1.005 ± 0.029 3.932 0.0280 1.024 ± 0.035 1.001 ± 0.059 1.101 ± 0.030 0.921 0.4066 Calc 1.149 ± 0.057 1.147 ± 0.061 1.122 ± 0.044 0.929 0.4038 1.161 ± 0.052 1.146 ± 0.068 1.112 ± 0.044 2.162 0.1290 Tha 0.825 ± 0.042 0.819 ± 0.057 0.813 ± 0.043 0.176 0.8392 0.825 ± 0.033 0.825 ± 0.057 0.828 ± 0.045 0.018 0.9824 - TABLE 5
Comparison of PI in Patients With (Atrop+) or Without (Atrop−) Atrophy vs. Control Subjects
Region Left Right Atrop+ Atrop− Control subjects (n = 12) Mean ± SD F P Atrop+ Atrop− Control subjects (n = 12) Mean ± SD F P Mean ± SD n Mean ± SD n Mean ± SD n Mean ± SD n Temp W 0.869* ± 0.070 10 0.924 ± 0.072 19 0.973 ± 0.028 7.723 0.0015 0.990 ± 0.057 2 0.965 ± 0.058 27 0.972 ± 0.023 0.264 0.7690 TP 0.755*† ± 0.043 17 0.804 ± 0.051 12 0.812 ± 0.031 7.784 0.0015 0.815 ± 0.034 11 0.821 ± 0.063 18 0.828 ± 0.034 0.174 0.8411 LT 0.808*† ± 0.055 15 0.860* ± 0.060 14 0.929 ± 0.033 18.286 <0.0001 0.877 ± 0.031 3 0.884 ± 0.046 26 0.928 ± 0.022 5.429 0.0084 MT 0.717 ± 0.060 4 0.753 ± 0.079 25 0.790 ± 0.038 2.086 0.1382 — 0 0.776 ± 0.068 29 0.789 ± 0.036 0.426 0.5176 Front Broc 0.838 ± 0.105 5 0.860 ± 0.046 24 0.888 ± 0.030 2.011 0.1478 0.855 ± 0.049 2 0.907 ± 0.056 27 0.918 ± 0.020 1.498 0.2365 Insul 0.861 ± 0.056 7 0.872 ± 0.050 22 0.861 ± 0.049 0.228 0.7974 — 0 0.897 ± 0.060 29 0.887 ± 0.047 0.234 0.6315 PreC 0.839 ± 0.043 7 0.865 ± 0.065 22 0.883 ± 0.049 1.328 0.2770 0.879 ± 0.055 7 0.896 ± 0.060 22 0.902 ± 0.042 0.412 0.6654 PreF 0.813 ± 0.056 12 0.866 ± 0.063 17 0.859 ± 0.037 3.589 0.0373 0.839 ± 0.055 8 0.880 ± 0.062 21 0.880 ± 0.043 1.779 0.1826 EF 0.865 ± 0.095 10 0.926 ± 0.048 19 0.924 ± 0.037 3.809 0.0311 0.903 ± 0.055 6 0.952 ± 0.060 23 0.957 ± 0.026 2.482 0.0970 IF 0.807 ± 0.076 3 0.896 ± 0.062 26 0.918 ± 0.042 4.427 0.0187 0.835 ± 0.035 2 0.913 ± 0.055 27 0.921 ± 0.051 2.231 0.1213 OF — 0 0.811 ± 0.078 29 0.809 ± 0.033 0.009 0.9256 — 0 0.828 ± 0.062 29 0.825 ± 0.036 0.023 0.8794 CinA 0.770 1 0.801 ± 0.064 28 0.817 ± 0.057 0.430 0.6536 0.810 1 0.815 ± 0.058 28 0.816 ± 0.044 0.006 0.9939 SM 0.818 ± 0.019 4 0.858 ± 0.061 25 0.876 ± 0.033 1.910 0.1620 0.910 1 0.880 ± 0.060 28 0.880 ± 0.034 0.153 0.8584 Par Par 0.832*† ± 0.085 6 0.893* ± 0.050 23 0.940 ± 0.025 9.316 0.0005 0.933 ± 0.076 3 0.925 ± 0.060 26 0.941 ± 0.035 0.362 0.6986 LobQ 0.877 ± 0.095 3 0.917 ± 0.082 26 0.913 ± 0.067 0.351 0.7064 0.850 1 0.923 ± 0.081 28 0.904 ± 0.060 0.648 0.5285 Occ OcA 1.000 1 0.999 ± 0.058 28 1.005 ± 0.029 0.065 0.9367 1.020 1 1.009 ± 0.053 28 1.001 ± 0.030 0.152 0.8597


