


Article Figures & Data
Figures
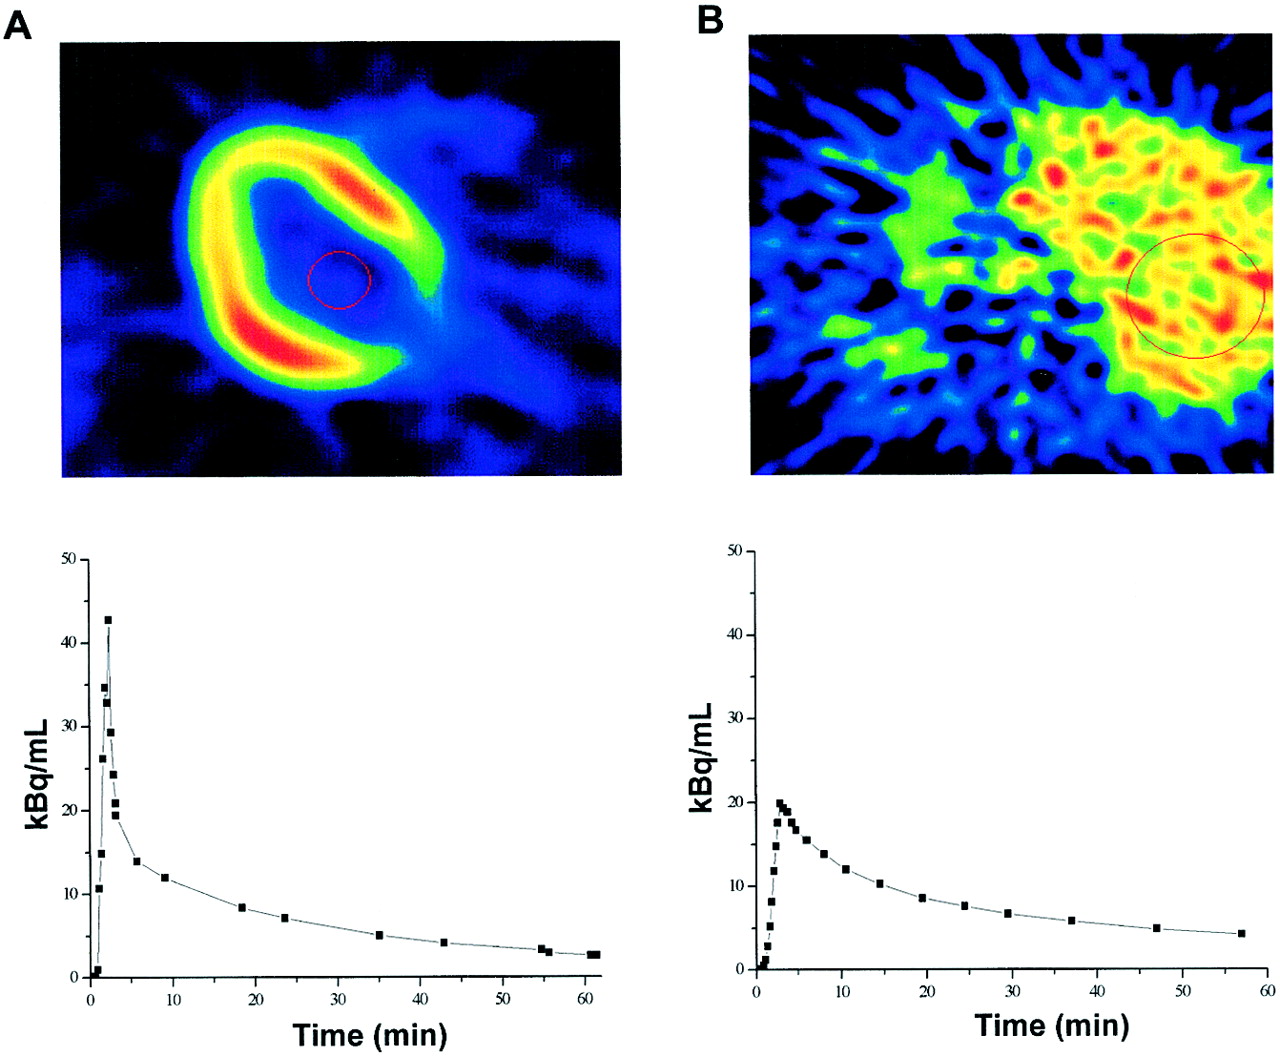
- FIGURE 1.
(Top) Transaxial images at level of heart (A) and liver (B) show image quality and ROIs. (Bottom) Time–activity curves were derived from ROIs placed inside left ventricular chamber (A) and right lobe of liver (B).
- FIGURE 2.
Single-patient insulin-stimulated hepatic influx rate constant (H-Ki) changes (▿) in subjects who underwent repeated study (low IS) show consistent upward shift in all subjects and significant 98% ± 74% average increase (▪ P < 0.01, Student paired t test).
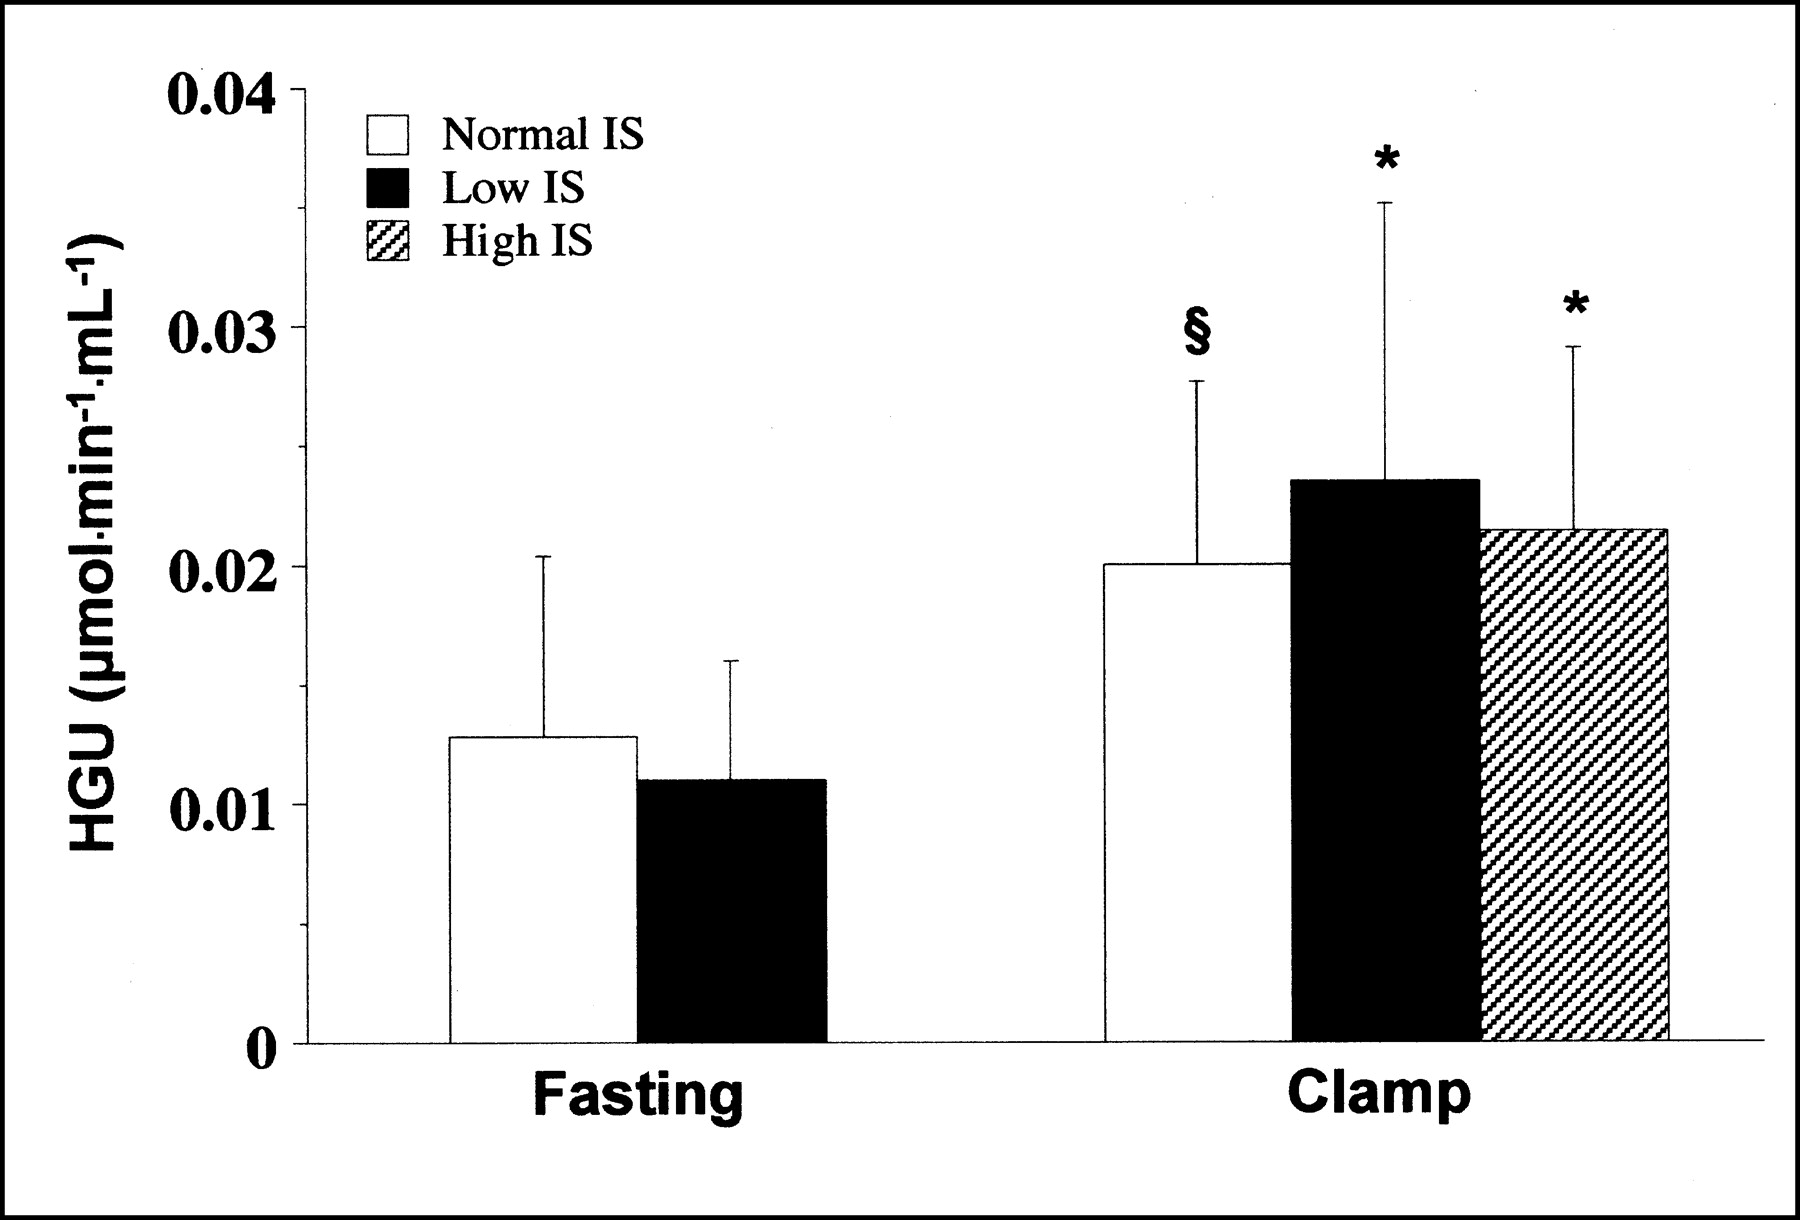
- FIGURE 3.
Net HGU as measured by graphical analysis in each study population. *P < 0.05 vs. fasting. §P = 0.1 vs. fasting.
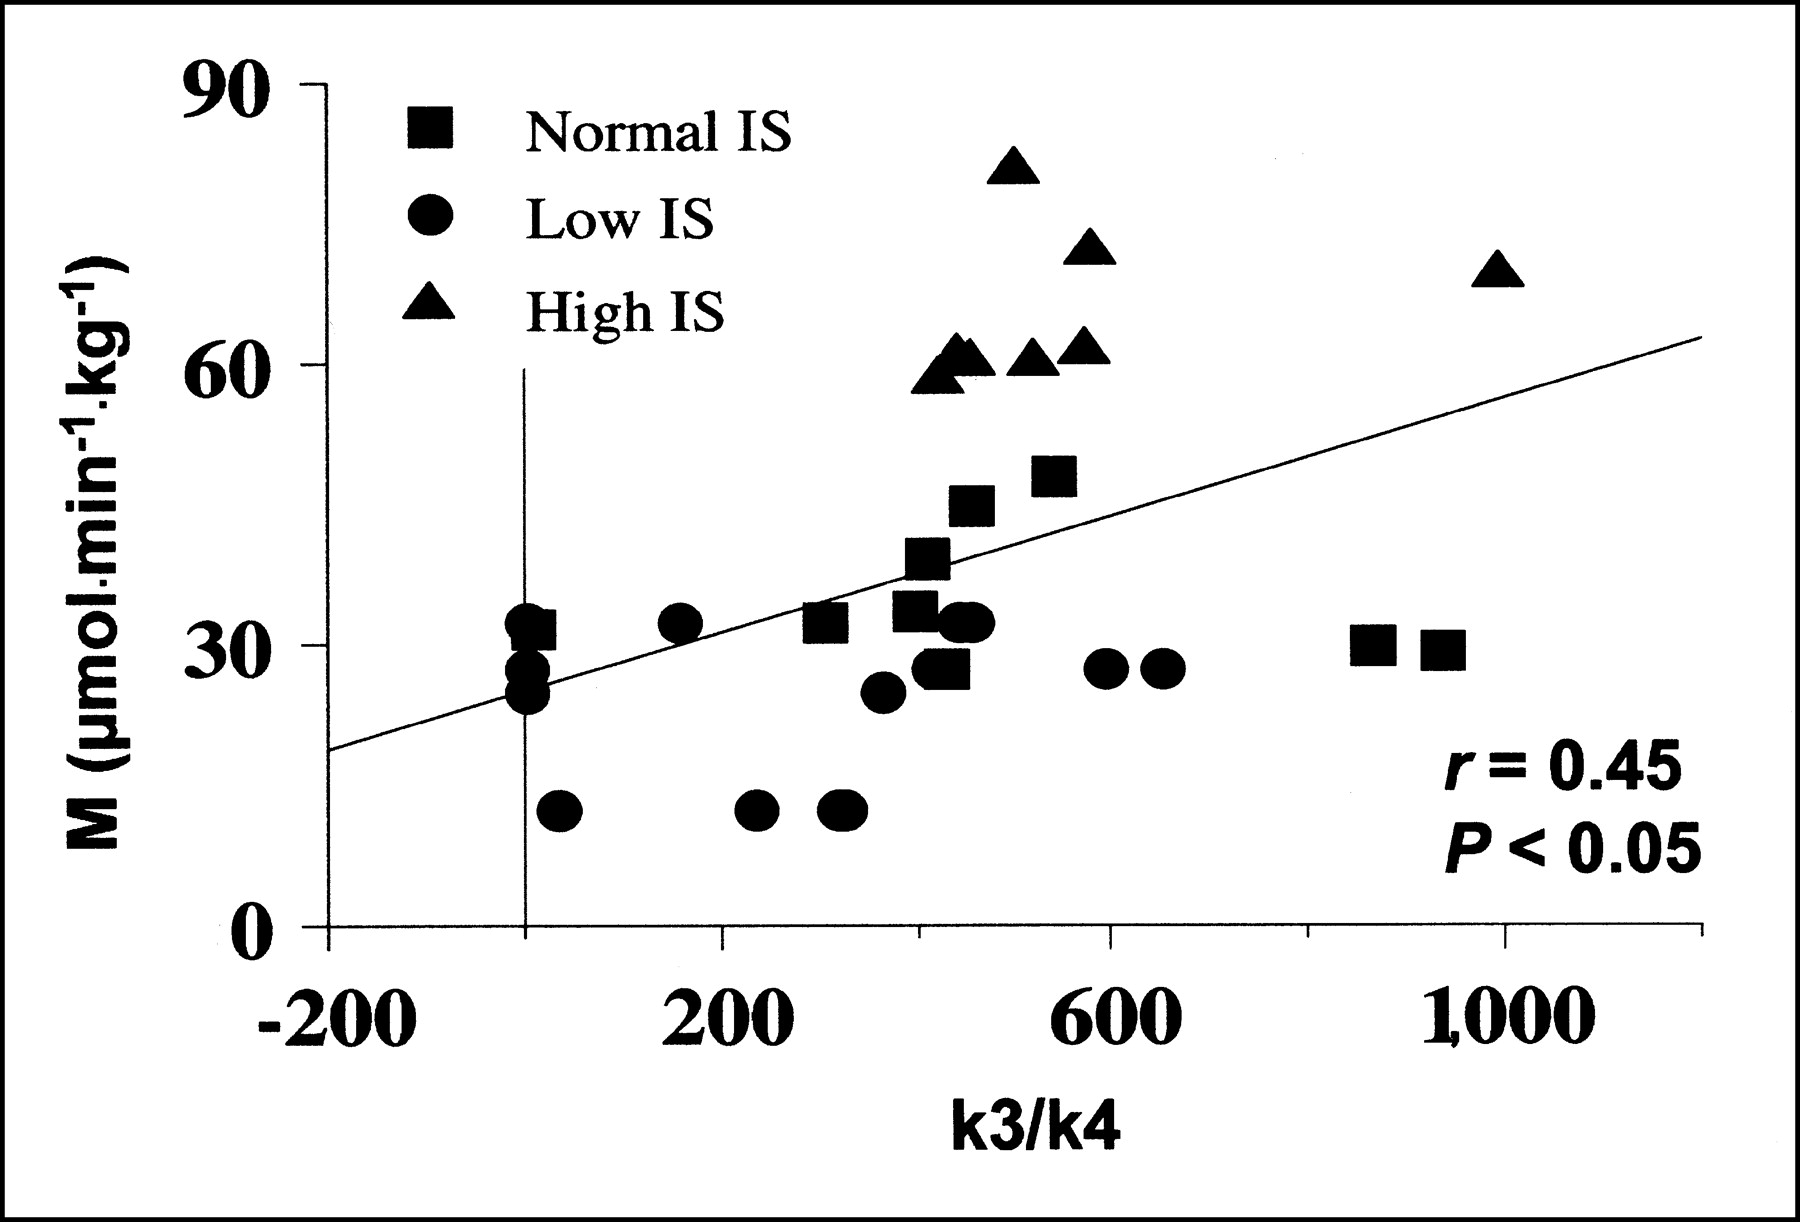
- FIGURE 4.
Correlation between whole-body glucose uptake during clamp (M value) and hepatic glucose phosphorylation/dephosphorylation ratios.
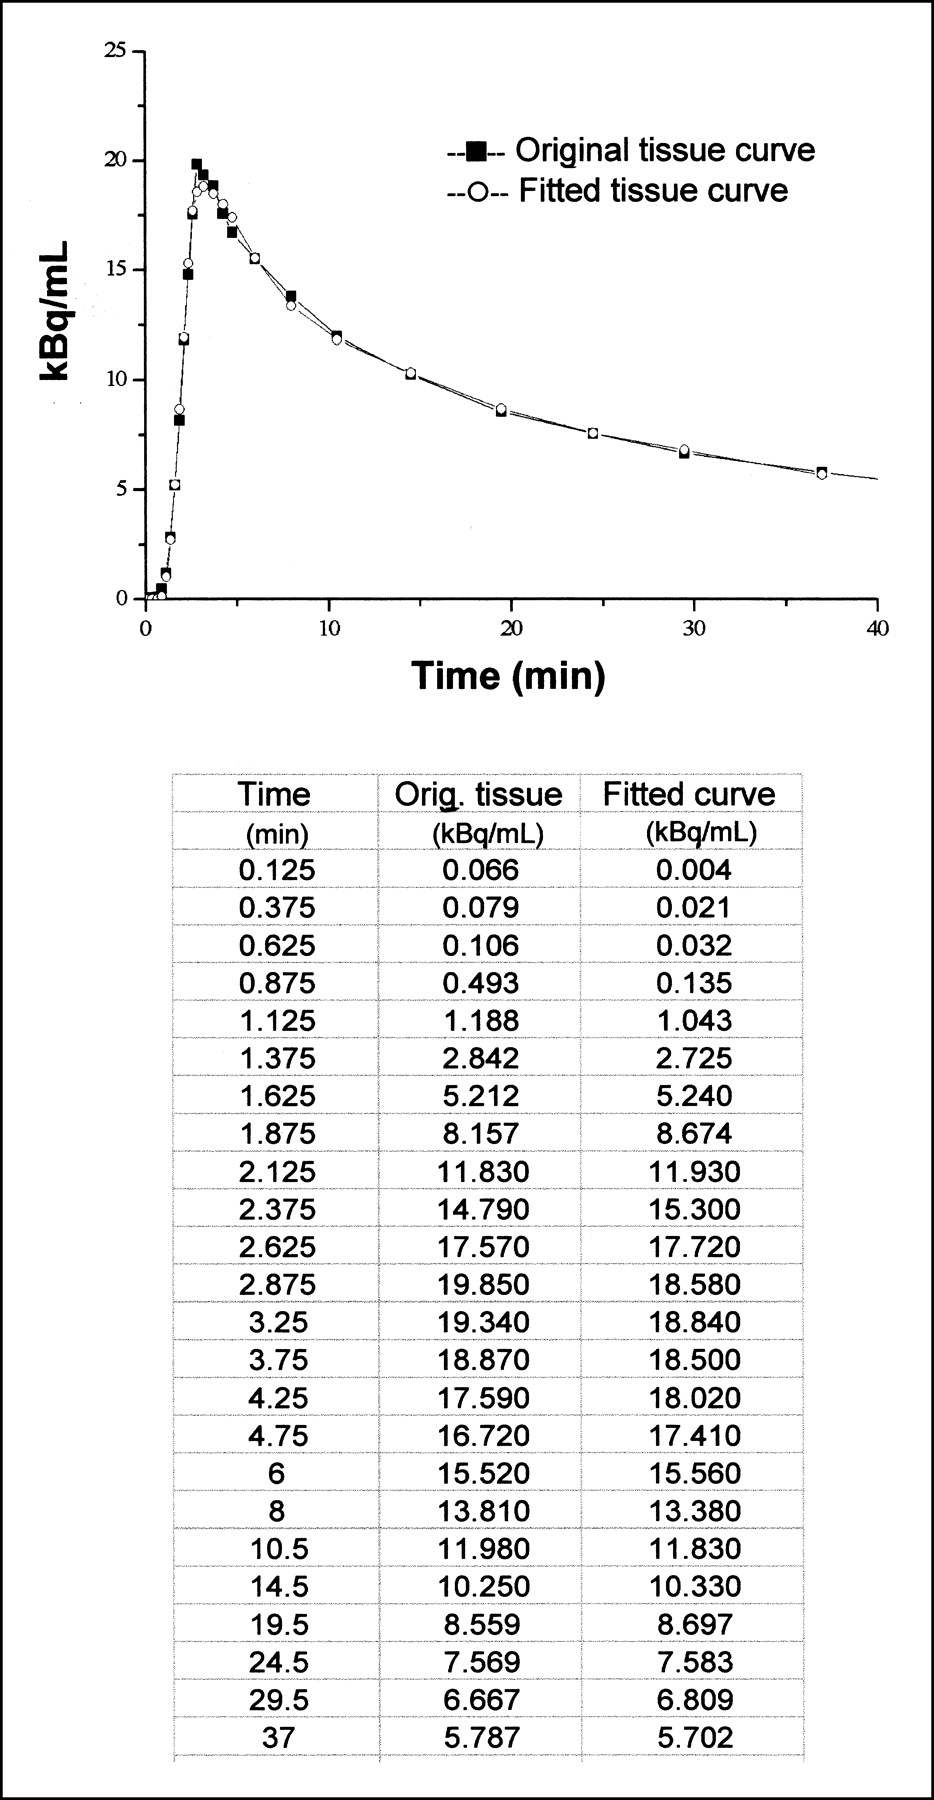
- FIGURE 5.
Graph shows nonlinear least squares fit for 3-compartment model and corresponding measured data. Table gives numeric values for the example shown.
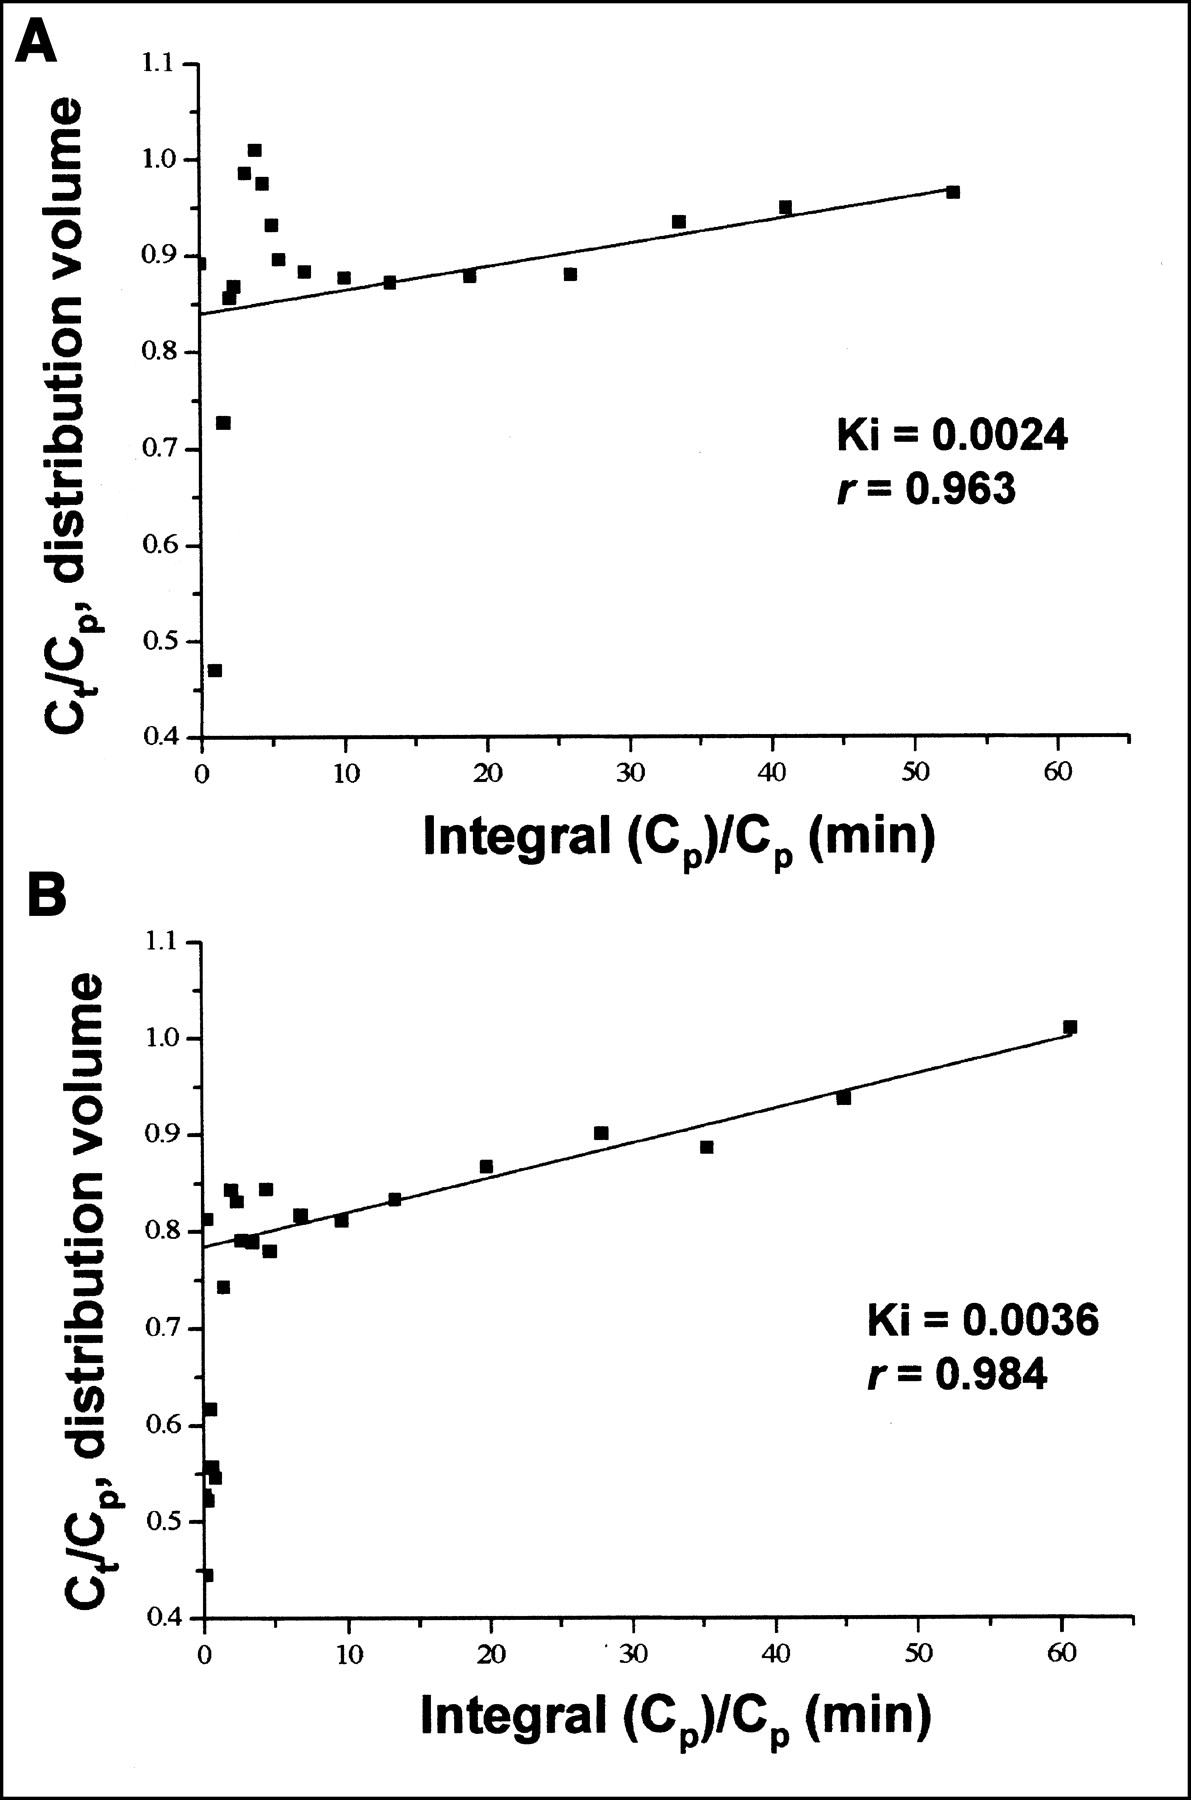
- FIGURE 6.
Linear least squares fit for Patlak plot and corresponding measured data during fasting (A) and clamp (B) in 1 study subject.
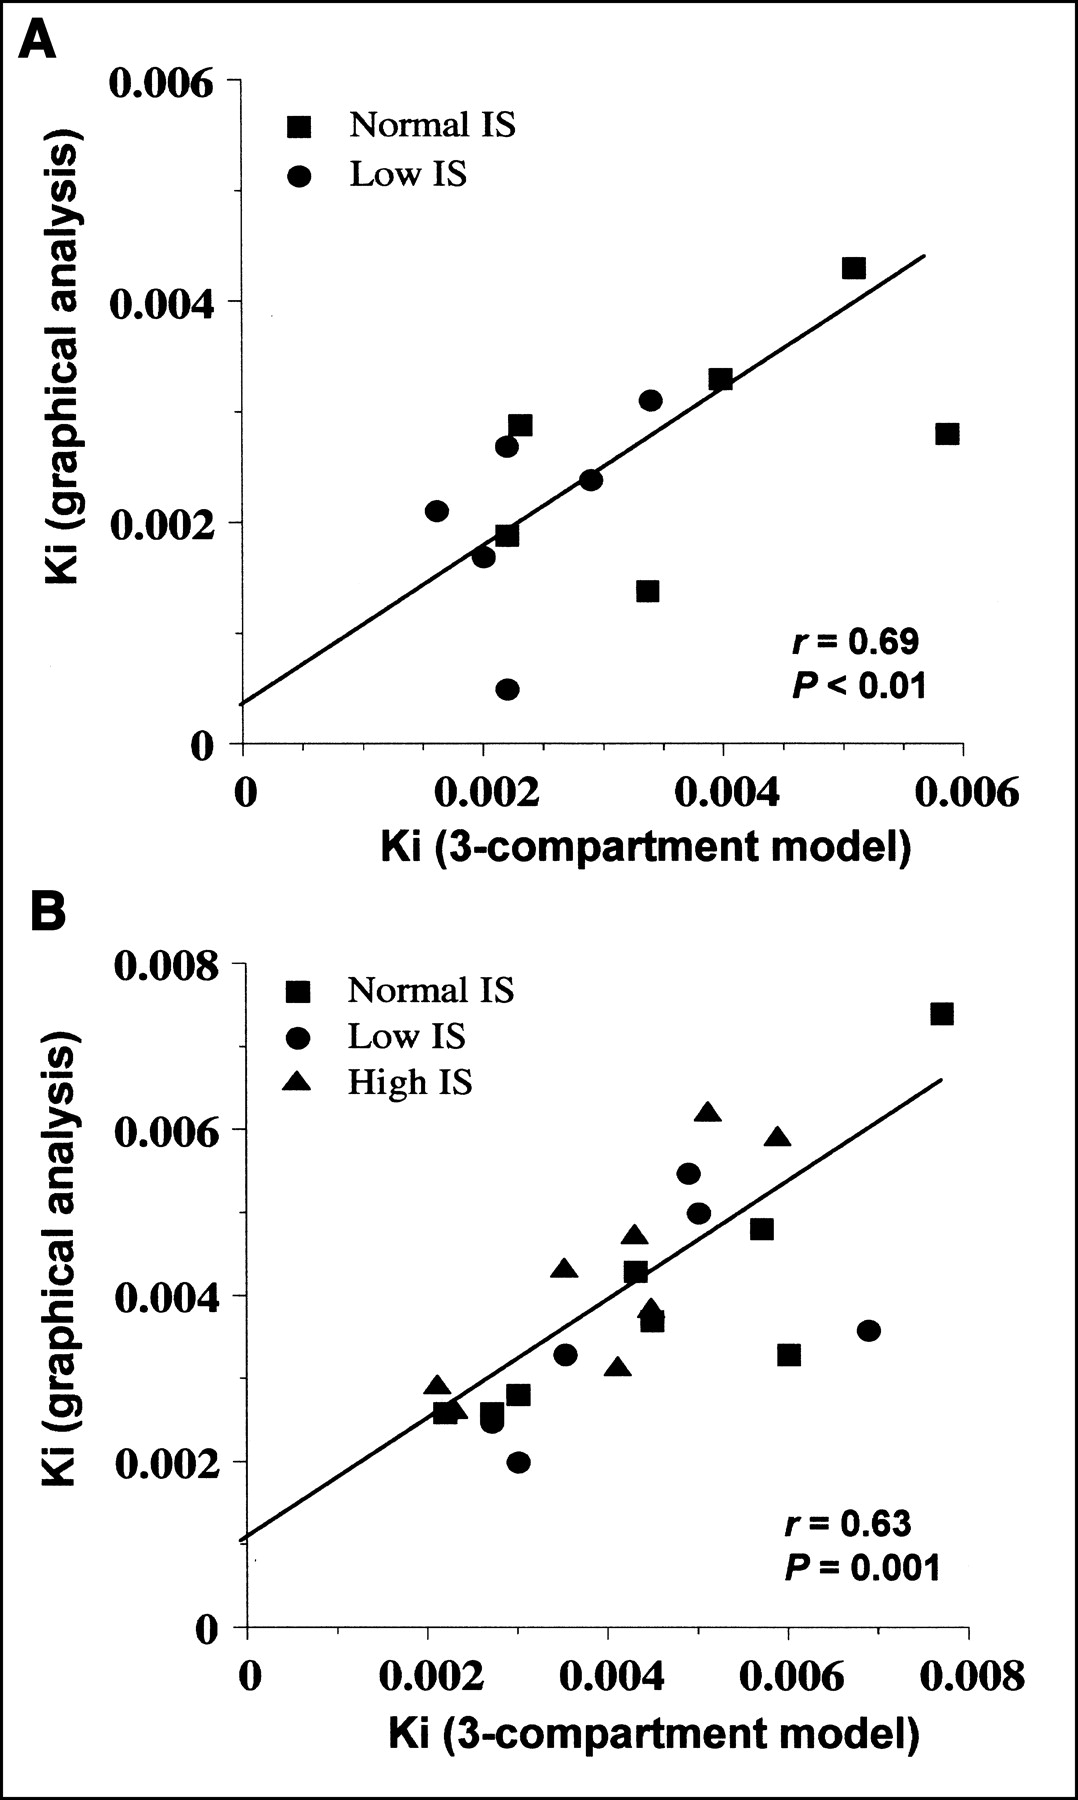
- FIGURE 7.
Correlations between 3-compartment model and graphical analysis influx rate constants during fasting (A) and clamp (B) in whole study group.


Tables
Variable PET during fasting: normal IS PET during clamp PET during fasting and clamp: low IS Normal IS High IS n 7 9 8 7 Age (y) 34 ± 8 28 ± 4 28 ± 2 62 ± 9* EF (%) — 62 ± 6 65 ± 3 62 ± 8 Weight (kg) 82 ± 9 77 ± 9 76 ± 6 81 ± 10 Height (cm) 181 ± 7 182 ± 5 186 ± 4 179 ± 5† Fasting plasma levels Glucose (mmol·L−1) 5.4 ± 0.5 5.2 ± 0.3 5.3 ± 0.4 5.2 ± 0.5 Insulin (pmol·L−1) 18 ± 15‡ 45 ± 15 30 ± 18 44 ± 16 FFA (mmol·L−1) 0.70 ± 0.23† 0.54 ± 0.19 0.39 ± 0.12 0.67 ± 0.17† Clamp plasma levels Glucose (mmol·L−1) — 5.1 ± 0.8 5.1 ± 0.3 5.4 ± 0.8 Insulin (pmol·L−1) — 420 ± 100§ 430 ± 160§ 460 ± 120§ FFA (mmol·L−1) — 0.11 ± 0.04§ 0.10 ± 0.03§ 0.07 ± 0.03*§ M (μmol·min−1·kg−1) — 35 ± 7 65 ± 8‖ 24 ± 3†‖ Group n Nonlinear least squares fit Graphical analysis k1 k2 k3 k4 VB Ki Ki[G] Ki Ki[G] Fasting All groups 14 0.63 ± 0.14 0.78 ± 0.18 0.36 ± 0.19 0.23 ± 0.62 7 ± 8 0.29 ± 0.14 1.5 ± 0.7 0.22 ± 0.12 1.2 ± 0.6 Normal IS 7 0.62 ± 0.12 0.76 ± 0.15 0.43 ± 0.24 0.47 ± 0.83 12 ± 8 0.34 ± 0.18 1.8 ± 0.9 0.23 ± 0.14 1.3 ± 0.8 Low IS 7 0.64 ± 0.16 0.79 ± 0.22 0.29 ± 0.07 0.001 ± 0.0003 1 ± 1 0.23 ± 0.06 1.2 ± 0.3 0.21 ± 0.09 1.1 ± 0.5 Clamp All groups 24 0.63 ± 0.19 0.79 ± 0.27 0.55 ± 0.24* 0.11 ± 0.33 10 ± 8 0.43 ± 0.15* 2.3 ± 0.9* 0.42 ± 0.18* 2.2 ± 0.9* Normal IS 9 0.60 ± 0.16 0.74 ± 0.20 0.57 ± 0.25 0.02 ± 0.06* 13 ± 22 0.45 ± 0.18 2.3 ± 1.1 0.39 ± 0.16† 2.0 ± 0.8 High IS 8 0.62 ± 0.21 0.77 ± 0.26 0.50 ± 0.17 0.001 ± 0.0003* 6 ± 6 0.40 ± 0.13 2.0 ± 0.7 0.42 ± 0.14* 2.1 ± 0.8* Low IS 7 0.68 ± 0.23 0.88 ± 0.36 0.59 ± 0.30* 0.34 ± 0.56 9 ± 16 0.44 ± 0.15* 2.4 ± 1.0* 0.45 ± 0.24* 2.4 ± 1.2*
In this issue


Jump to section
Related Articles
Cited By...
- Noninvasive Imaging of Drug-Induced Liver Injury with 18F-DFA PET
- Insulin-stimulated glucose uptake in skeletal muscle, adipose tissue and liver: a positron emission tomography study
- Positron Emission Tomography/Computerized Tomography in Newly Diagnosed Patients with Giant Cell Arteritis Who Are Taking Glucocorticoids
- Fasting hepatic glucose uptake is higher in men than women
- Hepatic glucose utilization in hepatic steatosis and obesity
- Fallacy of Quantifying Lymphoma Activity by Scaling to the Liver in [18F]Fluorodeoxyglucose Positron Emission Tomography (Deauville criteria)
- Methodologic Considerations for Quantitative 18F-FDG PET/CT Studies of Hepatic Glucose Metabolism in Healthy Subjects
- Positron emission tomography assessment of large vessel inflammation in patients with newly diagnosed, biopsy-proven giant cell arteritis: a prospective, case-control study
- Bringing Physiology into PET of the Liver
- Liver Fat Content in Type 2 Diabetes: Relationship With Hepatic Perfusion and Substrate Metabolism
- Impact of Intravenous Insulin on 18F-FDG PET in Diabetic Cancer Patients
- Assessment of Large-Vessel Involvement in Giant Cell Arteritis with 18F-FDG PET: Introducing an ROC-Analysis-Based Cutoff Ratio
- 18F-FDG Assessment of Glucose Disposal and Production Rates During Fasting and Insulin Stimulation: A Validation Study
- Alterations in Postprandial Hepatic Glycogen Metabolism in Type 2 Diabetes