
Main menu

  • Home
  • Content
    • Current
    • Ahead of print
    • Past Issues
    • JNM Supplement
    • SNMMI Annual Meeting Abstracts
    • Continuing Education
    • JNM Podcasts
  • Subscriptions
    • Subscribers
    • Institutional and Non-member
    • Rates
    • Journal Claims
    • Corporate & Special Sales
  • Authors
    • Submit to JNM
    • Information for Authors
    • Assignment of Copyright
    • AQARA requirements
  • Info
    • Reviewers
    • Permissions
    • Advertisers
  • About
    • About Us
    • Editorial Board
    • Contact Information
  • More
    • Alerts
    • Feedback
    • Help
    • SNMMI Journals
  • SNMMI
    • JNM
    • JNMT
    • SNMMI Journals
    • SNMMI

User menu

  • Subscribe
  • My alerts
  • Log in
  • Log out
  • My Cart

Search

  • Advanced search
Journal of Nuclear Medicine
  • SNMMI
    • JNM
    • JNMT
    • SNMMI Journals
    • SNMMI
  • Subscribe
  • My alerts
  • Log in
  • Log out
  • My Cart
Journal of Nuclear Medicine

Advanced Search

  • Home
  • Content
    • Current
    • Ahead of print
    • Past Issues
    • JNM Supplement
    • SNMMI Annual Meeting Abstracts
    • Continuing Education
    • JNM Podcasts
  • Subscriptions
    • Subscribers
    • Institutional and Non-member
    • Rates
    • Journal Claims
    • Corporate & Special Sales
  • Authors
    • Submit to JNM
    • Information for Authors
    • Assignment of Copyright
    • AQARA requirements
  • Info
    • Reviewers
    • Permissions
    • Advertisers
  • About
    • About Us
    • Editorial Board
    • Contact Information
  • More
    • Alerts
    • Feedback
    • Help
    • SNMMI Journals
  • View or Listen to JNM Podcast
  • Visit JNM on Facebook
  • Join JNM on LinkedIn
  • Follow JNM on Twitter
  • Subscribe to our RSS feeds
OtherClinical Investigations

Statistical Image Analysis of Cerebral Blood Flow in Vascular Dementia with Small-Vessel Disease

Takuya Yoshikawa, Kenya Murase, Naohiko Oku, Kazuo Kitagawa, Masao Imaizumi, Masashi Takasawa, Takashi Nishikawa, Masayasu Matsumoto, Jun Hatazawa and Masatsugu Hori
Journal of Nuclear Medicine April 2003, 44 (4) 505-511;
Takuya Yoshikawa
  • Find this author on Google Scholar
  • Find this author on PubMed
  • Search for this author on this site
Kenya Murase
  • Find this author on Google Scholar
  • Find this author on PubMed
  • Search for this author on this site
Naohiko Oku
  • Find this author on Google Scholar
  • Find this author on PubMed
  • Search for this author on this site
Kazuo Kitagawa
  • Find this author on Google Scholar
  • Find this author on PubMed
  • Search for this author on this site
Masao Imaizumi
  • Find this author on Google Scholar
  • Find this author on PubMed
  • Search for this author on this site
Masashi Takasawa
  • Find this author on Google Scholar
  • Find this author on PubMed
  • Search for this author on this site
Takashi Nishikawa
  • Find this author on Google Scholar
  • Find this author on PubMed
  • Search for this author on this site
Masayasu Matsumoto
  • Find this author on Google Scholar
  • Find this author on PubMed
  • Search for this author on this site
Jun Hatazawa
  • Find this author on Google Scholar
  • Find this author on PubMed
  • Search for this author on this site
Masatsugu Hori
  • Find this author on Google Scholar
  • Find this author on PubMed
  • Search for this author on this site
  • Article
  • Figures & Data
  • Info & Metrics
  • PDF
Loading

Article Figures & Data

Figures

  • Tables
  • FIGURE 1.
    • Download figure
    • Open in new tab
    • Download powerpoint
    FIGURE 1.

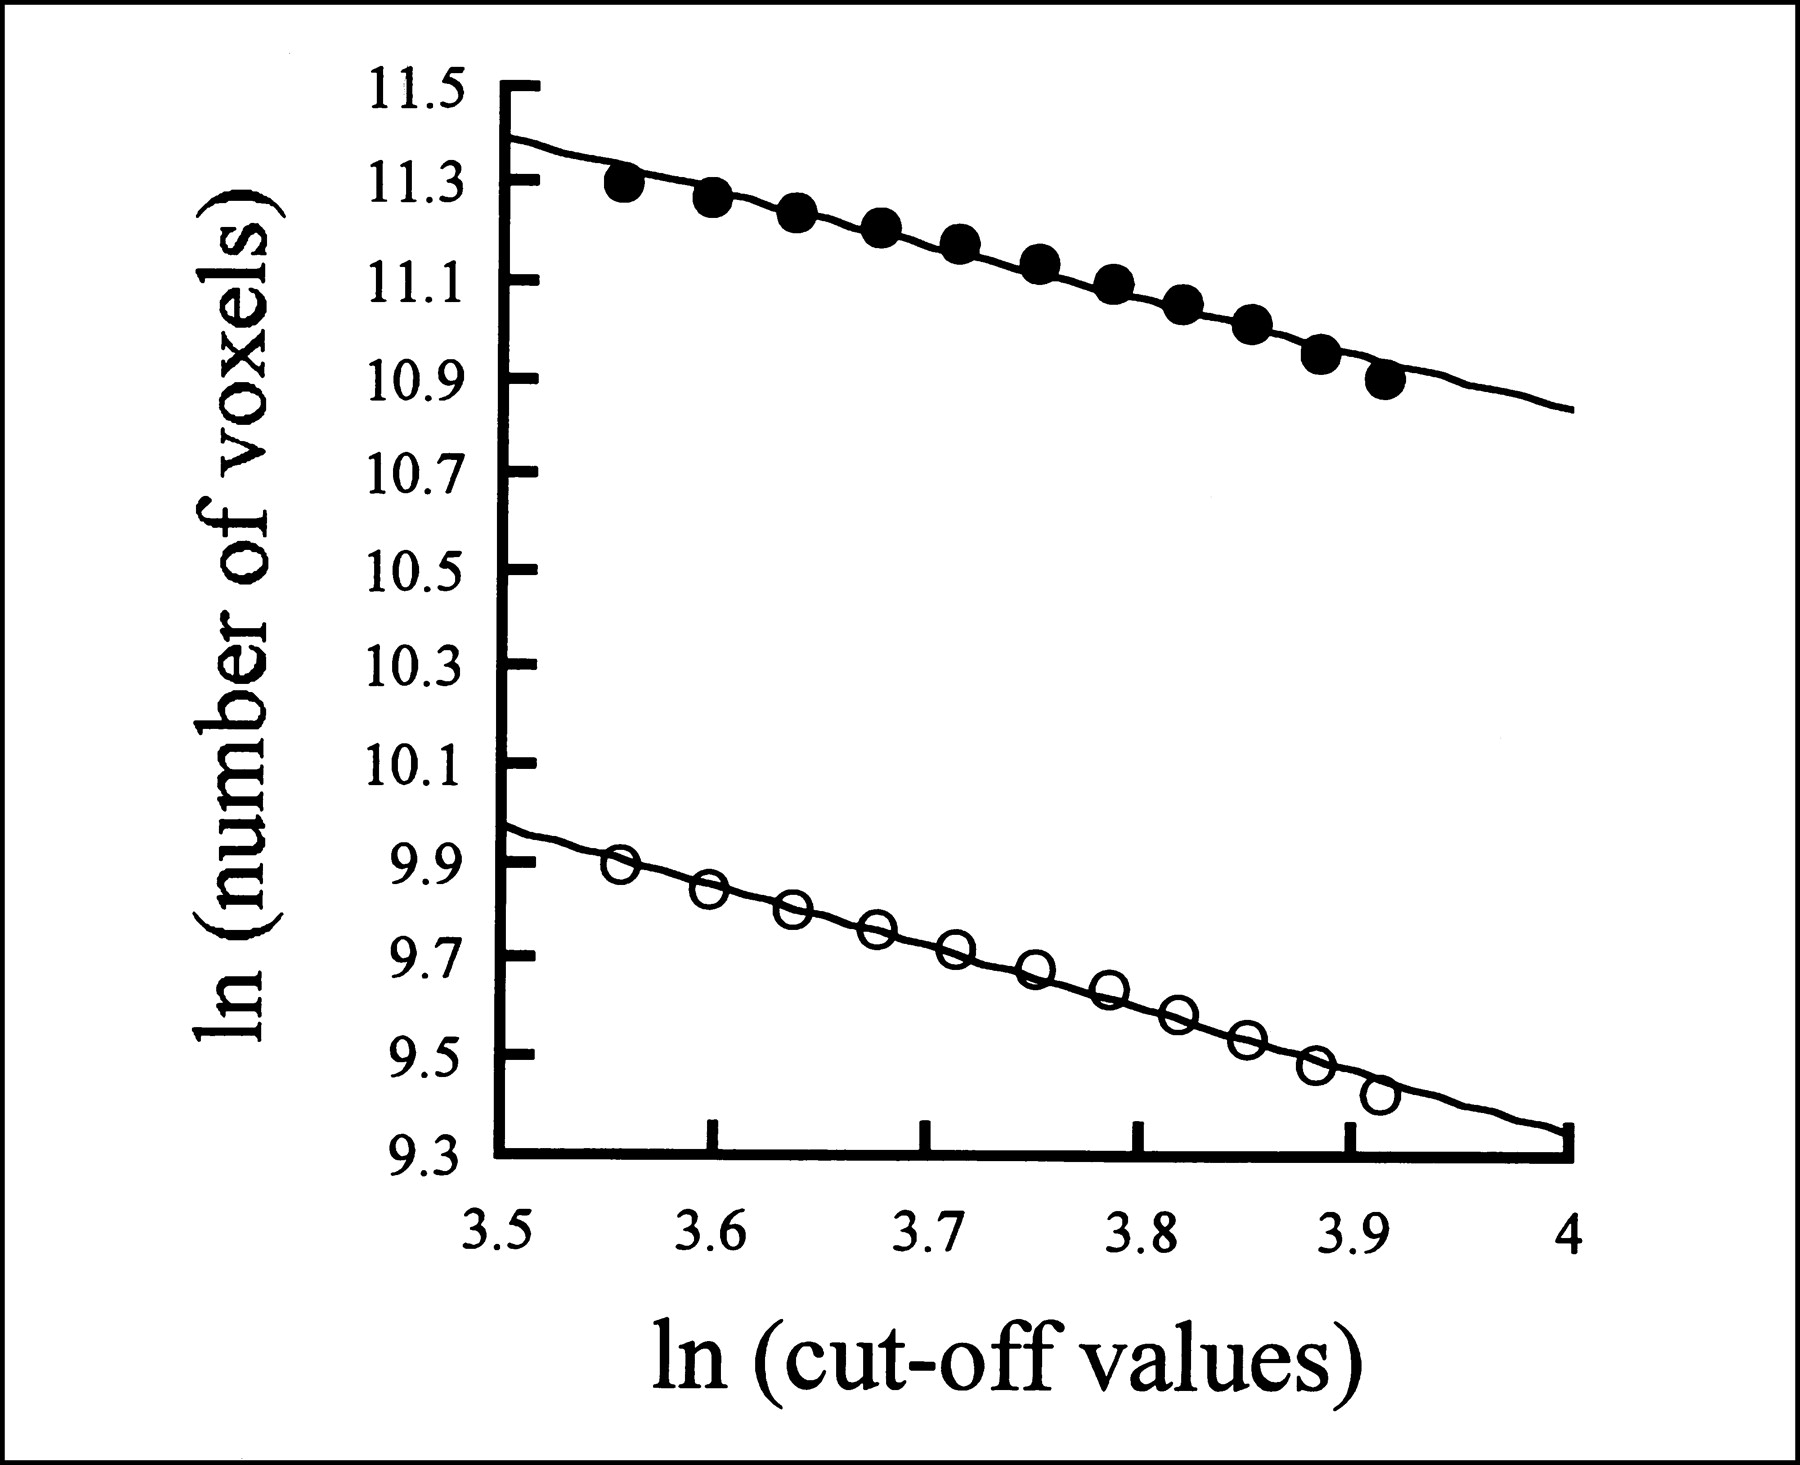
    Comparison of FD calculated for 99mTc-HMPAO CBF SPECT image and FD calculated for 18F-FDG PET image of 62-y-old woman who underwent examination for memory impairment. Horizontal axis shows natural logarithm of cutoff values, and vertical axis shows natural logarithm of number of voxels in area surrounded by contour obtained with radioactivity above cutoff value. Slope of regression line on this graph corresponds to FD. • = FD value for 18F-FDG PET image (y = −1.109x + 15.29; r = 0.988); ○ = FD value for 99mTc-HMPAO CBF SPECT image (y = −1.278x + 14.46; r = 0.995).

  • FIGURE 2.
    • Download figure
    • Open in new tab
    • Download powerpoint
    FIGURE 2.

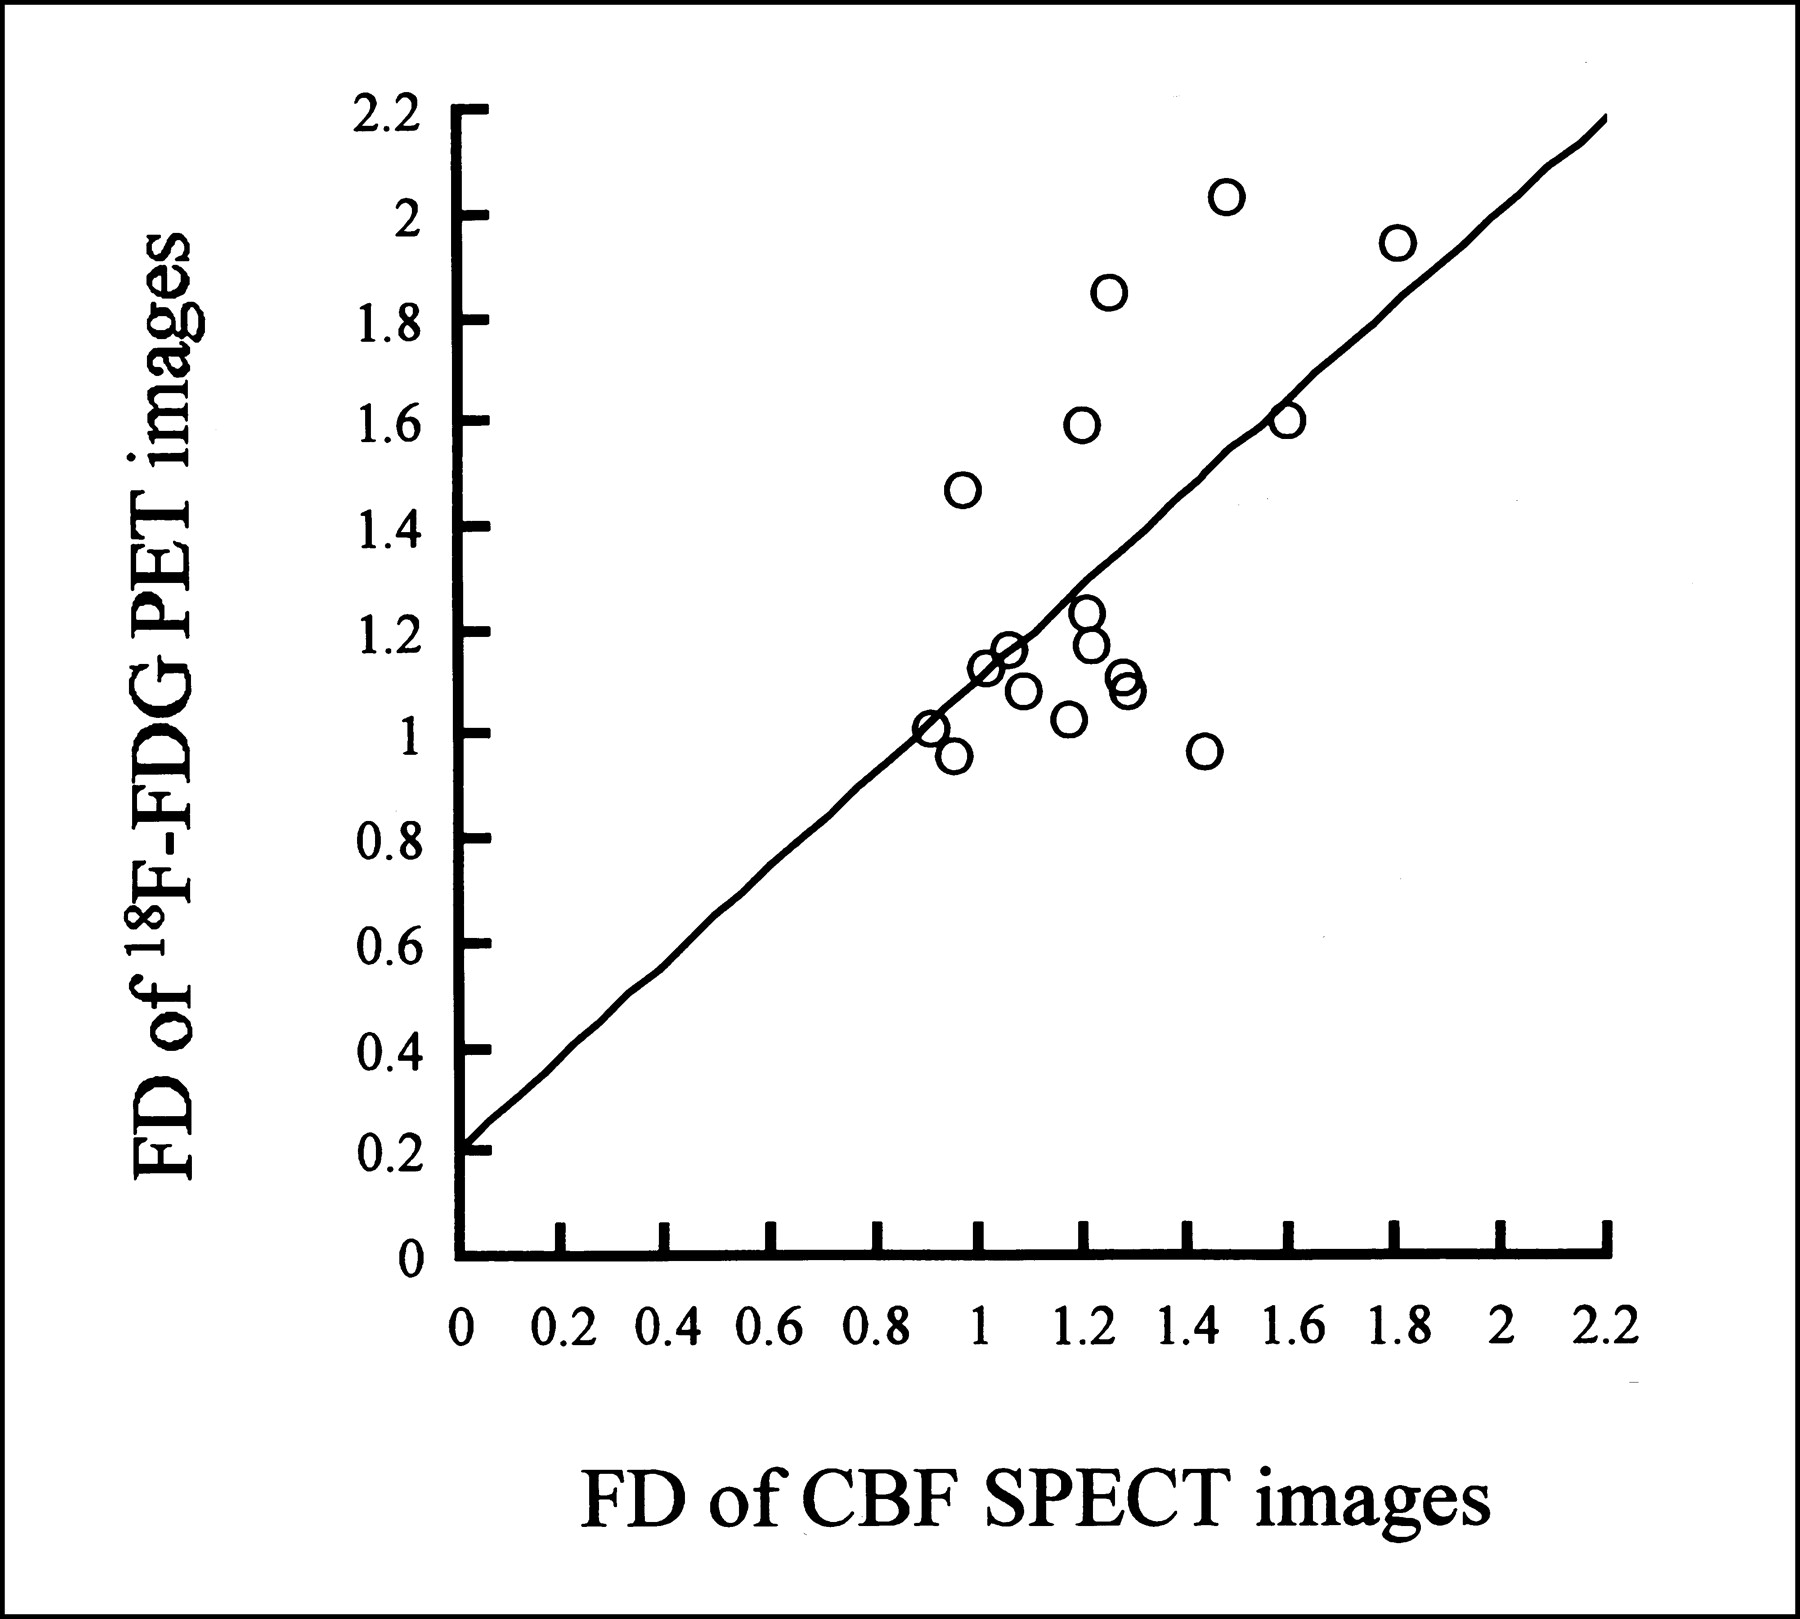
    Scatter plots of FD data between 99mTc-HMPAO CBF SPECT and 18F-FDG PET images in VaD group. Spearman rank correlation analysis showed significant correlation between FDs of the 2 images (y = 0.902x + 0.211; r = 0.619; P < 0.01).

  • FIGURE 3.
    • Download figure
    • Open in new tab
    • Download powerpoint
    FIGURE 3.

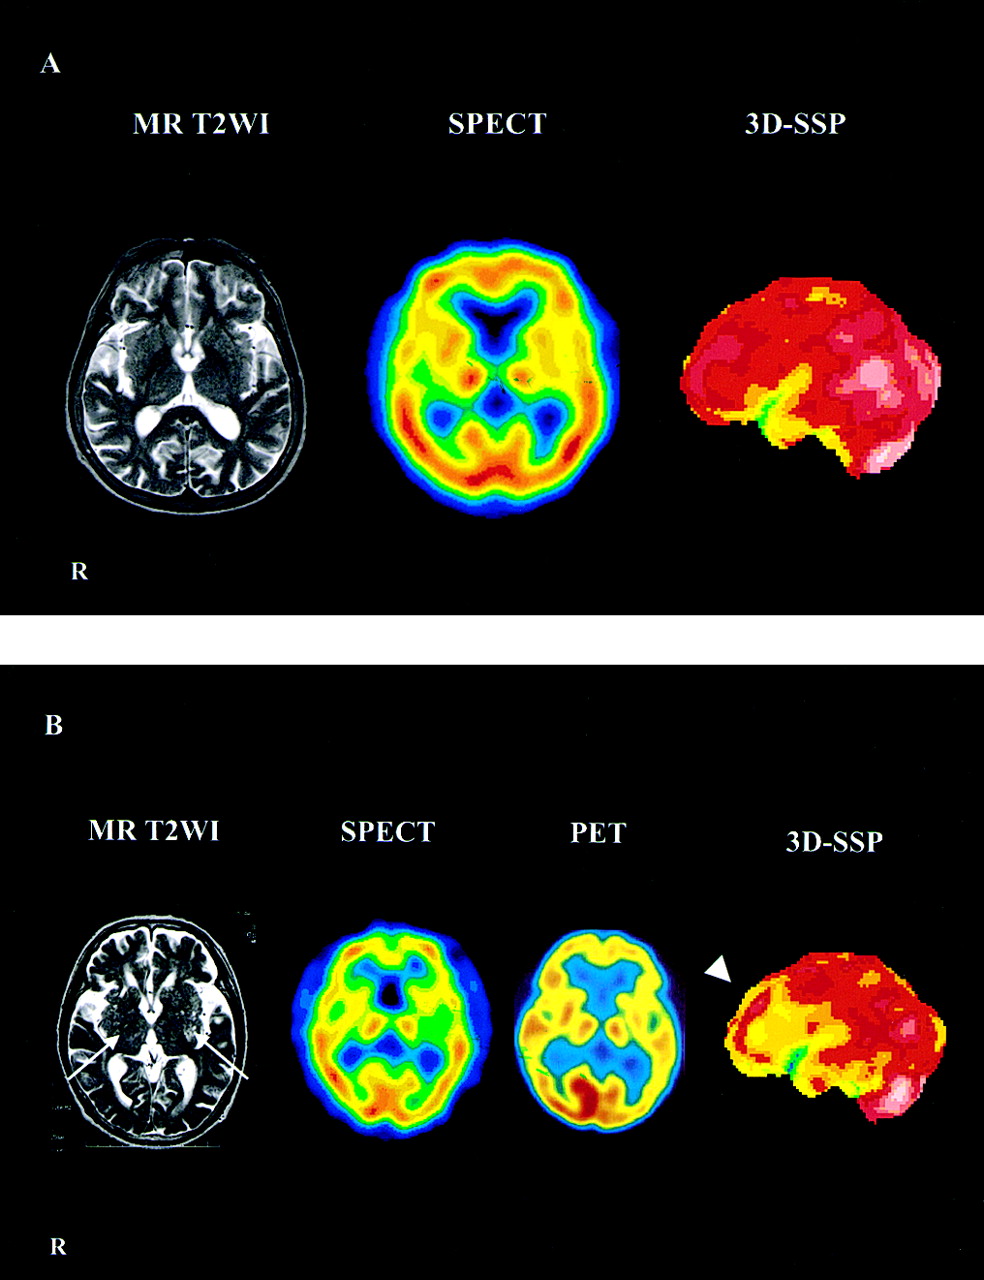
    T2-weighted MR images (left), SPECT or PET images (center), and 3D-SSP images (right) of representative subjects from control and VaD groups. (A) Images of 70-y-old man from control group. His FD was 0.799, and his MMSE score was 29. (B) Images of 75-y-old man from VaD group. His FD was 1.151, and his MMSE score was 15. In VaD, T2-weighted MR images revealed multiple small, bilateral infarcts in basal ganglia (arrows), SPECT and PET images showed diffuse decrease in CBF, and 3D-SSP image showed reduction mainly confined to frontal region (arrowhead). T2WI = T2-weighted image.

  • FIGURE 4.
    • Download figure
    • Open in new tab
    • Download powerpoint
    FIGURE 4.

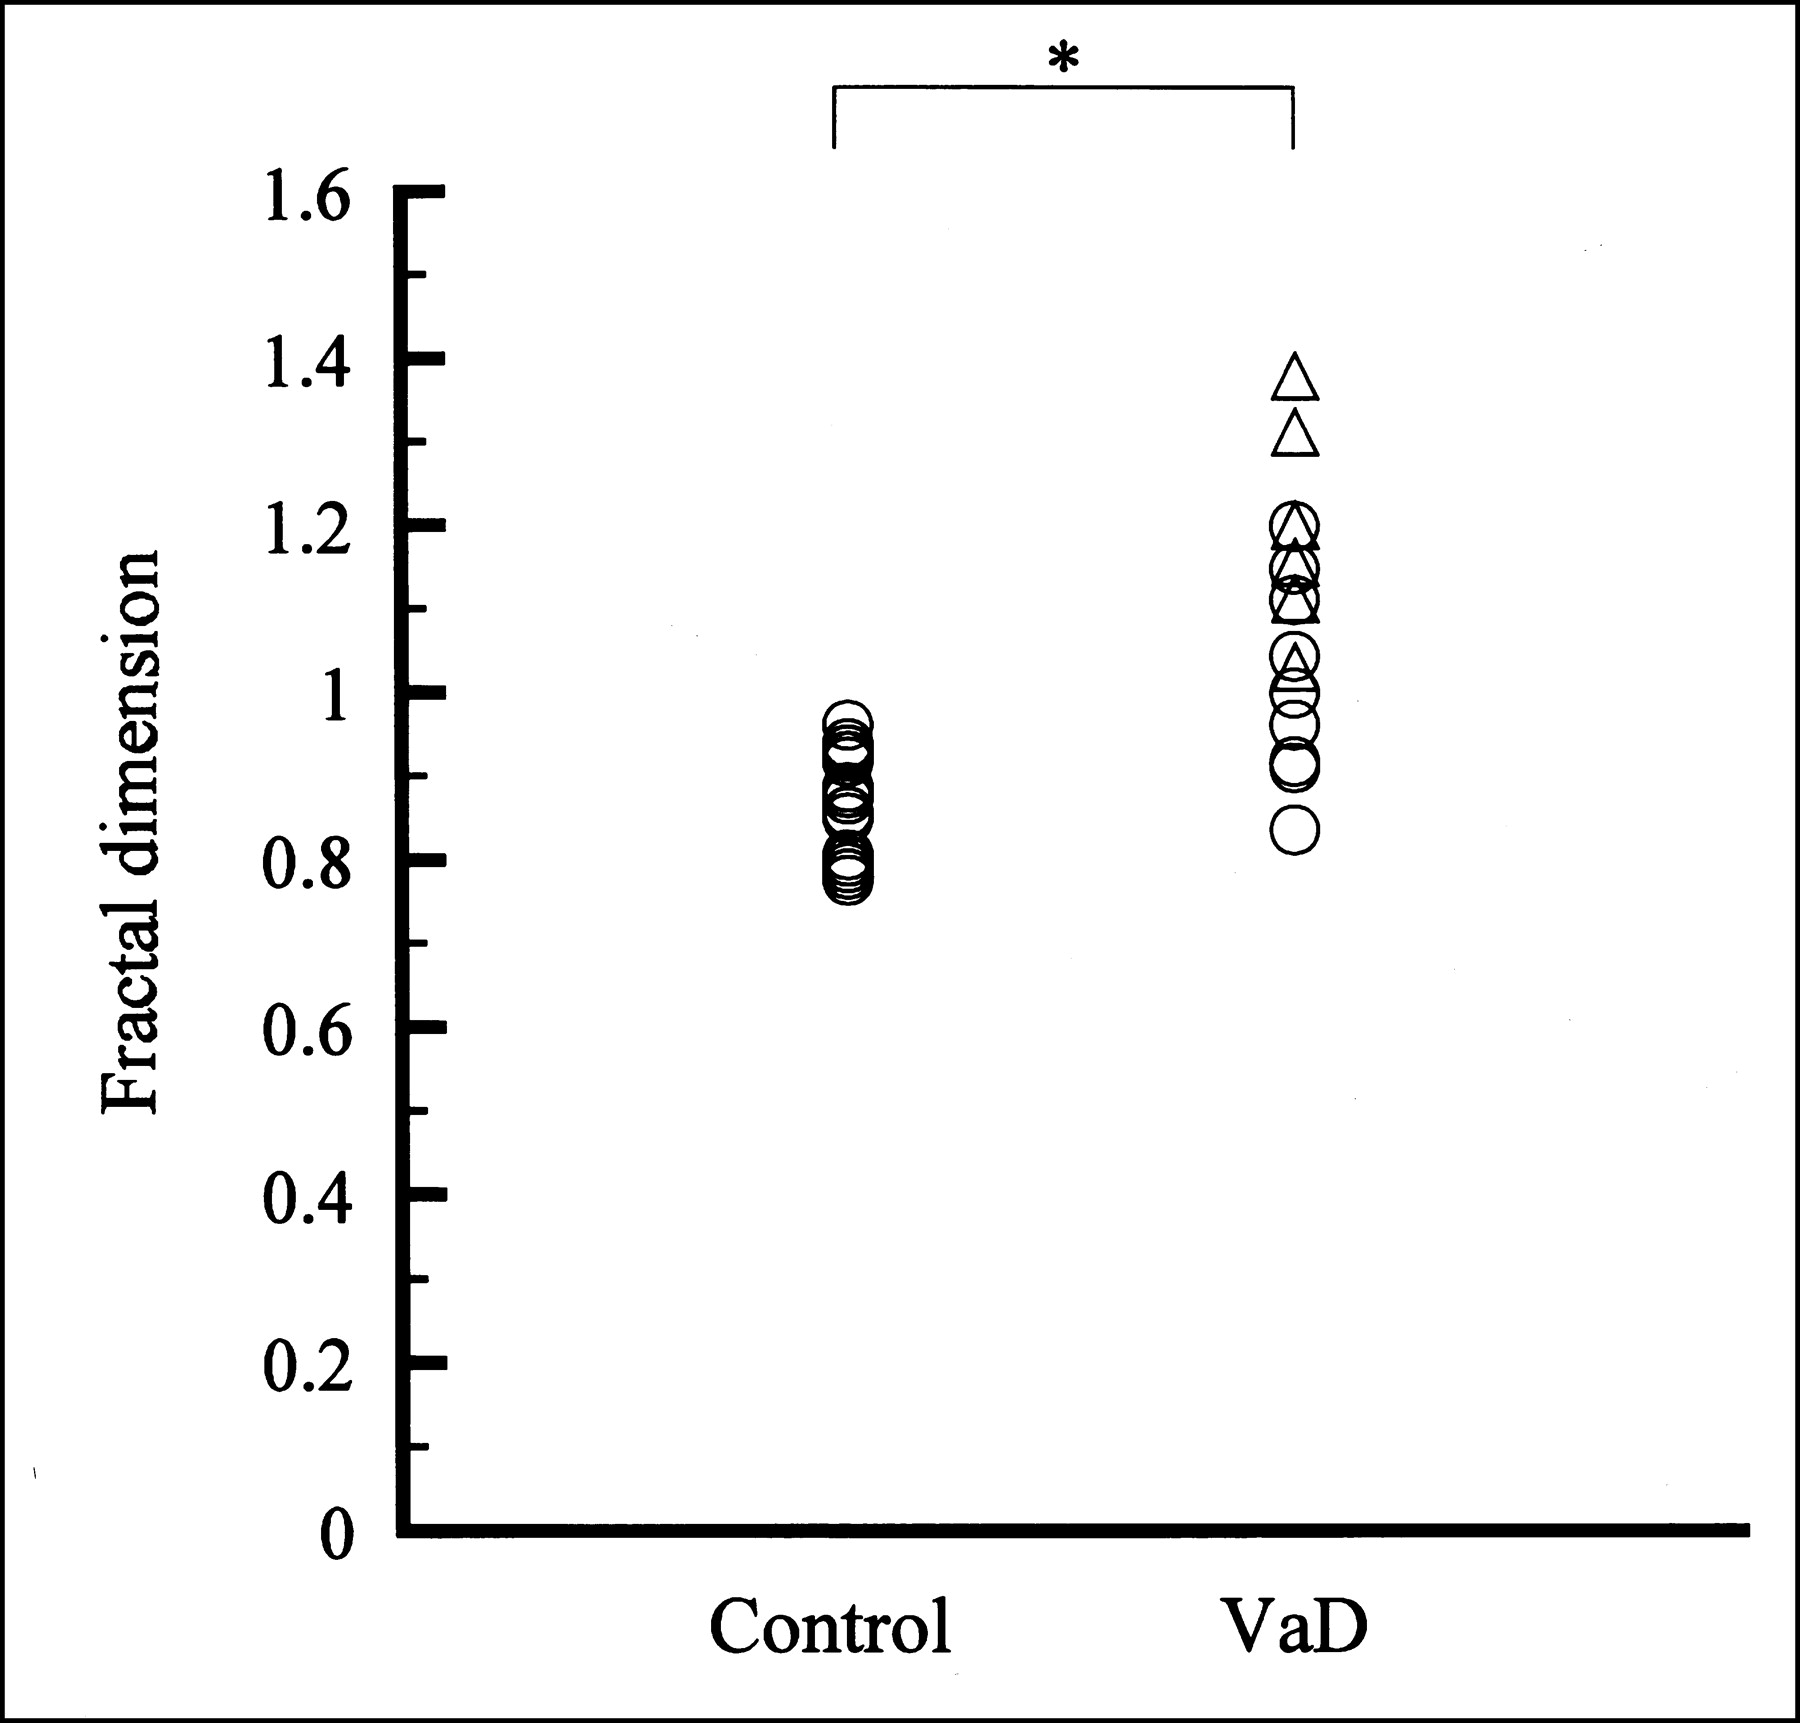
    Comparison of FD between control group (n = 20) and VaD group (n = 17). Mann-Whitney test showed significant difference in FD between the 2 groups (P < 0.0001). ▵ = 7 patients with VaD at MMSE score of less than 20. *P < 0.0001.

  • FIGURE 5.
    • Download figure
    • Open in new tab
    • Download powerpoint
    FIGURE 5.

    Representative 3D-SSP z score maps from patients with diffuse reduction of CBF and reduction mainly confined to frontal region of CBF. (A) Diffuse reduction of CBF (arrows) (patient 1). (B) Decrease in frontal region (arrowheads) (patient 8).

Tables

  • Figures
    • View popup
    TABLE 1

    Clinical Characteristics of Control Group and VaD Group

    VariableControl groupVaD group
    Subjects (n)2017
    Sex (M:F)9:116:11
    Age (y)62.9 ± 11.369.5 ± 8.5
    MMSE26.5 ± 2.618.6 ± 4.5
    • Values are mean ± SD.

    • View popup
    TABLE 2

    Clinical Characteristics of Each VaD Patient

    Patient no.Age (y)SexFDMMSEDecreased CBF
    157M0.91223Diffuse
    282F1.19920Frontal
    367F1.02919Diffuse
    467F1.37310Frontal
    574F1.10821Diffuse
    669F0.96321Diffuse
    769F0.83522Diffuse
    875M1.15115Frontal
    987M1.30711Diffuse
    1055F0.91622Diffuse
    1164F0.99523Diffuse
    1275M0.99523Diffuse
    1362F1.14520Diffuse
    1479F1.10819Frontal
    1563F1.04221Diffuse
    1666M1.30710Diffuse
    1771M1.19917Frontal
PreviousNext
Back to top

In this issue

Journal of Nuclear Medicine
Vol. 44, Issue 4
April 1, 2003
  • Table of Contents
  • Index by author
Print
Download PDF
Article Alerts
Sign In to Email Alerts with your Email Address
Email Article

Thank you for your interest in spreading the word on Journal of Nuclear Medicine.

NOTE: We only request your email address so that the person you are recommending the page to knows that you wanted them to see it, and that it is not junk mail. We do not capture any email address.

Enter multiple addresses on separate lines or separate them with commas.
Statistical Image Analysis of Cerebral Blood Flow in Vascular Dementia with Small-Vessel Disease
(Your Name) has sent you a message from Journal of Nuclear Medicine
(Your Name) thought you would like to see the Journal of Nuclear Medicine web site.
Citation Tools
Statistical Image Analysis of Cerebral Blood Flow in Vascular Dementia with Small-Vessel Disease
Takuya Yoshikawa, Kenya Murase, Naohiko Oku, Kazuo Kitagawa, Masao Imaizumi, Masashi Takasawa, Takashi Nishikawa, Masayasu Matsumoto, Jun Hatazawa, Masatsugu Hori
Journal of Nuclear Medicine Apr 2003, 44 (4) 505-511;

Citation Manager Formats

  • BibTeX
  • Bookends
  • EasyBib
  • EndNote (tagged)
  • EndNote 8 (xml)
  • Medlars
  • Mendeley
  • Papers
  • RefWorks Tagged
  • Ref Manager
  • RIS
  • Zotero
Share
Statistical Image Analysis of Cerebral Blood Flow in Vascular Dementia with Small-Vessel Disease
Takuya Yoshikawa, Kenya Murase, Naohiko Oku, Kazuo Kitagawa, Masao Imaizumi, Masashi Takasawa, Takashi Nishikawa, Masayasu Matsumoto, Jun Hatazawa, Masatsugu Hori
Journal of Nuclear Medicine Apr 2003, 44 (4) 505-511;
Twitter logo Facebook logo LinkedIn logo Mendeley logo
  • Tweet Widget
  • Facebook Like
  • Google Plus One
Bookmark this article

Jump to section

  • Article
    • Abstract
    • MATERIALS AND METHODS
    • RESULTS
    • DISCUSSION
    • CONCLUSION
    • Acknowledgments
    • Footnotes
    • REFERENCES
  • Figures & Data
  • Info & Metrics
  • PDF

Related Articles

  • No related articles found.
  • PubMed
  • Google Scholar

Cited By...

  • A Simple Interpretation of Fractal Analysis of Images
  • Blood Flow Heterogeneity Versus Cerebral Hypoperfusion Revealed by Fractal Analysis on 99mTc-HMPAO SPECT
  • Google Scholar

More in this TOC Section

  • Feasibility of Ultra-Low-Activity 18F-FDG PET/CT Imaging Using a Long–Axial-Field-of-View PET/CT System
  • Cardiac Presynaptic Sympathetic Nervous Function Evaluated by Cardiac PET in Patients with Chronotropic Incompetence Without Heart Failure
  • Validation and Evaluation of a Vendor-Provided Head Motion Correction Algorithm on the uMI Panorama PET/CT System
Show more Clinical Investigations

Similar Articles

SNMMI

© 2025 SNMMI

Powered by HighWire