
Main menu

  • Home
  • Content
    • Current
    • Ahead of print
    • Past Issues
    • JNM Supplement
    • SNMMI Annual Meeting Abstracts
    • Continuing Education
    • JNM Podcasts
  • Subscriptions
    • Subscribers
    • Institutional and Non-member
    • Rates
    • Journal Claims
    • Corporate & Special Sales
  • Authors
    • Submit to JNM
    • Information for Authors
    • Assignment of Copyright
    • AQARA requirements
  • Info
    • Reviewers
    • Permissions
    • Advertisers
  • About
    • About Us
    • Editorial Board
    • Contact Information
  • More
    • Alerts
    • Feedback
    • Help
    • SNMMI Journals
  • SNMMI
    • JNM
    • JNMT
    • SNMMI Journals
    • SNMMI

User menu

  • Subscribe
  • My alerts
  • Log in
  • My Cart

Search

  • Advanced search
Journal of Nuclear Medicine
  • SNMMI
    • JNM
    • JNMT
    • SNMMI Journals
    • SNMMI
  • Subscribe
  • My alerts
  • Log in
  • My Cart
Journal of Nuclear Medicine

Advanced Search

  • Home
  • Content
    • Current
    • Ahead of print
    • Past Issues
    • JNM Supplement
    • SNMMI Annual Meeting Abstracts
    • Continuing Education
    • JNM Podcasts
  • Subscriptions
    • Subscribers
    • Institutional and Non-member
    • Rates
    • Journal Claims
    • Corporate & Special Sales
  • Authors
    • Submit to JNM
    • Information for Authors
    • Assignment of Copyright
    • AQARA requirements
  • Info
    • Reviewers
    • Permissions
    • Advertisers
  • About
    • About Us
    • Editorial Board
    • Contact Information
  • More
    • Alerts
    • Feedback
    • Help
    • SNMMI Journals
  • View or Listen to JNM Podcast
  • Visit JNM on Facebook
  • Join JNM on LinkedIn
  • Follow JNM on Twitter
  • Subscribe to our RSS feeds
OtherClinical Investigations

Predicting the Outcome of Distraction Osteogenesis by 3-Phase Bone Scintigraphy

Masaya Kawano, Junichi Taki, Hiroyuki Tsuchiya, Katsuro Tomita and Norihisa Tonami
Journal of Nuclear Medicine March 2003, 44 (3) 369-374;
Masaya Kawano
  • Find this author on Google Scholar
  • Find this author on PubMed
  • Search for this author on this site
Junichi Taki
  • Find this author on Google Scholar
  • Find this author on PubMed
  • Search for this author on this site
Hiroyuki Tsuchiya
  • Find this author on Google Scholar
  • Find this author on PubMed
  • Search for this author on this site
Katsuro Tomita
  • Find this author on Google Scholar
  • Find this author on PubMed
  • Search for this author on this site
Norihisa Tonami
  • Find this author on Google Scholar
  • Find this author on PubMed
  • Search for this author on this site
  • Article
  • Figures & Data
  • Info & Metrics
  • PDF
Loading

Article Figures & Data

Figures

  • Tables
  • FIGURE 1.
    • Download figure
    • Open in new tab
    • Download powerpoint
    FIGURE 1.

    A 10-y-old boy, with osteosarcoma of left femoral metaphysis, received chemotherapy before and after surgery. He had marginal excision of tumor and bone transport with Ilizarov external fixator. (A) Radiograph shows callus formation in diaphysial distraction segment. (B) Blood-pool image and delayed image show increased activities in distraction segments. Increased activities are also shown in growth plates in both images. ROI was set on distraction segment and symmetric ROI was set on contralateral normal area as control. Uptake ratio of blood-pool image was 1.3, and uptake ratio of delayed image was 4.4.

  • FIGURE 2.
    • Download figure
    • Open in new tab
    • Download powerpoint
    FIGURE 2.

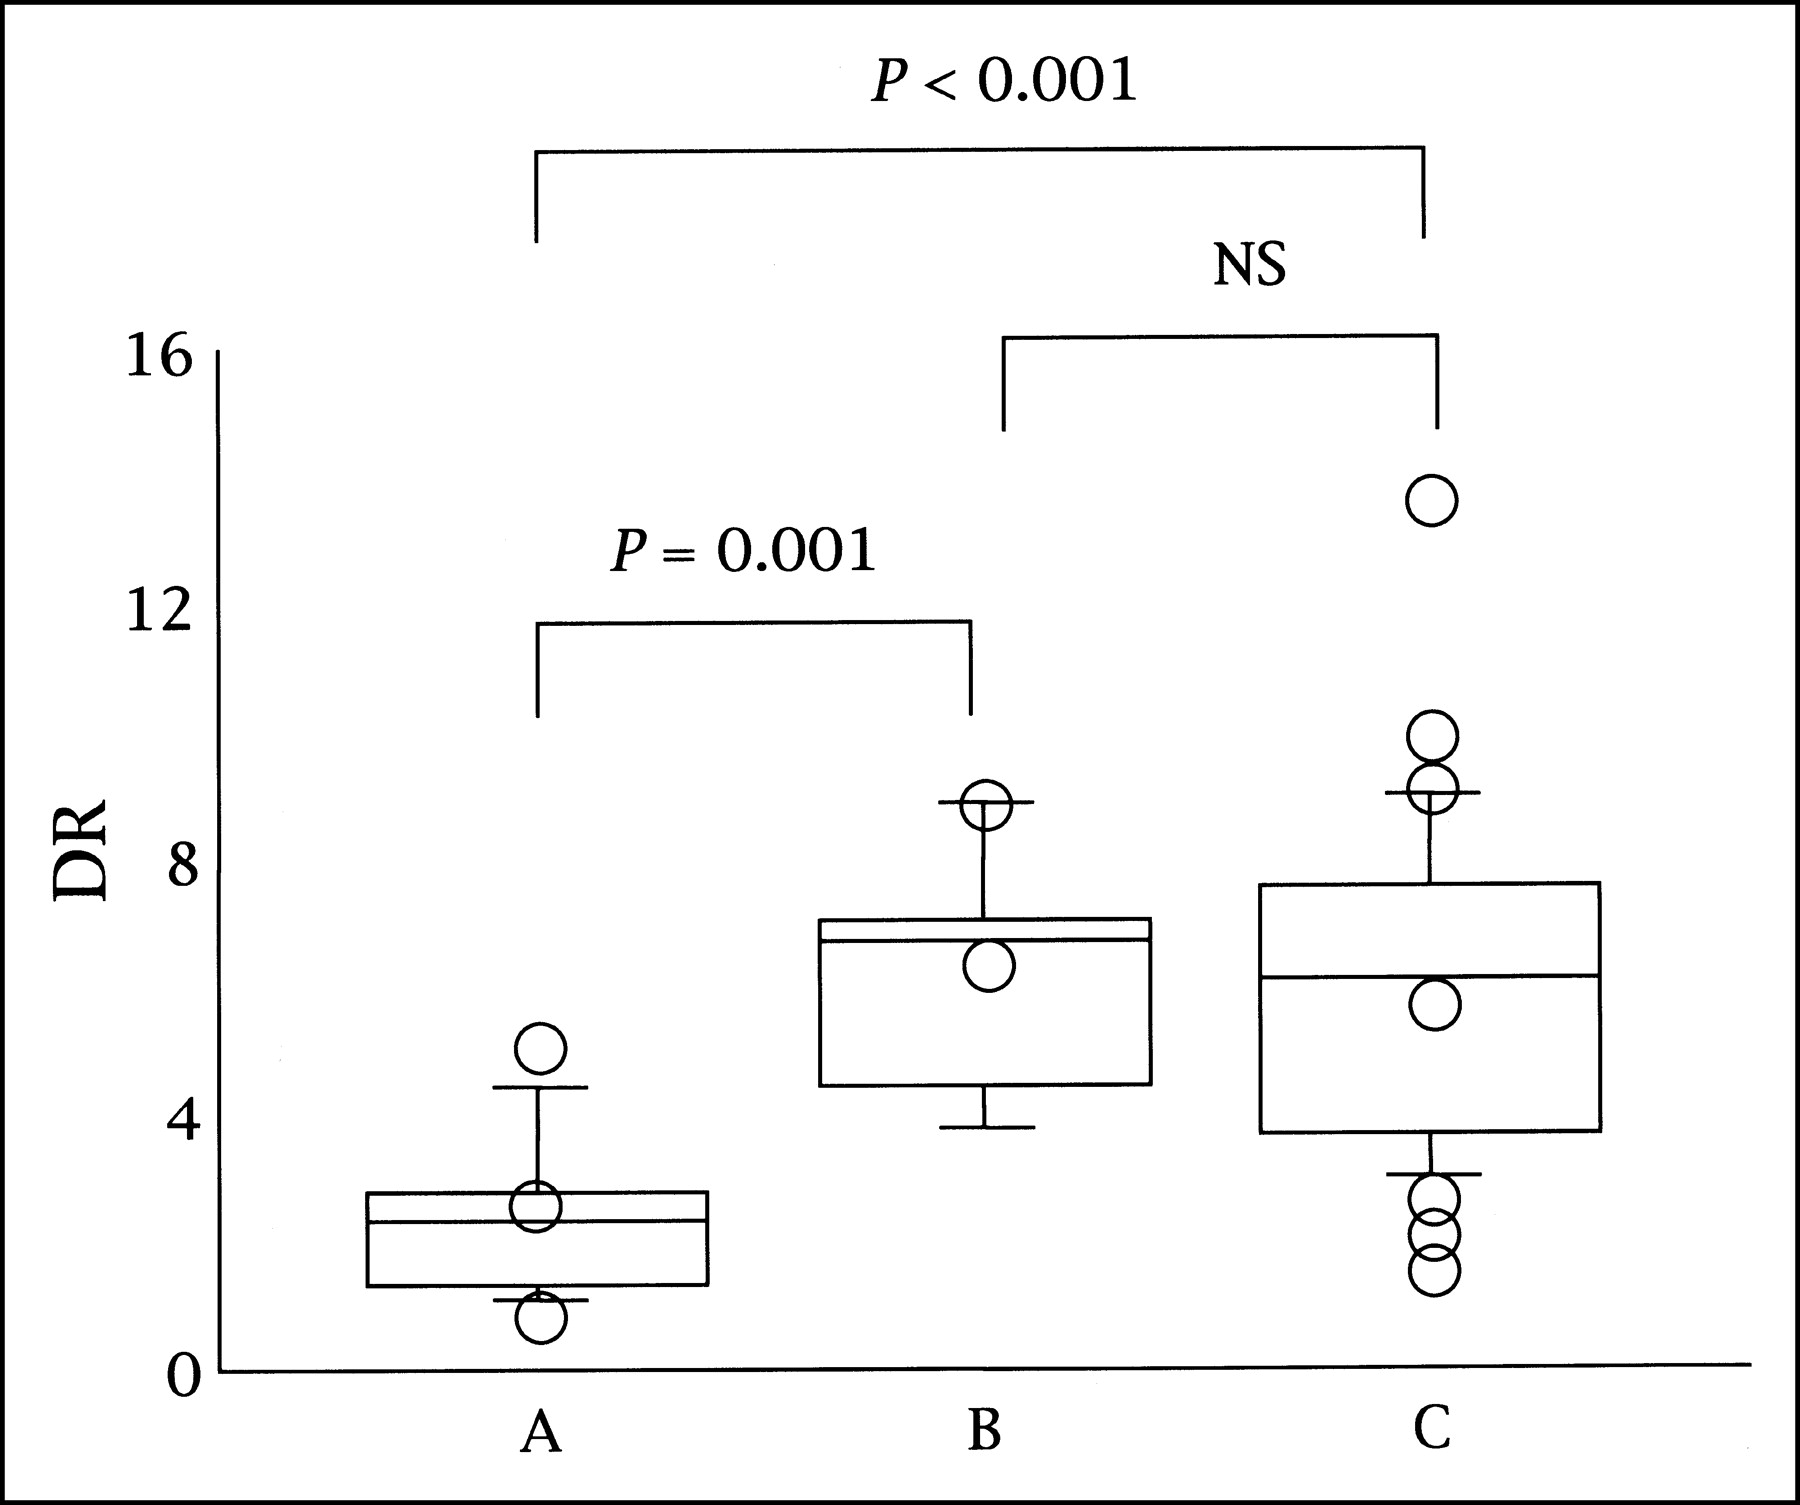
    Box plot graphics of DR in groups A–C. Box indicates lower and upper quartiles, and central line and open circle in box are median and mean, respectively. Upper and lower ends of vertical line indicate 90 percentile and 10 percentile, respectively. NS = not statistically significant. DR of group A was significantly lower than that of other 2 groups.

  • FIGURE 3.
    • Download figure
    • Open in new tab
    • Download powerpoint
    FIGURE 3.

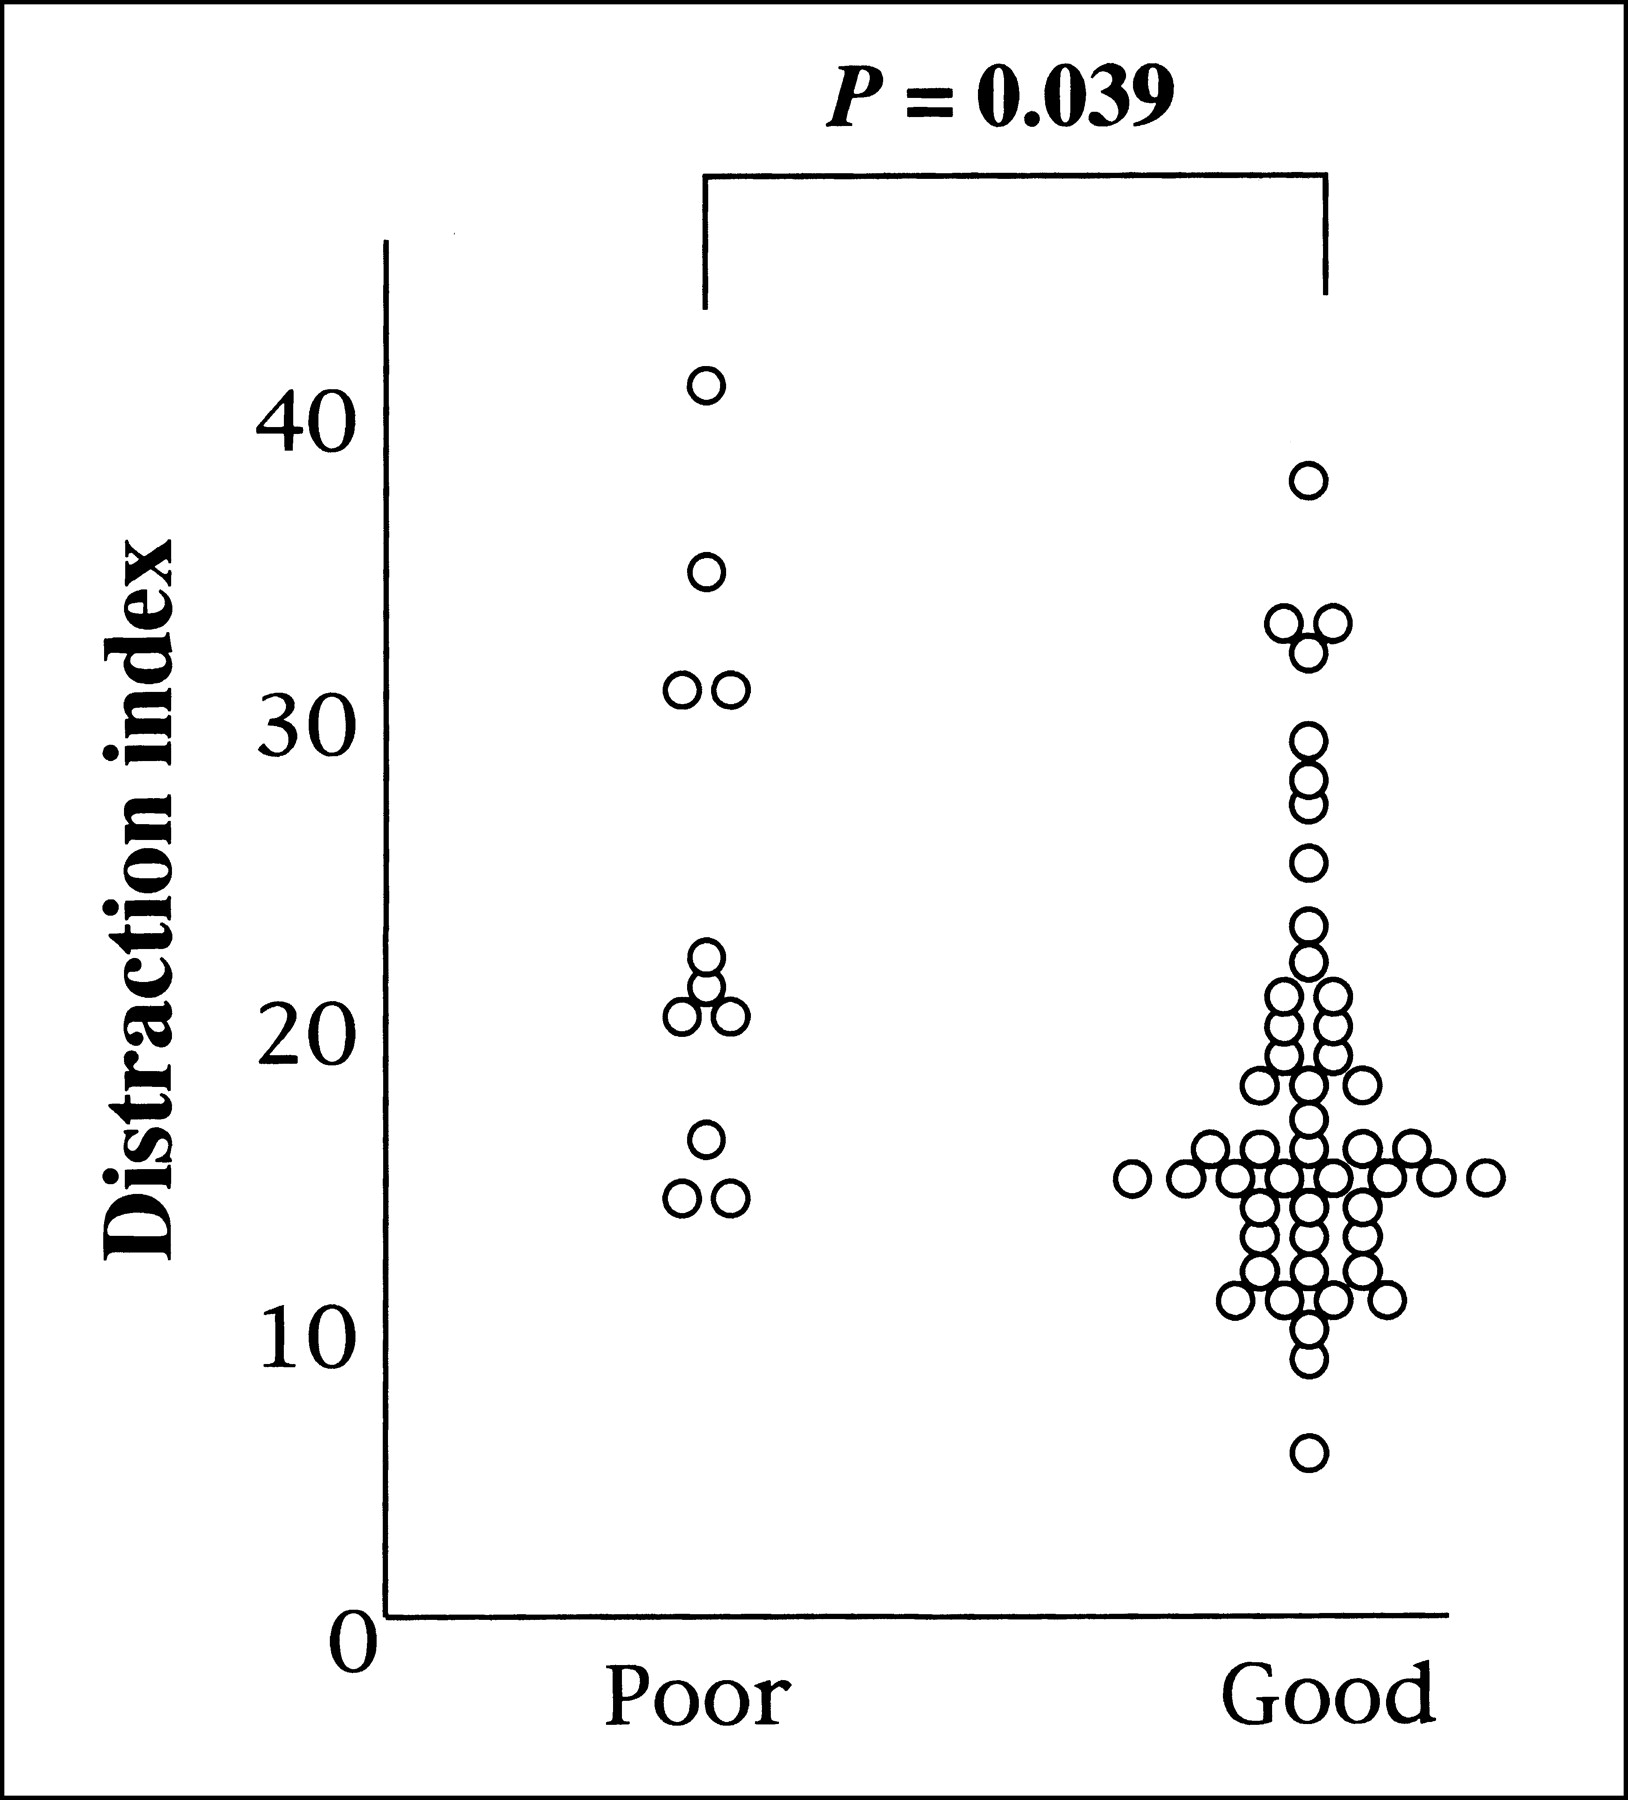
    Distraction indices of poor and good consolidation groups. Distraction index of poor consolidation group was significantly larger than that of good consolidation group. However, poor consolidation group was not differentiated from good consolidation group because of significant overlap.

  • FIGURE 4.
    • Download figure
    • Open in new tab
    • Download powerpoint
    FIGURE 4.

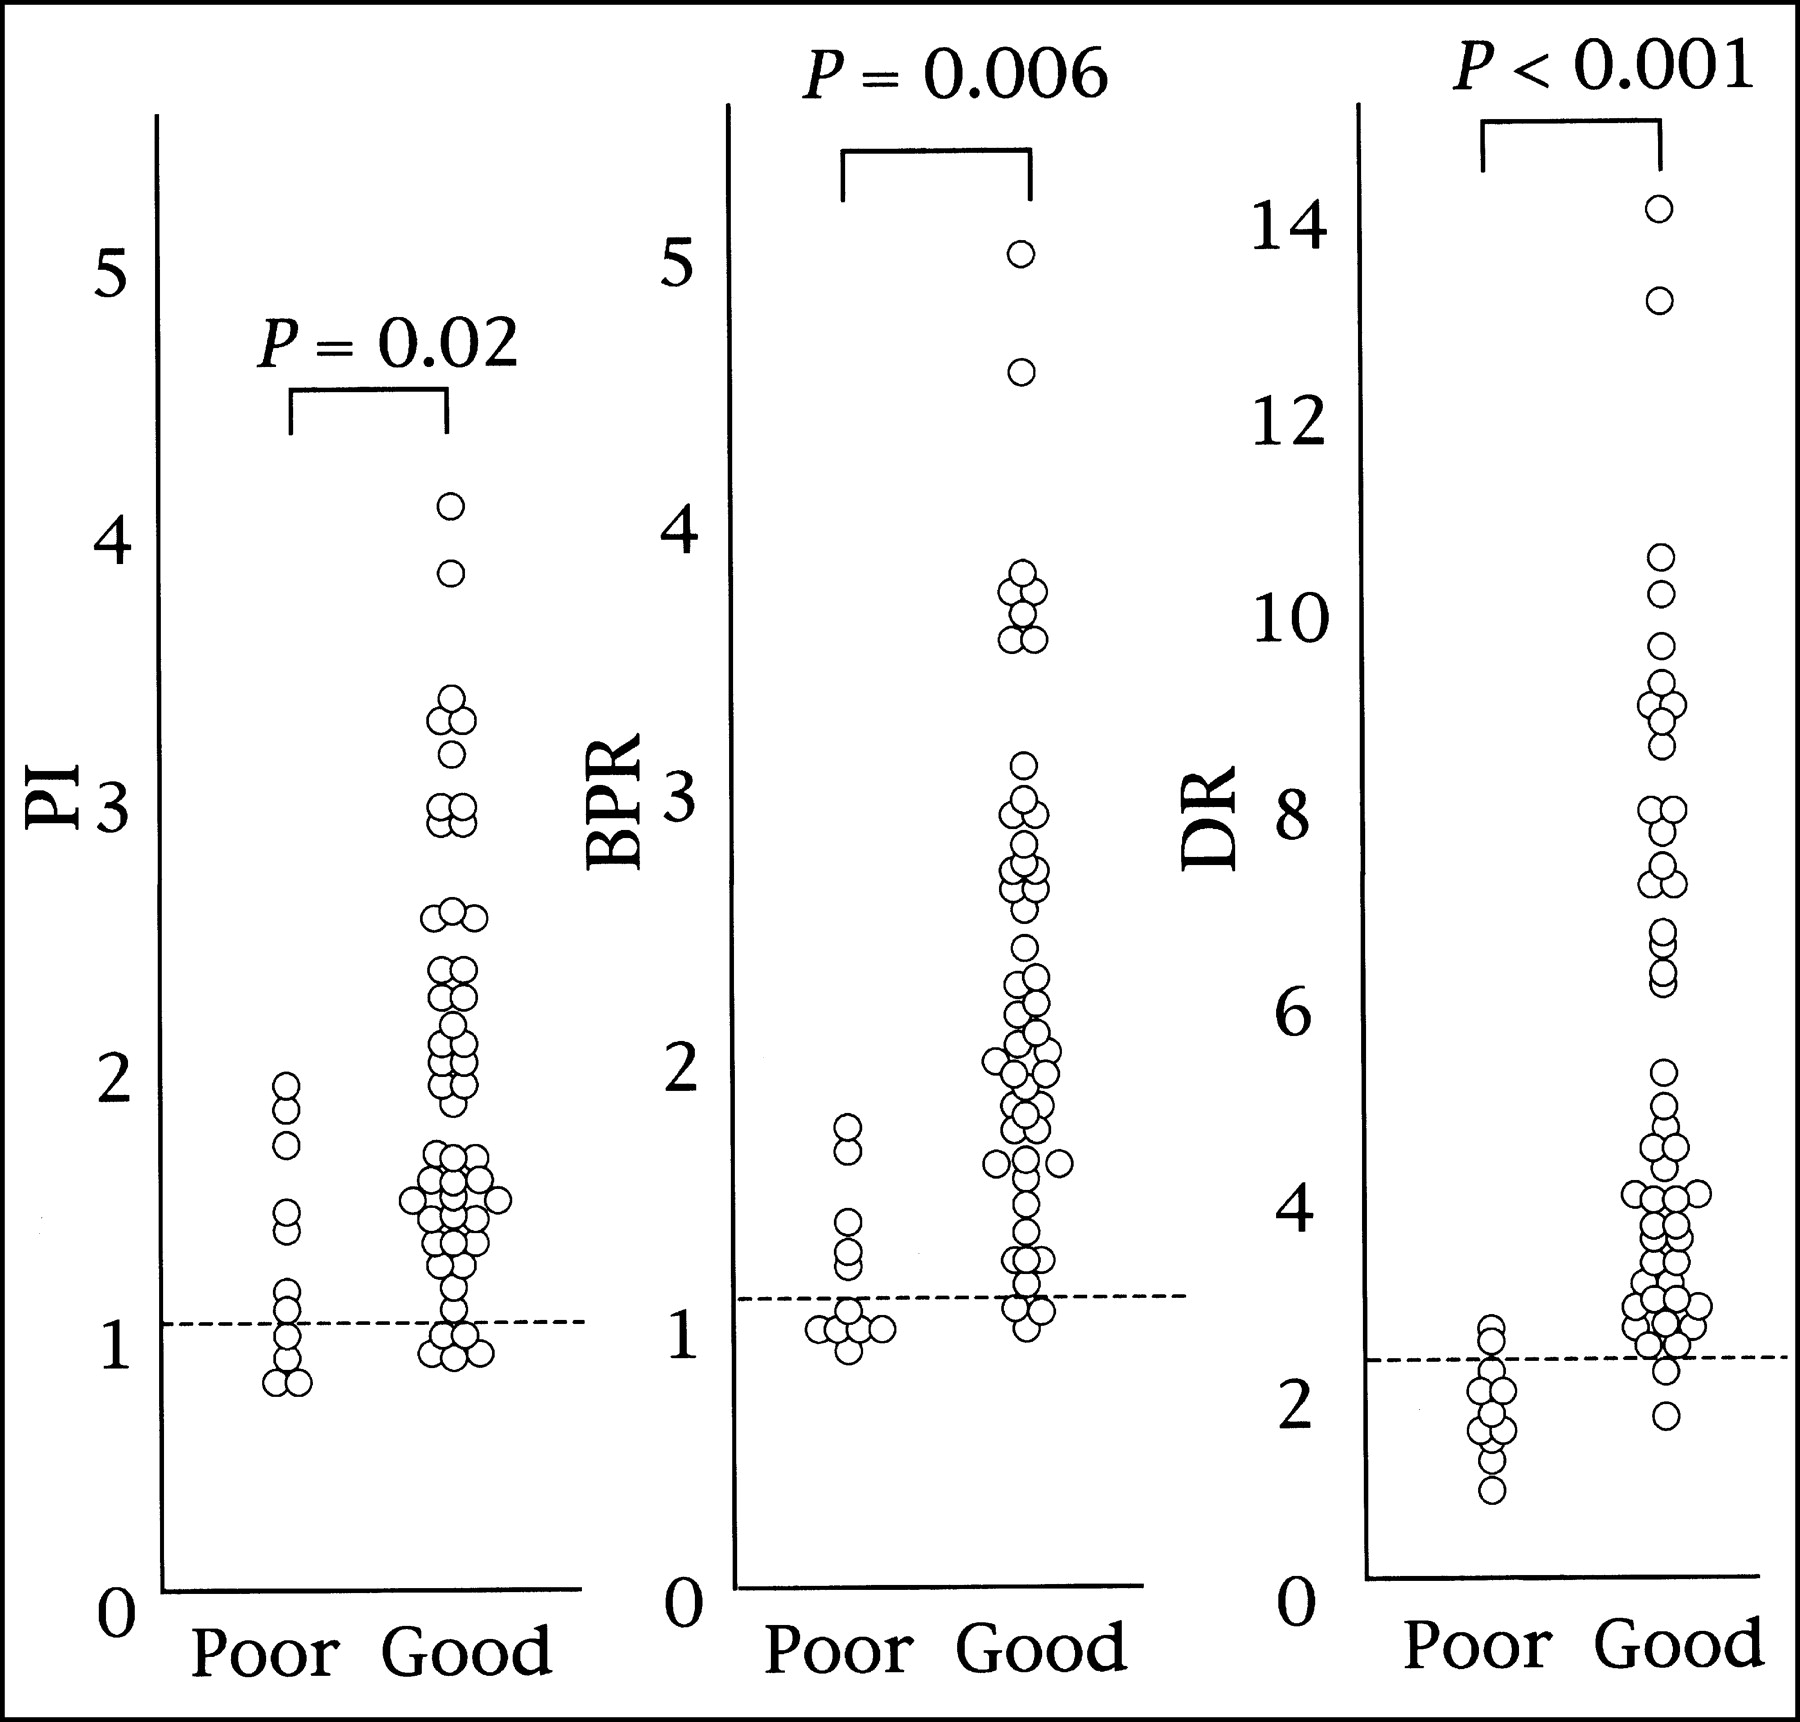
    Comparison of poor and good consolidation group in PI, BPR, and DR. Each horizontal dashed line indicates optimal cutoff levels obtained by ROC analysis, which were 1.1 in PI, 1.2 in BPR, and 2.2 in DR.

  • FIGURE 5.
    • Download figure
    • Open in new tab
    • Download powerpoint
    FIGURE 5.

    ROC curves of detectability of poor consolidation group in PI, BPR, and DR. Area under ROC curve of DR was significantly larger than that of other 2 indices. FPF = false-positive fraction; TPF = true-positive fraction; Az = area under ROC curve.

Tables

  • Figures
    • View popup
    TABLE 1

    Length and Periods of Distraction Osteogenesis: Comparisons Among Groups A–C

    ParameterGroup AGroup BGroup CP
    Age (y)18 ± 1128 ± 2329 ± 20NS
    Length (cm)8.2 ± 2.85.8 ± 1.14.9 ± 3.5NS
    Waiting period (d)10.2 ± 3.08.3 ± 3.88.5 ± 4.0NS
    Distraction (d)132 ± 9394 ± 3090 ± 92NS
    Consolidation (d)166 ± 99140 ± 76150 ± 143NS
    Total duration (d)299 ± 118234 ± 65240 ± 167NS
    • NS = not statistically significant.

    • View popup
    TABLE 2

    Clinical Indices of Distraction Osteogenesis

    Parameter (d/cm)Group AGroup BGroup CP
    Distraction index15.8 ± 6.516.7 ± 6.318.7 ± 8.9NS
    Maturation index22.3 ± 15.625.1 ± 14.451.8 ± 70.0NS
    External fixation index38.0 ± 15.841.8 ± 12.970.5 ± 69.9NS
    • NS = not statistically significant.

    • View popup
    TABLE 3

    Length and Periods of Distraction Osteogenesis: Comparisons Between Poor and Good Consolidation Groups

    ParameterPoor consolidationGood consolidationP
    Age (y)27 ± 1827 ± 20NS
    Length (cm)6.2 ± 2.45.6 ± 3.7NS
    Waiting period (d)9.6 ± 4.08.8 ± 3.6NS
    Distraction (d)148 ± 11591 ± 80NS
    Consolidation (d)172 ± 104155 ± 135NS
    Total duration (d)319 ± 120246 ± 151NS
    • NS = not statistically significant.

    • View popup
    TABLE 4

    Detectability of Patients with Poor Consolidation by 3-Phase Bone Scintigraphy

    ParameterCLSensitivitySpecificityAccuracyPPVNPV
    PI1.14/11 (36)44/49 (90)48/60 (80)4/9 (44)44/51 (86)
    BPR1.26/11 (55)46/49 (94)52/60 (87)6/9 (67)46/51 (90)
    DR2.29/11 (82)47/49 (96)56/60 (93)9/11 (82)47/49 (96)
    • CL = cutoff level; PPV = positive predictive value; NPV = negative predictive value.

    • Values in parentheses are percentages.

PreviousNext
Back to top

In this issue

Journal of Nuclear Medicine
Vol. 44, Issue 3
March 1, 2003
  • Table of Contents
  • Index by author
Print
Download PDF
Article Alerts
Sign In to Email Alerts with your Email Address
Email Article

Thank you for your interest in spreading the word on Journal of Nuclear Medicine.

NOTE: We only request your email address so that the person you are recommending the page to knows that you wanted them to see it, and that it is not junk mail. We do not capture any email address.

Enter multiple addresses on separate lines or separate them with commas.
Predicting the Outcome of Distraction Osteogenesis by 3-Phase Bone Scintigraphy
(Your Name) has sent you a message from Journal of Nuclear Medicine
(Your Name) thought you would like to see the Journal of Nuclear Medicine web site.
Citation Tools
Predicting the Outcome of Distraction Osteogenesis by 3-Phase Bone Scintigraphy
Masaya Kawano, Junichi Taki, Hiroyuki Tsuchiya, Katsuro Tomita, Norihisa Tonami
Journal of Nuclear Medicine Mar 2003, 44 (3) 369-374;

Citation Manager Formats

  • BibTeX
  • Bookends
  • EasyBib
  • EndNote (tagged)
  • EndNote 8 (xml)
  • Medlars
  • Mendeley
  • Papers
  • RefWorks Tagged
  • Ref Manager
  • RIS
  • Zotero
Share
Predicting the Outcome of Distraction Osteogenesis by 3-Phase Bone Scintigraphy
Masaya Kawano, Junichi Taki, Hiroyuki Tsuchiya, Katsuro Tomita, Norihisa Tonami
Journal of Nuclear Medicine Mar 2003, 44 (3) 369-374;
Twitter logo Facebook logo LinkedIn logo Mendeley logo
  • Tweet Widget
  • Facebook Like
  • Google Plus One
Bookmark this article

Jump to section

  • Article
    • Abstract
    • MATERIALS AND METHODS
    • RESULTS
    • DISCUSSION
    • CONCLUSION
    • Footnotes
    • REFERENCES
  • Figures & Data
  • Info & Metrics
  • PDF

Related Articles

  • No related articles found.
  • PubMed
  • Google Scholar

Cited By...

  • No citing articles found.
  • Google Scholar

More in this TOC Section

  • Feasibility of Ultra-Low-Activity 18F-FDG PET/CT Imaging Using a Long–Axial-Field-of-View PET/CT System
  • Cardiac Presynaptic Sympathetic Nervous Function Evaluated by Cardiac PET in Patients with Chronotropic Incompetence Without Heart Failure
  • Validation and Evaluation of a Vendor-Provided Head Motion Correction Algorithm on the uMI Panorama PET/CT System
Show more Clinical Investigations

Similar Articles

SNMMI

© 2025 SNMMI

Powered by HighWire