


Abstract
In patients with cervical cancer, it is important to estimate prognosis at the time of diagnosis. This study using PET with 18F-FDG was undertaken to determine whether a simple and fast visual analysis of characteristics of the primary tumor before initiation of treatment could achieve this goal. Methods: Forty-seven patients with cervical cancer who were to be treated by combined radiation therapy and chemotherapy were imaged before beginning treatment. They were then followed for up to 3 y for evidence of recurrence or death. Images of the chest, abdomen, and pelvis were obtained 40–90 min after administration of 370–555 MBq (10–15 mCi) 18F-FDG. Three observers then independently graded the primary tumor for size (0 = small, 1 = moderate, 2 = large), shape (0 = spherical, 1 = nonspherical), heterogeneity of uptake (0 = none, 1 = moderate, 2 = marked), and presence of lymph nodes (0 = none, 1 = pelvic, 2 = paraaortic, 3 = distant). The scores were summed to achieve a total score. A statistical calculation demonstrated that a score cutoff of 4 best separated patients with a good prognosis from patients with a bad prognosis. Kaplan-Meier analysis was used to compute progression-free survival and overall survival. Evaluation of lymph nodes alone was compared with the grading of tumor characteristics. Results: Observers 1 and 2 scored 26 patients as having a good prognosis and 21 as having a bad prognosis. Observer 3 scored 30 and 17, respectively, a statistically insignificant difference. Survival curves were almost identical for the 3 observers. For progression-free survival, approximately 12% of patients with a good score had disease recurrence whereas approximately 75% with a bad score had disease recurrence. For overall survival, approximately 10% (good) and 80% (bad) died. Evaluation of lymph nodes also separated the groups, but not as well as did visual analysis alone. The combination of the 2 was only slightly superior to visual assessment alone. Conclusion: A simple, rapid, and highly reproducible system is described for visual grading of characteristics of the primary tumor in patients with cervical cancer at the time of diagnosis. This approach separates patients with a poor prognosis from those who will do well, thus providing a new tool for accurate estimation of prognosis.
Treatment planning and determination of prognosis are important parts of the initial evaluation of patients with cancer. In cervical cancer, these goals have traditionally been achieved by clinical assessment based on the International Federation of Gynecology and Obstetrics (FIGO) staging system (1). In recent years, modern imaging techniques, including CT and MRI, have contributed to improved assessment of these patients (2–5). Reports from our institution (6,7) and elsewhere (8–11) recently demonstrated substantial value for PET using the radiopharmaceutical 18F-FDG. The primary tumor is well seen, and lymph nodes are reliably evaluated with greater accuracy than by CT, MRI, or lymphangiography (6,7,11). We demonstrated further improvement in assessment of prognosis by 18F-FDG PET through addition of quantitative determination of the volume of the primary tumor (12). Unfortunately, this quantitative measurement is somewhat time consuming and requires specialized software. Thus, we undertook this study using only visual, qualitative evaluation of 18F-FDG PET images to determine whether a simple, fast, and reproducible method could be developed that would more effectively direct therapy and estimate prognosis in patients with cervical cancer.
MATERIALS AND METHODS
Forty-seven consecutive patients with cervical cancer diagnosed between January 1998 and September 1999 whose image data were available were retrospectively evaluated. They all had biopsy-proven cervical cancer and were to undergo primary treatment by radiation therapy and, in 28 patients, with adjuvant cisplatin chemotherapy (13). The radiation therapy consisted of external-beam irradiation over 6 wk with 2 intracavitary (brachytherapy) treatments during the external-beam therapy. The total dose to point A was 85 Gy, and the maximum doses to the bladder, rectum, and lateral surface of the vagina were 75, 70, and 130 Gy, respectively.
All patients underwent 18F-FDG PET before the beginning of treatment following the standard imaging protocol in our department, consisting of fasting for at least 4 h followed by placement of a Foley catheter, intravenous hydration, and administration of 20 mg of furosemide to minimize bladder activity. Then, 370–555 MBq (10–15 mCi) 18F-FDG were administered, and images of the chest, abdomen, and pelvis were obtained beginning 40–90 min later. A 47-slice ECAT-EXACT PET tomograph (Siemens/CTI, Knoxville, TN) was used, with 10-min emission and 2-min transmission images collected at 4–6 bed positions. A segmentation algorithm was used to generate a transmission map (14) for attenuation correction, and transaxial slices were reconstructed with use of the ordered-subsets expectation maximization algorithm (15) and Butterworth filtering. The data were reconstructed in a 128 × 128 pixel matrix with a pixel size and slice spacing of 4.3 mm. The reconstructed spatial resolution was typically 8 mm in full width at half maximum.
Three observers with different levels of experience independently evaluated the 18F-FDG PET images. Two were attending nuclear medicine physicians with many years of experience, and the third was a radiologist in nuclear medicine fellowship training. The images were evaluated without knowledge of the clinical history or subsequent follow-up except that all patients had newly diagnosed cervical cancer. The data were interactively viewed on a computer monitor with display of transaxial, coronal, and sagittal slices. Gray scale and various color scales could be selected and adjusted.
Three characteristics of the primary tumor were evaluated and numerically graded: size, shape, and heterogeneity of 18F-FDG uptake (Table 1). Size was scored as 0 for small, 1 for moderate, or 2 for large. Small size was defined as tumor occupying only a small portion of the lower pelvis, with diameter ≤ 4 cm (10 pixels); moderate, as tumor occupying most of the lower pelvis; and large, as tumor outside the lower pelvis, with diameter > 10 cm (25 pixels). Shape was scored as 0 for spherical or 1 for nonspherical, typically tubular. Heterogeneity was scored as 0 for none, 1 for moderate, or 2 for marked, where moderate heterogeneity was approximately a 10%–30% count variation across the tumor and marked was a variation > 30%. Lymph node involvement was also scored, using 0 for none, 1 for pelvic, 2 for paraaortic, and 3 for distant. If nodes were present in more than a single region, the highest score was used. Metastases to other organs were not observed. Thus, scores could range from a minimum of 0 (small, spherical, homogeneous, no lymph node involvement) to a maximum of 8 (large, nonspherical, markedly heterogeneous, distant nodal metastases).
Scoring System
Clinical examinations were performed 6 wk after the end of treatment and thereafter every 3 mo. No patients were lost to follow-up.
Two different survival endpoints were used: progression-free survival (PFS) and overall survival (OS). PFS was the interval from the beginning of radiation therapy to the time of the first recurrence or the last follow-up visit. OS was the time from the first treatment to death or the last follow-up visit. The Kaplan-Meier method was used for survival analysis (16), with statistical significance assessed by the log-rank test.
To determine the best cutoff value for the overall image score, we performed the Kaplan-Meier analysis for several different cutoff values, and the fraction of patients with and without recurrence or death was computed at the end of the follow-up period. The best cutoff was then selected following an approach similar to that used in conventional evaluation and diagnostic tests. The likelihood ratios (sensitivity/[1 –specificity]) for different cutoff values was computed, where sensitivity was the true-positive fraction for a positive cutoff value predicting recurrence or death and specificity was the true-negative fraction (17).
The scores of the 3 readers were compared using a 2 × 2 contingency table and the McNemar test (18). The relative performance of the observers was also evaluated by inspection of the survival curves generated from their independent interpretations.
Finally, survival was computed with consideration of only lymph node status and with consideration of only visual scoring, without addition of the lymph node information.
RESULTS
The 47 patients were drawn from the group used in our recent tumor-volume article (12) (digital data were no longer available for 4 patients from the previous group). The quantitative results of that work were not known to the observers in this study. The patients ranged from 24 to 84 y old (mean, 48 y), and they were followed for 0.2–3.1 y (mean, 1.7 y). Patient characteristics are shown in Table 2. Typical examples of patient studies are shown in Figure 1.
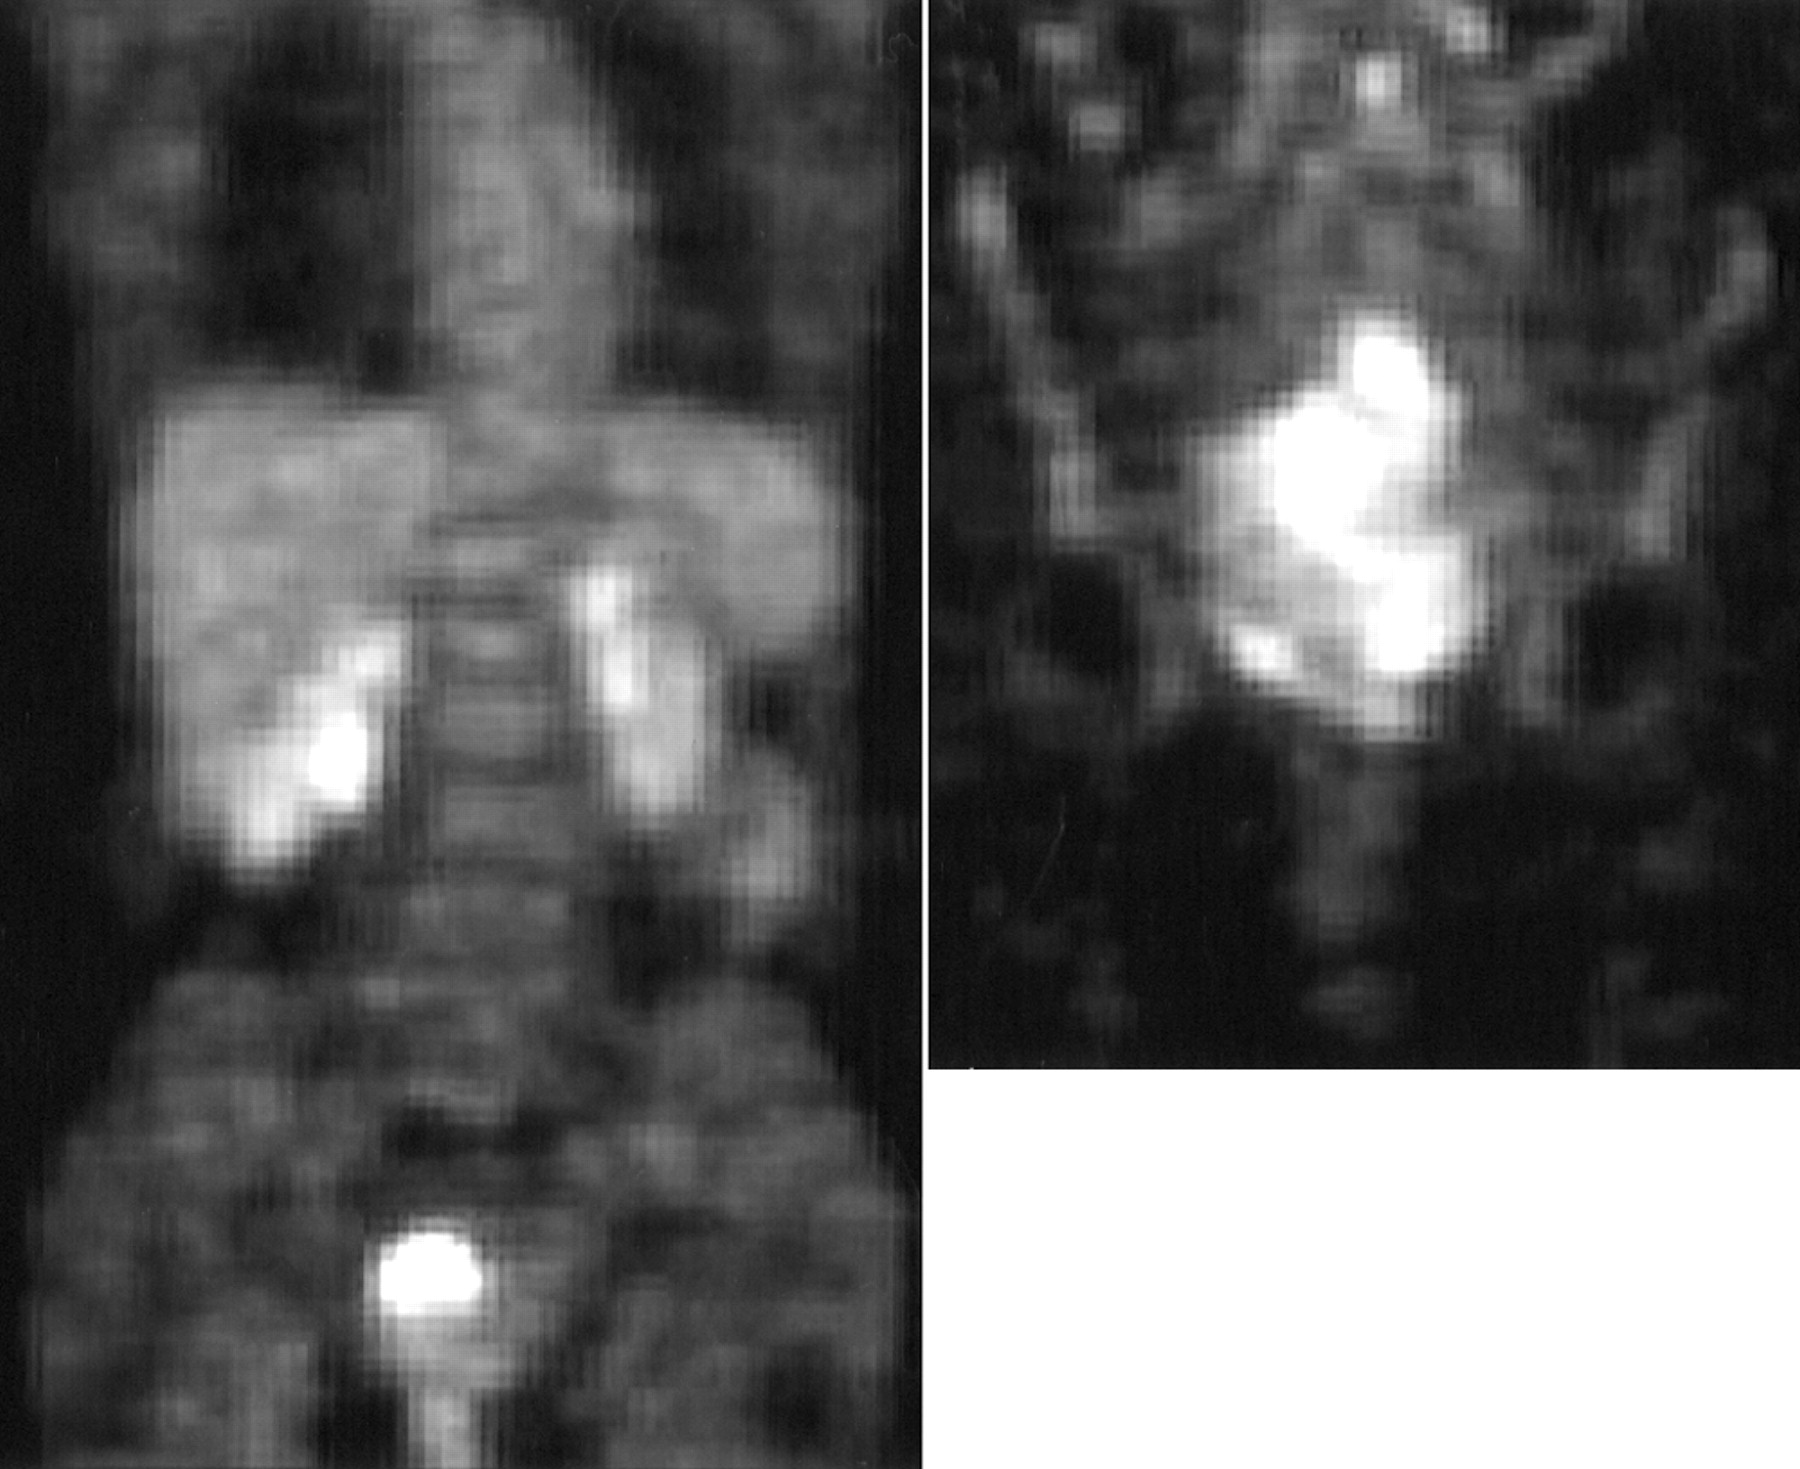
On left is coronal image of patient with small, spherical, and homogeneous primary tumor and no lymph node disease (score = 0), who was alive without disease at 703 d. On right is coronal image of patient with large, nonspherical, and markedly heterogeneous primary tumor (score = 2 + 1 + 2 + 2, or 7), who was dead of her disease at 149 d. Patient on right also had paraaortic lymph node disease (not shown).
Patient Characteristics
A score cutoff of 4 best separated the patients with good survival from those with poor survival. Thus, studies were graded as indicating a good prognosis when scores were <4 and as indicating a bad prognosis when scores were ≥4.
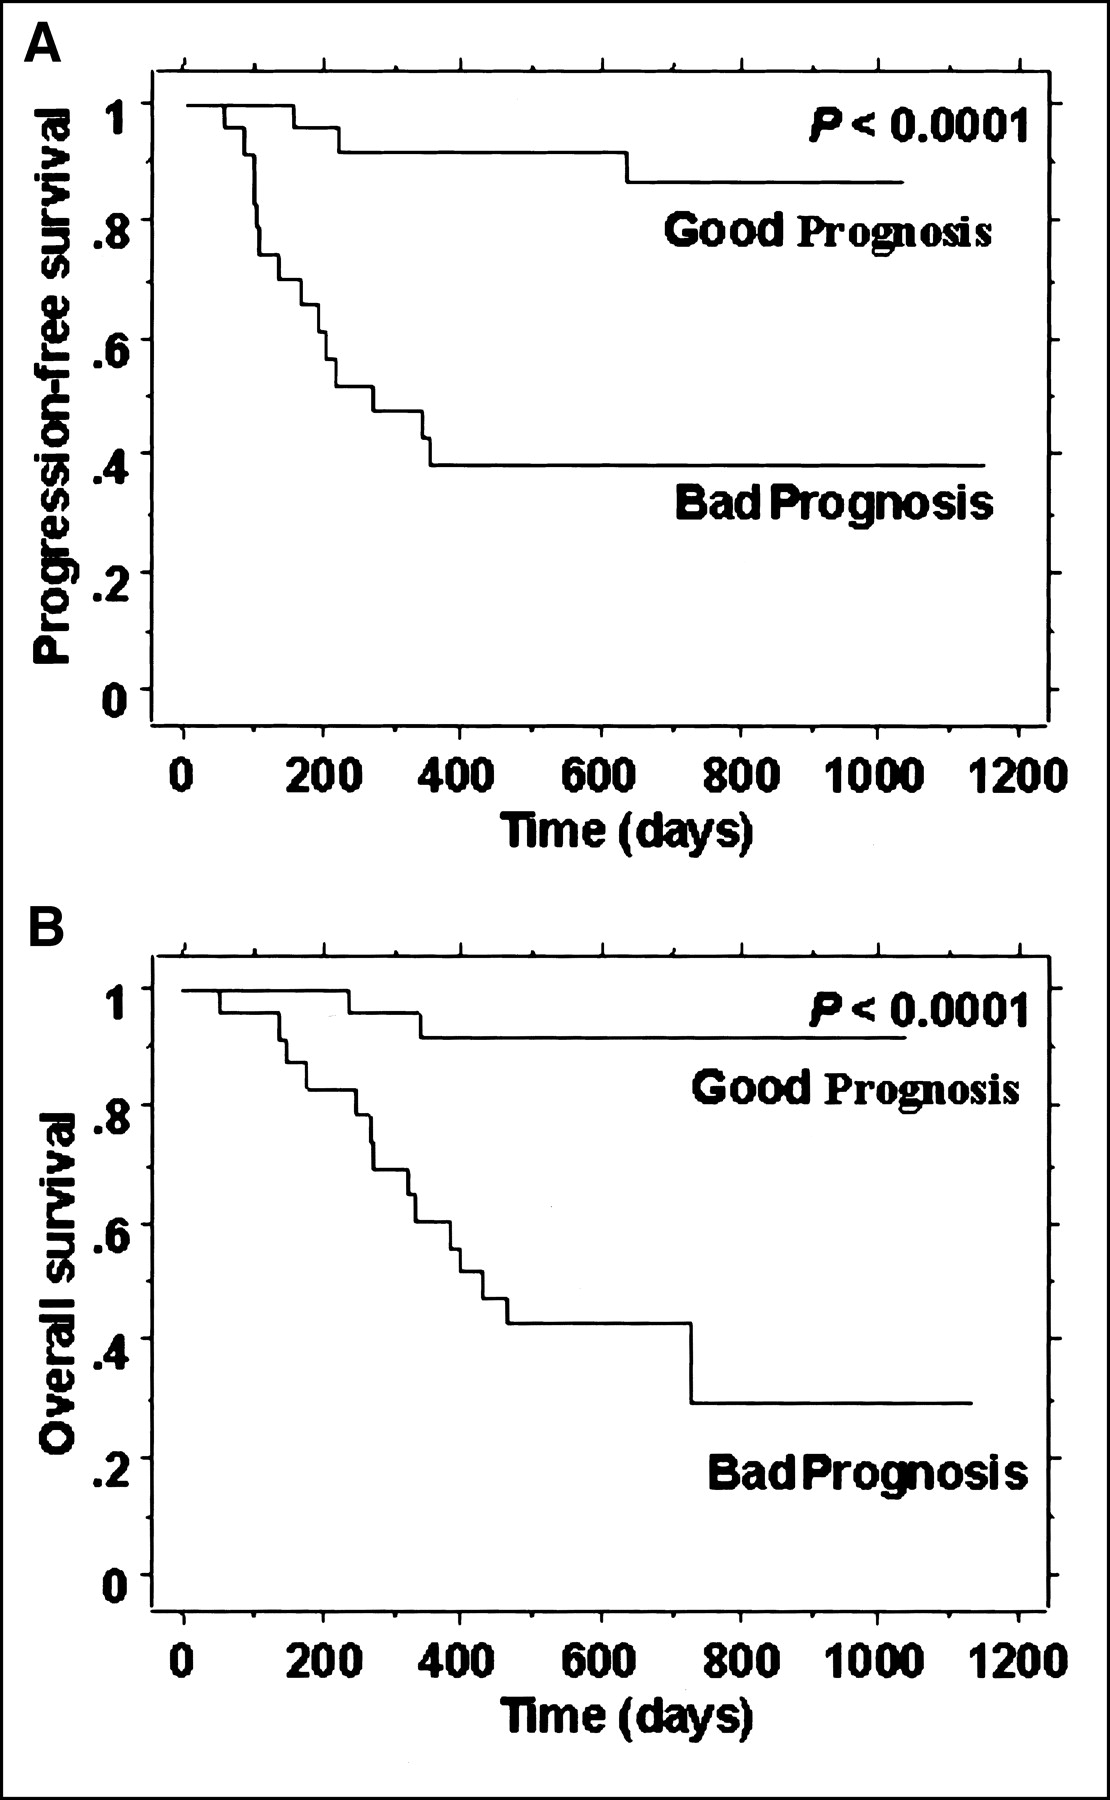
Figure 2 shows the Kaplan-Meier graphs of PFS and OS for observer one. This observer scored 26 patients as having a good prognosis and 21 as having a bad prognosis. The respective numbers were 26 and 21 patients for observer 2 and 30 and 17 patients for observer 3.

(A) PFS for scoring of observer 1. (B) OS for observer 1. Good Prognosis = patients with total score < 4; Bad Prognosis = patients with score ≥ 4.
As an illustration of the computation of likelihood ratios to determine the best cutoff value for scoring, consider the PFS graph shown in Figure 2A, where the cutoff value is 4. At the right end of the graph, the true-positive fraction, or sensitivity (fraction of patients graded as having a bad prognosis and in whom disease recurred), is seen to be 0.69 (1 − survival), and the true-negative fraction, or specificity (fraction of good-prognosis patients in whom disease did not recur), is seen to be 0.87. Thus, the likelihood ratio for this patient is 5.3 (0.69/[1 − 0.87]).
The complete set of likelihood ratios for observer 1 computed for representative cutoff values is shown in Table 3; the results for the other observers were almost identical. Thus, for both PFS and OS, a total image score of 4 or greater gave the best separation between the patients with and the patients without recurrence or death.
Likelihood Ratios as Function of Cutoff Value for Observer 1
The performance of the 3 observers was compared using contingency tables for each combination of observers, as shown in Table 4. Differences in all the pairs of observers were insignificant.
Comparison of Numbers of Patients Scored as Having Bad Prognosis and Good Prognosis by the 3 Pairs of Observers
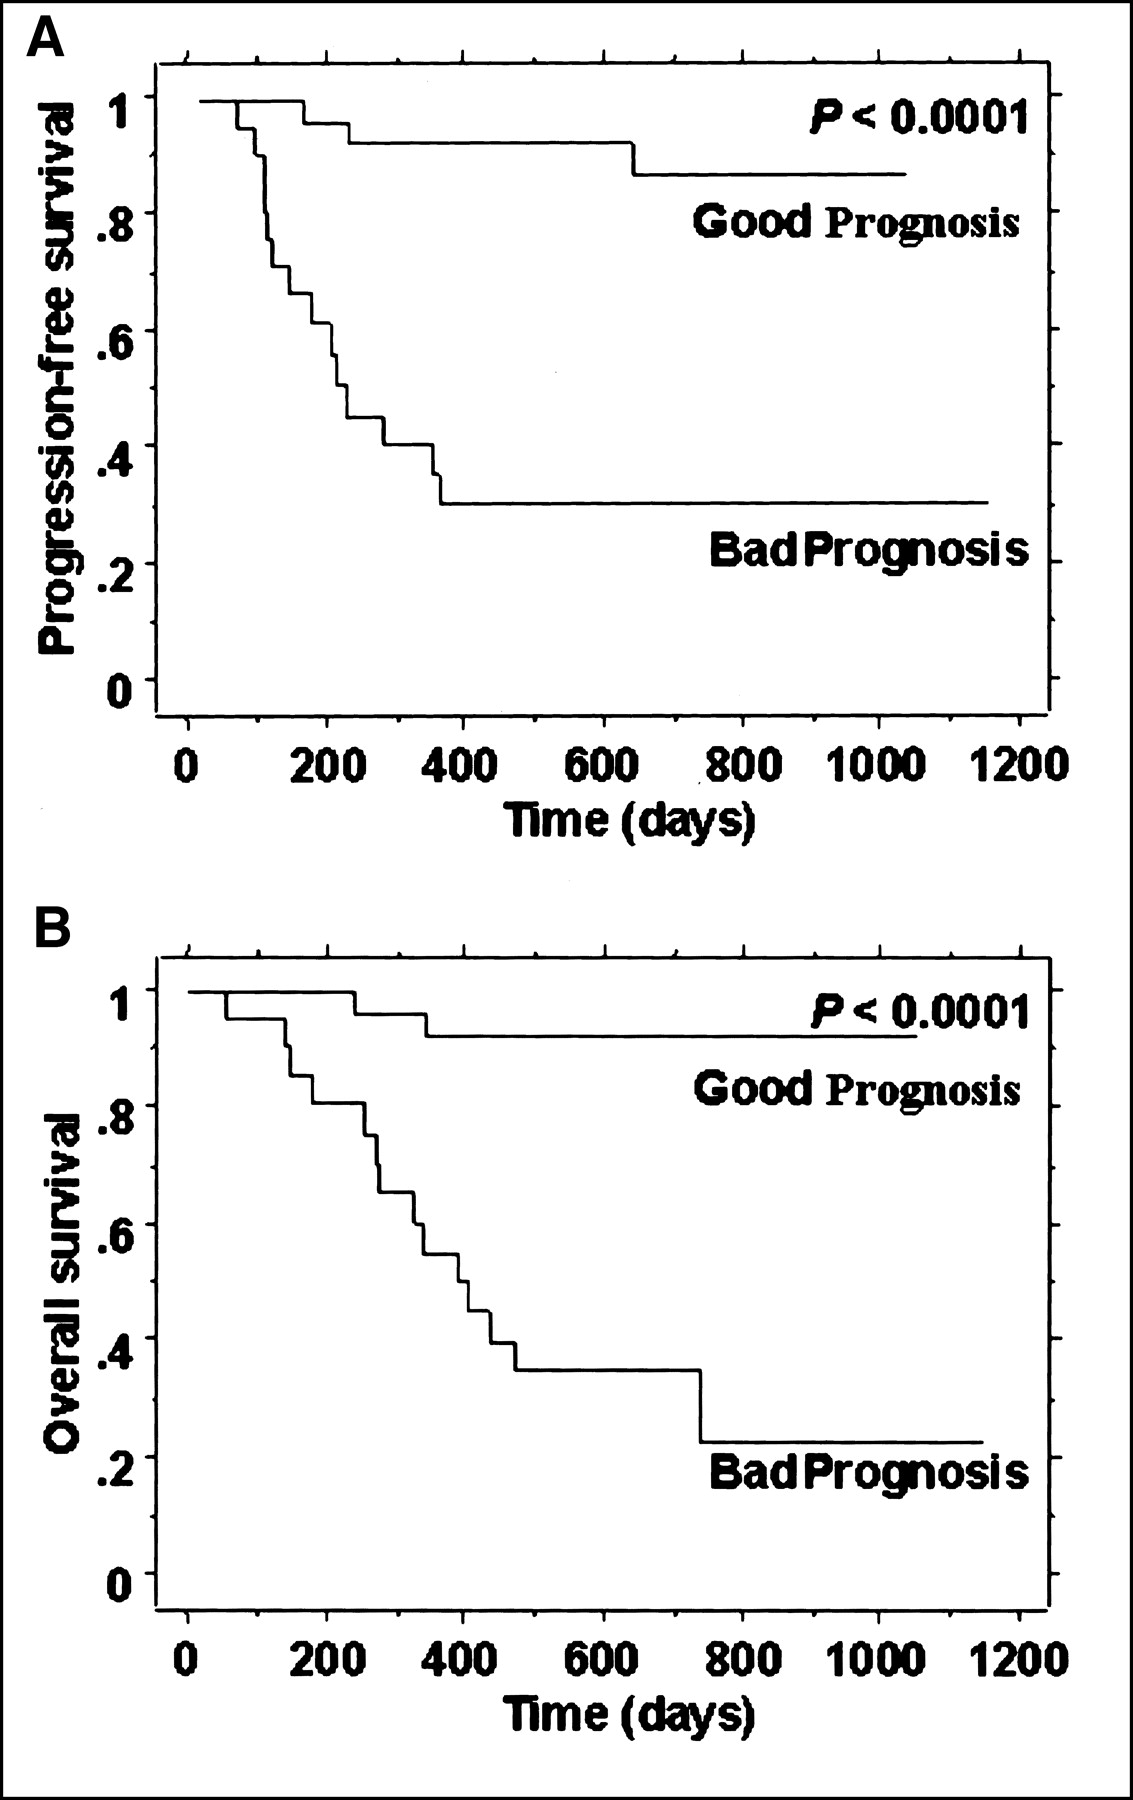
The reproducibility of the readings of the 3 observers is shown most dramatically in Figure 3, where the survival curves for the 3 observers are superimposed. Note the almost identical results for the observers’ independent readings of the studies.

(A) PFS superimposed for the 3 observers. (B) OS for the 3 observers. Good Prognosis = patients with total score < 4; Bad Prognosis = patients with score ≥ 4.
Figure 4 shows the survival graphs using only the lymph node data. The studies were scored as showing the presence or absence of lymph node disease. Although the curves separated the patients who did well from those who did poorly (P = 0.04 and P = 0.03 for PFS and OS, respectively), the distinctions were much less pronounced than when the tumor-grading scheme was added (Figs. 2 and 3). Separate consideration of lymph node involvement at the paraaortic or distant level appeared to separate the groups better, but only 7 patients had disease at these higher levels. Figure 5 shows the graphs for the visual grading of tumor characteristics when the lymph node score was excluded from the scoring. In that case, a score of 3 best separated the groups, as determined by the likelihood-ratio methodology. Note that visual analysis alone (Fig. 5) gave results superior to lymph node grading (Fig. 4) and almost as good as the use of both together (Figs. 2 and 3).

(A) PFS when only lymph node status was considered. (B) OS when only lymph node status was considered. LN negative = no lymph node disease; LN positive = disease at any site.
(A) PFS for scoring of observer 1 when only visual characteristics of tumor were considered. (B) OS for visual characteristic scoring of observer 1. Good Prognosis = patients with total score < 3; Bad Prognosis = patients with score ≥ 3.
DISCUSSION
Cervical cancer is staged by the FIGO system, which is based primarily on physical examination (1). Assessment of prognosis is known to be relatively unreliable by this approach. Thus, imaging methods, including CT, MRI (2–5), and PET (6–11), have been investigated with emphasis on detection of lymph nodes and measurement of the volume of the primary tumor.
In a recent report (12), our group demonstrated that tumor volume could be accurately quantified by 18F-FDG PET. For both PFS and OS, patients were well separated according to whether the tumor volume was more or less than 60 cm3. Although this method was effective, the quantification requires special 3-dimensional software not generally available and, in a small fraction of studies, a somewhat cumbersome manual editing process to eliminate intense bladder activity. Thus, here we investigated a completely visual approach to the evaluation of the PET images, requiring no special computer processing and using only the conventional multislice display software available on all PET systems.
This visual analysis of course included the volume—quickly and easily estimated as small, medium, or large. Our experience with many PET studies on cervical cancer has suggested that tumor shape, either spherical or more tubular, is readily evaluated and potentially important. Because cervical tumors vary markedly in the uniformity of 18F-FDG uptake, an estimate of heterogeneity was included. This nonuniformity is not surprising in view of the potential for regional tumor necrosis, variability in oxygen saturation, and other metabolic factors.
The most important finding of this work was that this visual grading system predicted progression and OS with high accuracy from only a single PET scan before initiation of treatment (Figs. 2 and 3). Indeed, this approach actually yielded better results than did the much more difficult method previously described (12). For PFS, the good-prognosis and bad-prognosis groups were separated into approximately 10% and 50% recurrence in that report but had approximately 10% and 70% separation in the current report (Fig. 3). For OS, the results of the present study were also superior to those reported previously. In the previous study, FIGO stage was not found to predict recurrence or death.
A second important observation was that this evaluation was performed qualitatively, requiring only an additional 1 or 2 min of time without use of specialized software. Although the description of the scoring system (Table 1) appears somewhat quantitative, the grading was, in fact, entirely qualitative and rapid.
Finally, the method was highly reproducible, as shown by the almost identical results achieved by 3 observers having differing levels of experience and interpreting the images independently (Fig. 3; Table 4). Thus, this fast, simple approach could be implemented in any department.
The grading system also incorporated lymph node involvement by tumor, an important prognostic factor documented in a recently reported PET study from our laboratory (7). Although lymph node assessment is a fundamental component in the interpretation of most tumor-imaging studies, we found here that the addition of 3 easily evaluated tumor characteristics significantly improved the estimation of prognosis. A comparison of Figures 4 and 5 shows that the new visual grading system performed better than did analysis of lymph nodes alone. Combining the visual score with lymph node findings (Figs. 2 and 3) led to only a small additional improvement.
The robust nature of this grading scheme appears to arise partly from the correlation of the factors: As tumors grow larger, they tend to become less spherical and more heterogeneous. However, analysis of the factors separately showed a less significant separation of patients and a poorer interobserver correlation than did combined analysis.
A recent study (19) mathematically analyzed the findings described in a large number of articles on measurement or estimation of the tumor volume of many types of cancer by a wide variety of imaging techniques. That study showed that the volume of the tumor is the key factor in prognosis for many cancers. The present work and our previous quantitative article support this conclusion (12). The mathematic analysis of many techniques with quite variable accuracies showed that precision in quantification may not be essential. That observation was also confirmed by this work, in which 3 observers achieved almost identical results from qualitative assessments.
The remarkable quantitative power of PET has led many investigators to emphasize methods based on numeric computation—an approach we followed in our previous study on cervical cancer. The work presented here, using visual assessment by trained observers, lies on a path set out many years ago by two 18F-FDG PET pioneers (20) and is in the spirit of most of medical imaging, which continues to rely on qualitative judgment. Indeed, this method, involving subjective scoring of multiple factors, is somewhat reminiscent of the general grading approach widely used in medicine, such as the American Pediatric Gross Assessment Record used to evaluate newborn infants (21). The PET technique presented here may have applications in other cancers, perhaps by analysis of the same or different characteristics of the tumor.
CONCLUSION
A system is described for visually scoring characteristics of the primary tumor in patients with cervical cancer. This rapid and simple approach leads to a highly accurate and reproducible assessment of prognosis from a single PET scan before initiation of treatment. Although assessment of lymph nodes is valuable, this method appears to perform better than lymph node evaluation and is slightly more effective when the two are combined.
Acknowledgments
This project was supported in part by grant R01 CA85797 from the National Institutes of Health. This work is solely the responsibility of the authors and does not necessarily represent the official views of the National Institutes of Health.
Footnotes
Received Apr. 24, 2002; revision accepted Sep. 17, 2002.
For correspondence contact: Tom R. Miller, MD, PhD, Division of Nuclear Medicine, Mallinckrodt Institute of Radiology, 510 S. Kingshighway Blvd., St. Louis, MO 63110.
E-mail: millert{at}mir.wustl.edu
REFERENCES
In this issue


Jump to section
Related Articles
Cited By...
- Comprehensive analysis of lung cancer pathology images to discover tumor shape features that predict survival outcome
- 18F-FDG PET Uptake Characterization Through Texture Analysis: Investigating the Complementary Nature of Heterogeneity and Functional Tumor Volume in a Multi-Cancer Site Patient Cohort
- Relationship Between 18F-FDG Accumulation and Lactate Dehydrogenase A Expression in Lung Adenocarcinomas
- Visual Versus Quantitative Assessment of Intratumor 18F-FDG PET Uptake Heterogeneity: Prognostic Value in Non-Small Cell Lung Cancer
- Intratumoral Metabolic Heterogeneity of Cervical Cancer
- Selection of Response Criteria for Clinical Trials of Sarcoma Treatment
- PET in Cervical Cancer -- Implications for `Staging,' Treatment Planning, Assessment of Prognosis, and Prediction of Response
- Tumor 18F-FDG Incorporation Is Enhanced by Attenuation of P53 Function in Breast Cancer Cells In Vitro
- Expanding Role of Positron Emission Tomography in Cancer of the Uterine Cervix
- Microvessel Density: Correlation with 18F-FDG Uptake and Prognostic Impact in Lung Adenocarcinomas
- Quantification of 18F-FDG Uptake in Non-Small Cell Lung Cancer: A Feasible Prognostic Marker?
- In Vitro Proton Magnetic Resonance Spectroscopic Lactate and Choline Measurements, 18F-FDG Uptake, and Prognosis in Patients with Lung Adenocarcinoma