
Main menu

  • Home
  • Content
    • Current
    • Ahead of print
    • Past Issues
    • JNM Supplement
    • SNMMI Annual Meeting Abstracts
    • Continuing Education
    • JNM Podcasts
  • Subscriptions
    • Subscribers
    • Institutional and Non-member
    • Rates
    • Journal Claims
    • Corporate & Special Sales
  • Authors
    • Submit to JNM
    • Information for Authors
    • Assignment of Copyright
    • AQARA requirements
  • Info
    • Reviewers
    • Permissions
    • Advertisers
  • About
    • About Us
    • Editorial Board
    • Contact Information
  • More
    • Alerts
    • Feedback
    • Help
    • SNMMI Journals
  • SNMMI
    • JNM
    • JNMT
    • SNMMI Journals
    • SNMMI

User menu

  • Subscribe
  • My alerts
  • Log in
  • My Cart

Search

  • Advanced search
Journal of Nuclear Medicine
  • SNMMI
    • JNM
    • JNMT
    • SNMMI Journals
    • SNMMI
  • Subscribe
  • My alerts
  • Log in
  • My Cart
Journal of Nuclear Medicine

Advanced Search

  • Home
  • Content
    • Current
    • Ahead of print
    • Past Issues
    • JNM Supplement
    • SNMMI Annual Meeting Abstracts
    • Continuing Education
    • JNM Podcasts
  • Subscriptions
    • Subscribers
    • Institutional and Non-member
    • Rates
    • Journal Claims
    • Corporate & Special Sales
  • Authors
    • Submit to JNM
    • Information for Authors
    • Assignment of Copyright
    • AQARA requirements
  • Info
    • Reviewers
    • Permissions
    • Advertisers
  • About
    • About Us
    • Editorial Board
    • Contact Information
  • More
    • Alerts
    • Feedback
    • Help
    • SNMMI Journals
  • View or Listen to JNM Podcast
  • Visit JNM on Facebook
  • Join JNM on LinkedIn
  • Follow JNM on Twitter
  • Subscribe to our RSS feeds
OtherBasic Science Investigations

Determination of Regional Flow by Use of Intravascular PET Tracers: Microvascular Theory and Experimental Validation for Pig Livers

Ole Lajord Munk, Ludvik Bass, Howard Feng and Susanne Keiding
Journal of Nuclear Medicine November 2003, 44 (11) 1862-1870;
Ole Lajord Munk
  • Find this author on Google Scholar
  • Find this author on PubMed
  • Search for this author on this site
Ludvik Bass
  • Find this author on Google Scholar
  • Find this author on PubMed
  • Search for this author on this site
Howard Feng
  • Find this author on Google Scholar
  • Find this author on PubMed
  • Search for this author on this site
Susanne Keiding
  • Find this author on Google Scholar
  • Find this author on PubMed
  • Search for this author on this site
  • Article
  • Figures & Data
  • Info & Metrics
  • PDF
Loading

Article Figures & Data

Figures

  • Tables
  • FIGURE 1.
    • Download figure
    • Open in new tab
    • Download powerpoint
    FIGURE 1.

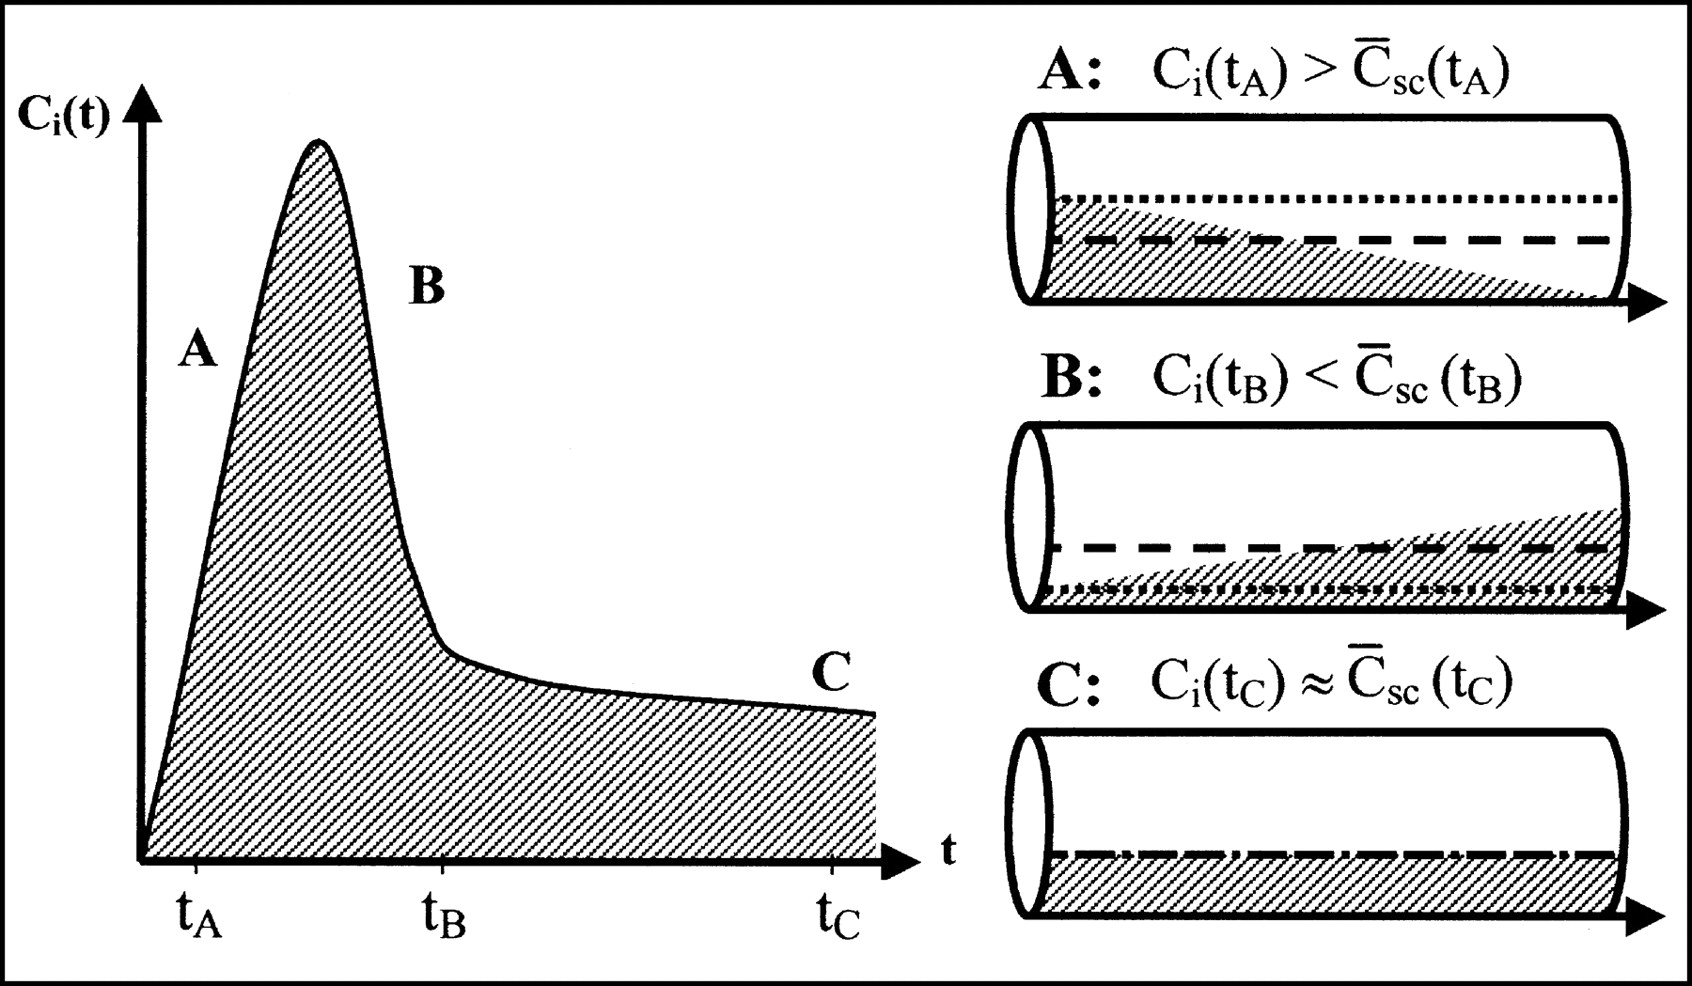
    Differences in tracer concentrations in vascular volume determined with compartment model and single-capillary microvascular model. (Left) Measured inlet time–activity curve after tracer bolus. During dynamic phase, ROI inlet concentration Ci(t) rises (A), reaches its maximum, and falls (B) toward steady state (C). (Right) Concentration profiles in capillary at times tA, tB, and tC, corresponding to situations A, B, and C, respectively. Arrows show direction of flow. Dotted lines show inlet concentrations used in compartment model. Dashed lines show spatially averaged concentrations used in microvascular models. Use of inlet concentrations overestimates amount of tracer present in organ in rising part of bolus (A) and underestimates it in falling part of bolus (B). Error is most significant in early dynamic phase with large gradients. Later, when steady state is approached (C), error becomes smaller.

  • FIGURE 2.
    • Download figure
    • Open in new tab
    • Download powerpoint
    FIGURE 2.

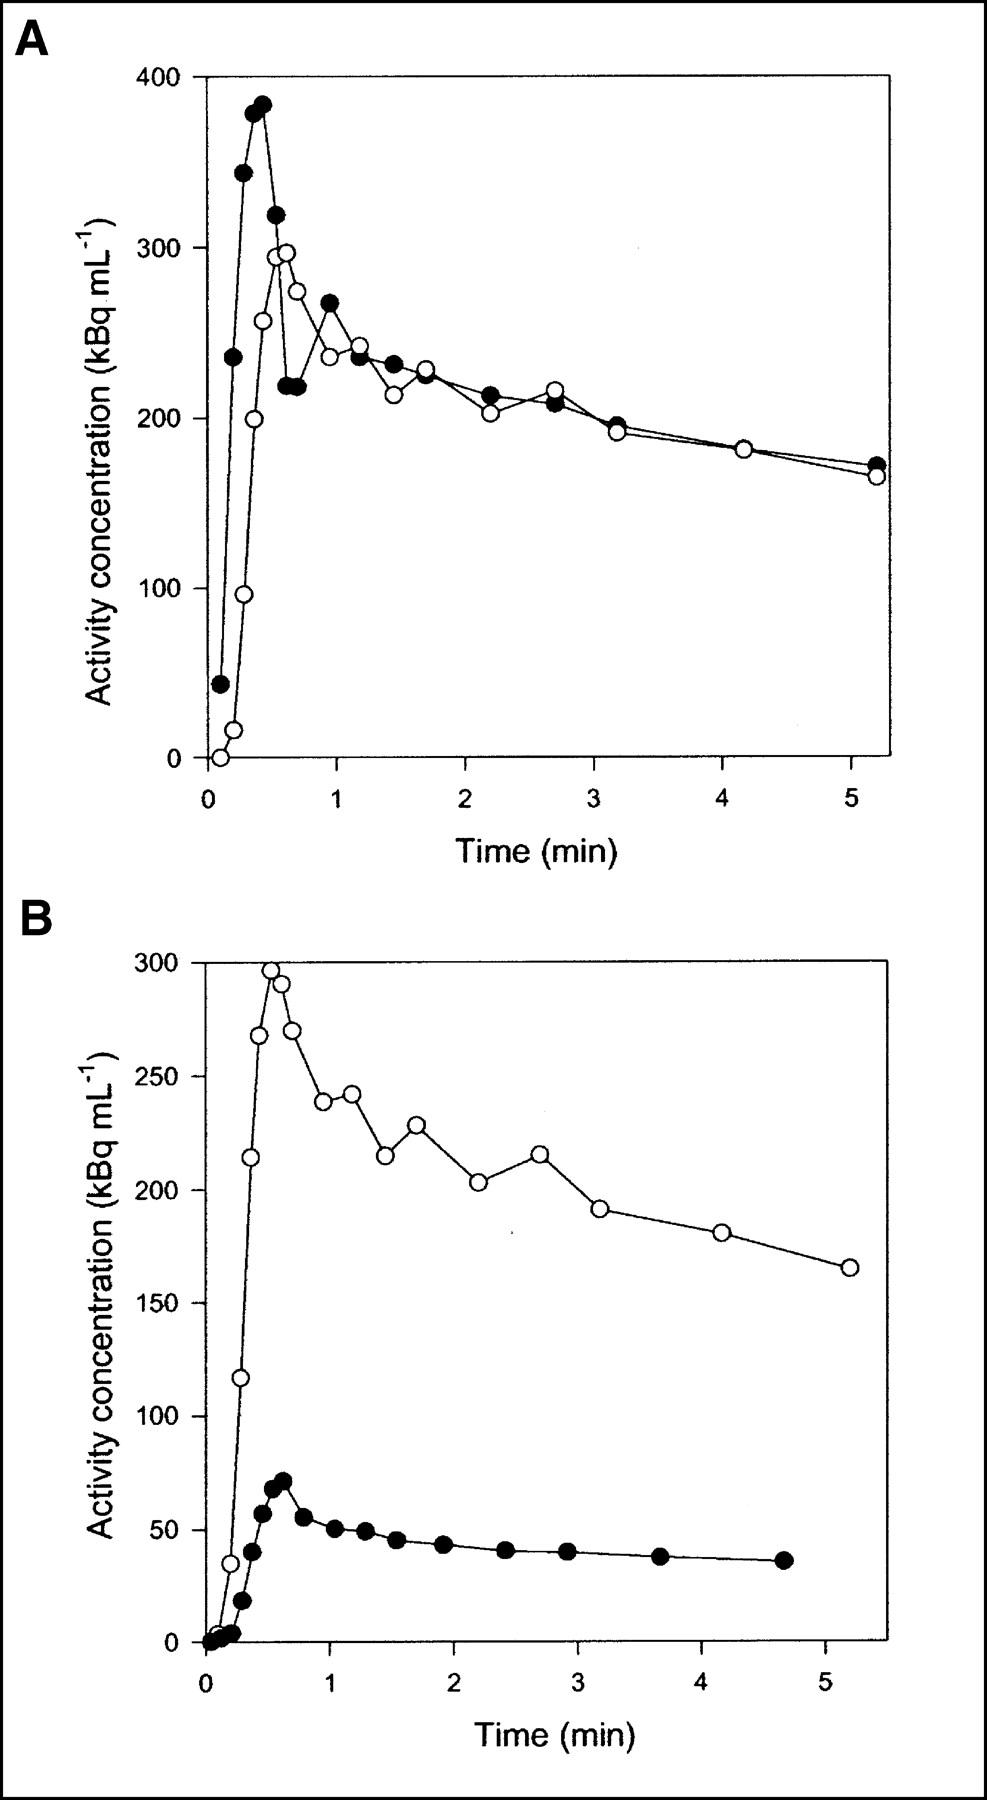
    Typical time–activity curves after 15O-CO inhalation (pig 4). (A) Black circles = HA blood time–activity curve; white circles = PV blood time–activity curve. (B) Black circles = liver tissue PET time–activity curve; white circles = dual-input blood time–activity curve.

  • FIGURE 3.
    • Download figure
    • Open in new tab
    • Download powerpoint
    FIGURE 3.

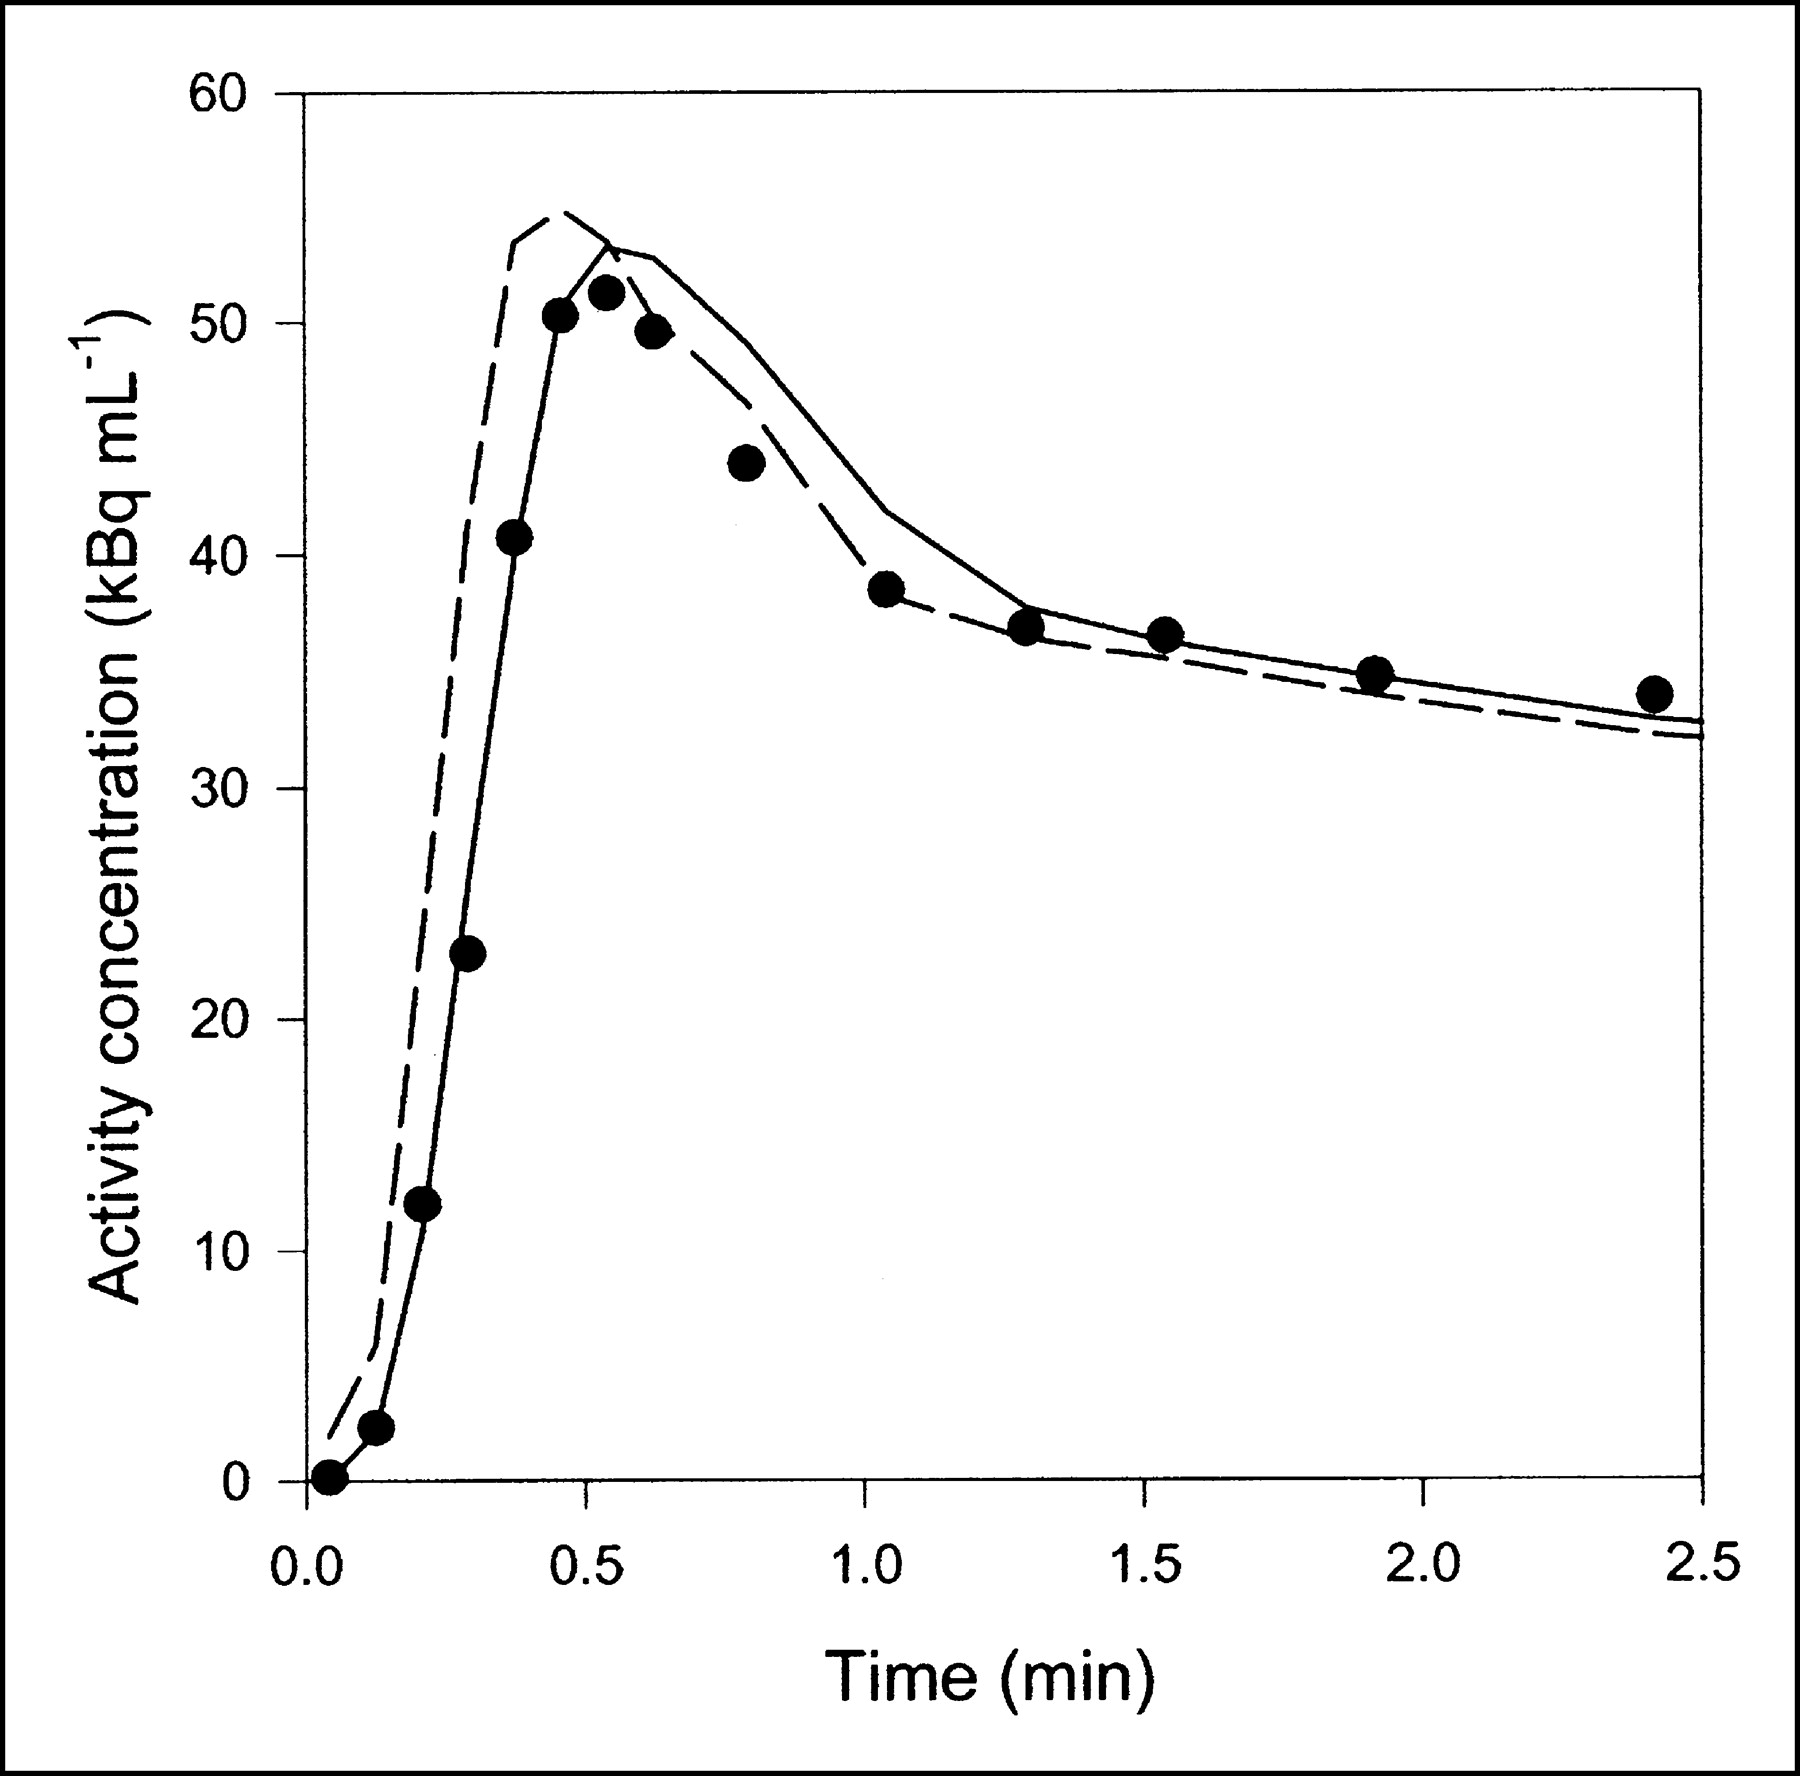
    Typical liver tissue PET time–activity curve after 15O-CO inhalation (pig 2), fitted with 2 models. Only initial 2.5 min are shown, when differences between models were most pronounced. Black circles = liver PET data; dashed line = compartment model with dual input; solid line = multiple-capillary microvascular model. Fit obtained with single-capillary microvascular model has time course very similar to that of fit obtained with multiple-capillary microvascular model.

  • FIGURE 4.
    • Download figure
    • Open in new tab
    • Download powerpoint
    FIGURE 4.

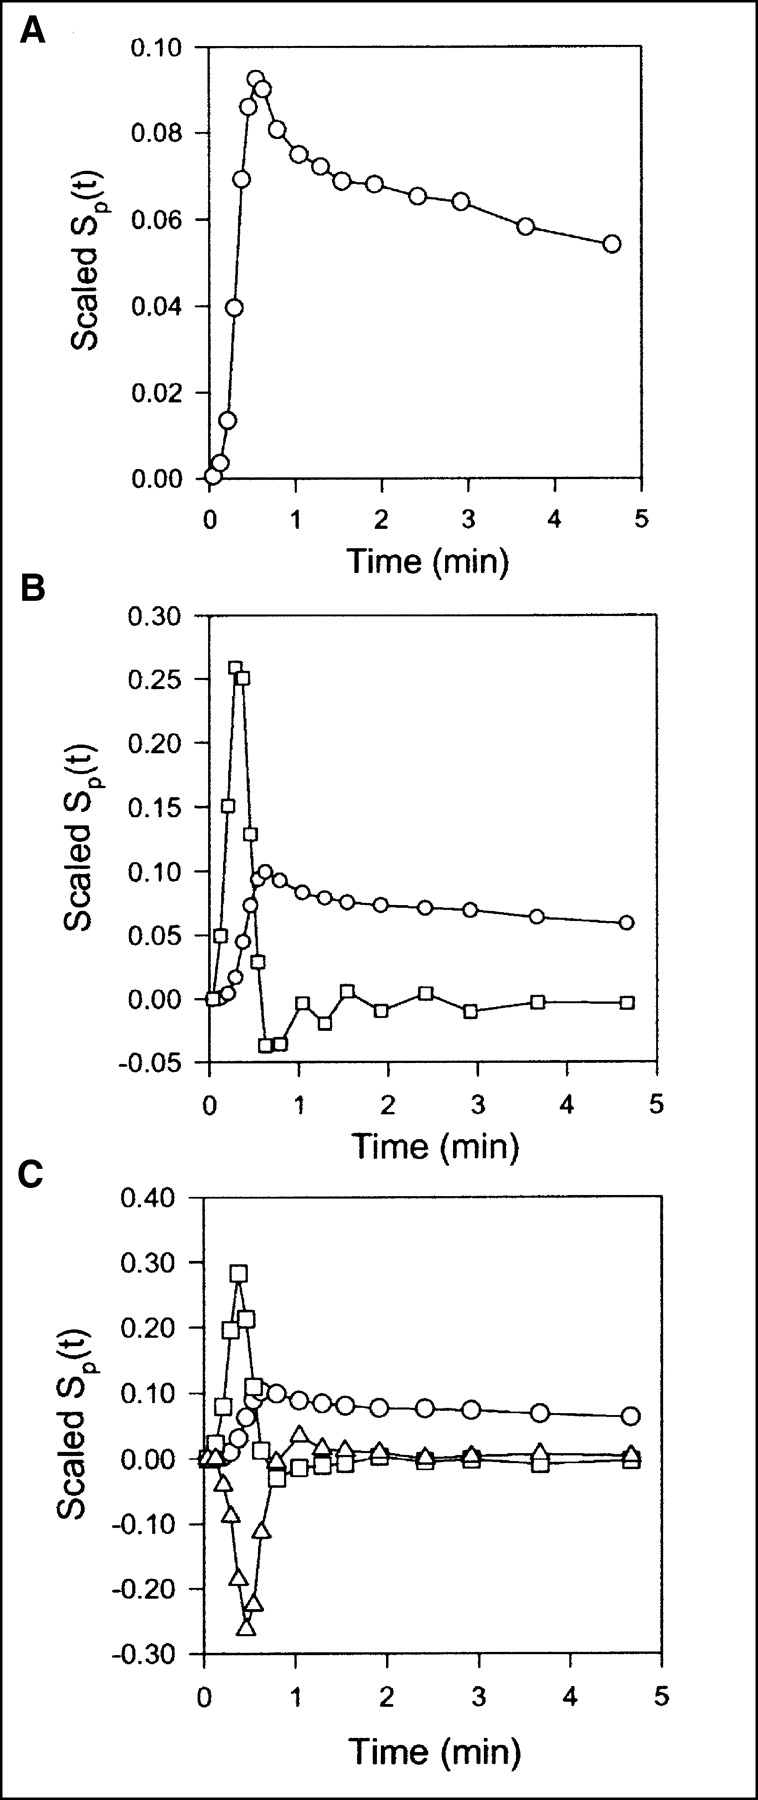
    Scaled sensitivity function Sp(t) obtained with data from pig 2. Scaled Sp(t) is calculated at each point, and lines are linear interpolations. All sensitivity functions are scaled to emphasize shapes. (A) Standard compartment model. Circles = V0. (B) Single-capillary microvascular model. Circles = Vb; squares = F. (C) Multicapillary microvascular model. Circles = Vb; squares = F; triangles = σ.

  • FIGURE 5.
    • Download figure
    • Open in new tab
    • Download powerpoint
    FIGURE 5.

    Regional blood flow estimated by single-capillary microvascular model plotted against normalized total flow measured by flow meters (n = 8). Triangles = flow estimated without synchronization; squares = flow estimated with synchronization; solid line = identity line. In all instances, synchronization brings data sets together and induces lower flow estimates in closer agreement to normalized organ blood flow.

  • FIGURE 6.
    • Download figure
    • Open in new tab
    • Download powerpoint
    FIGURE 6.

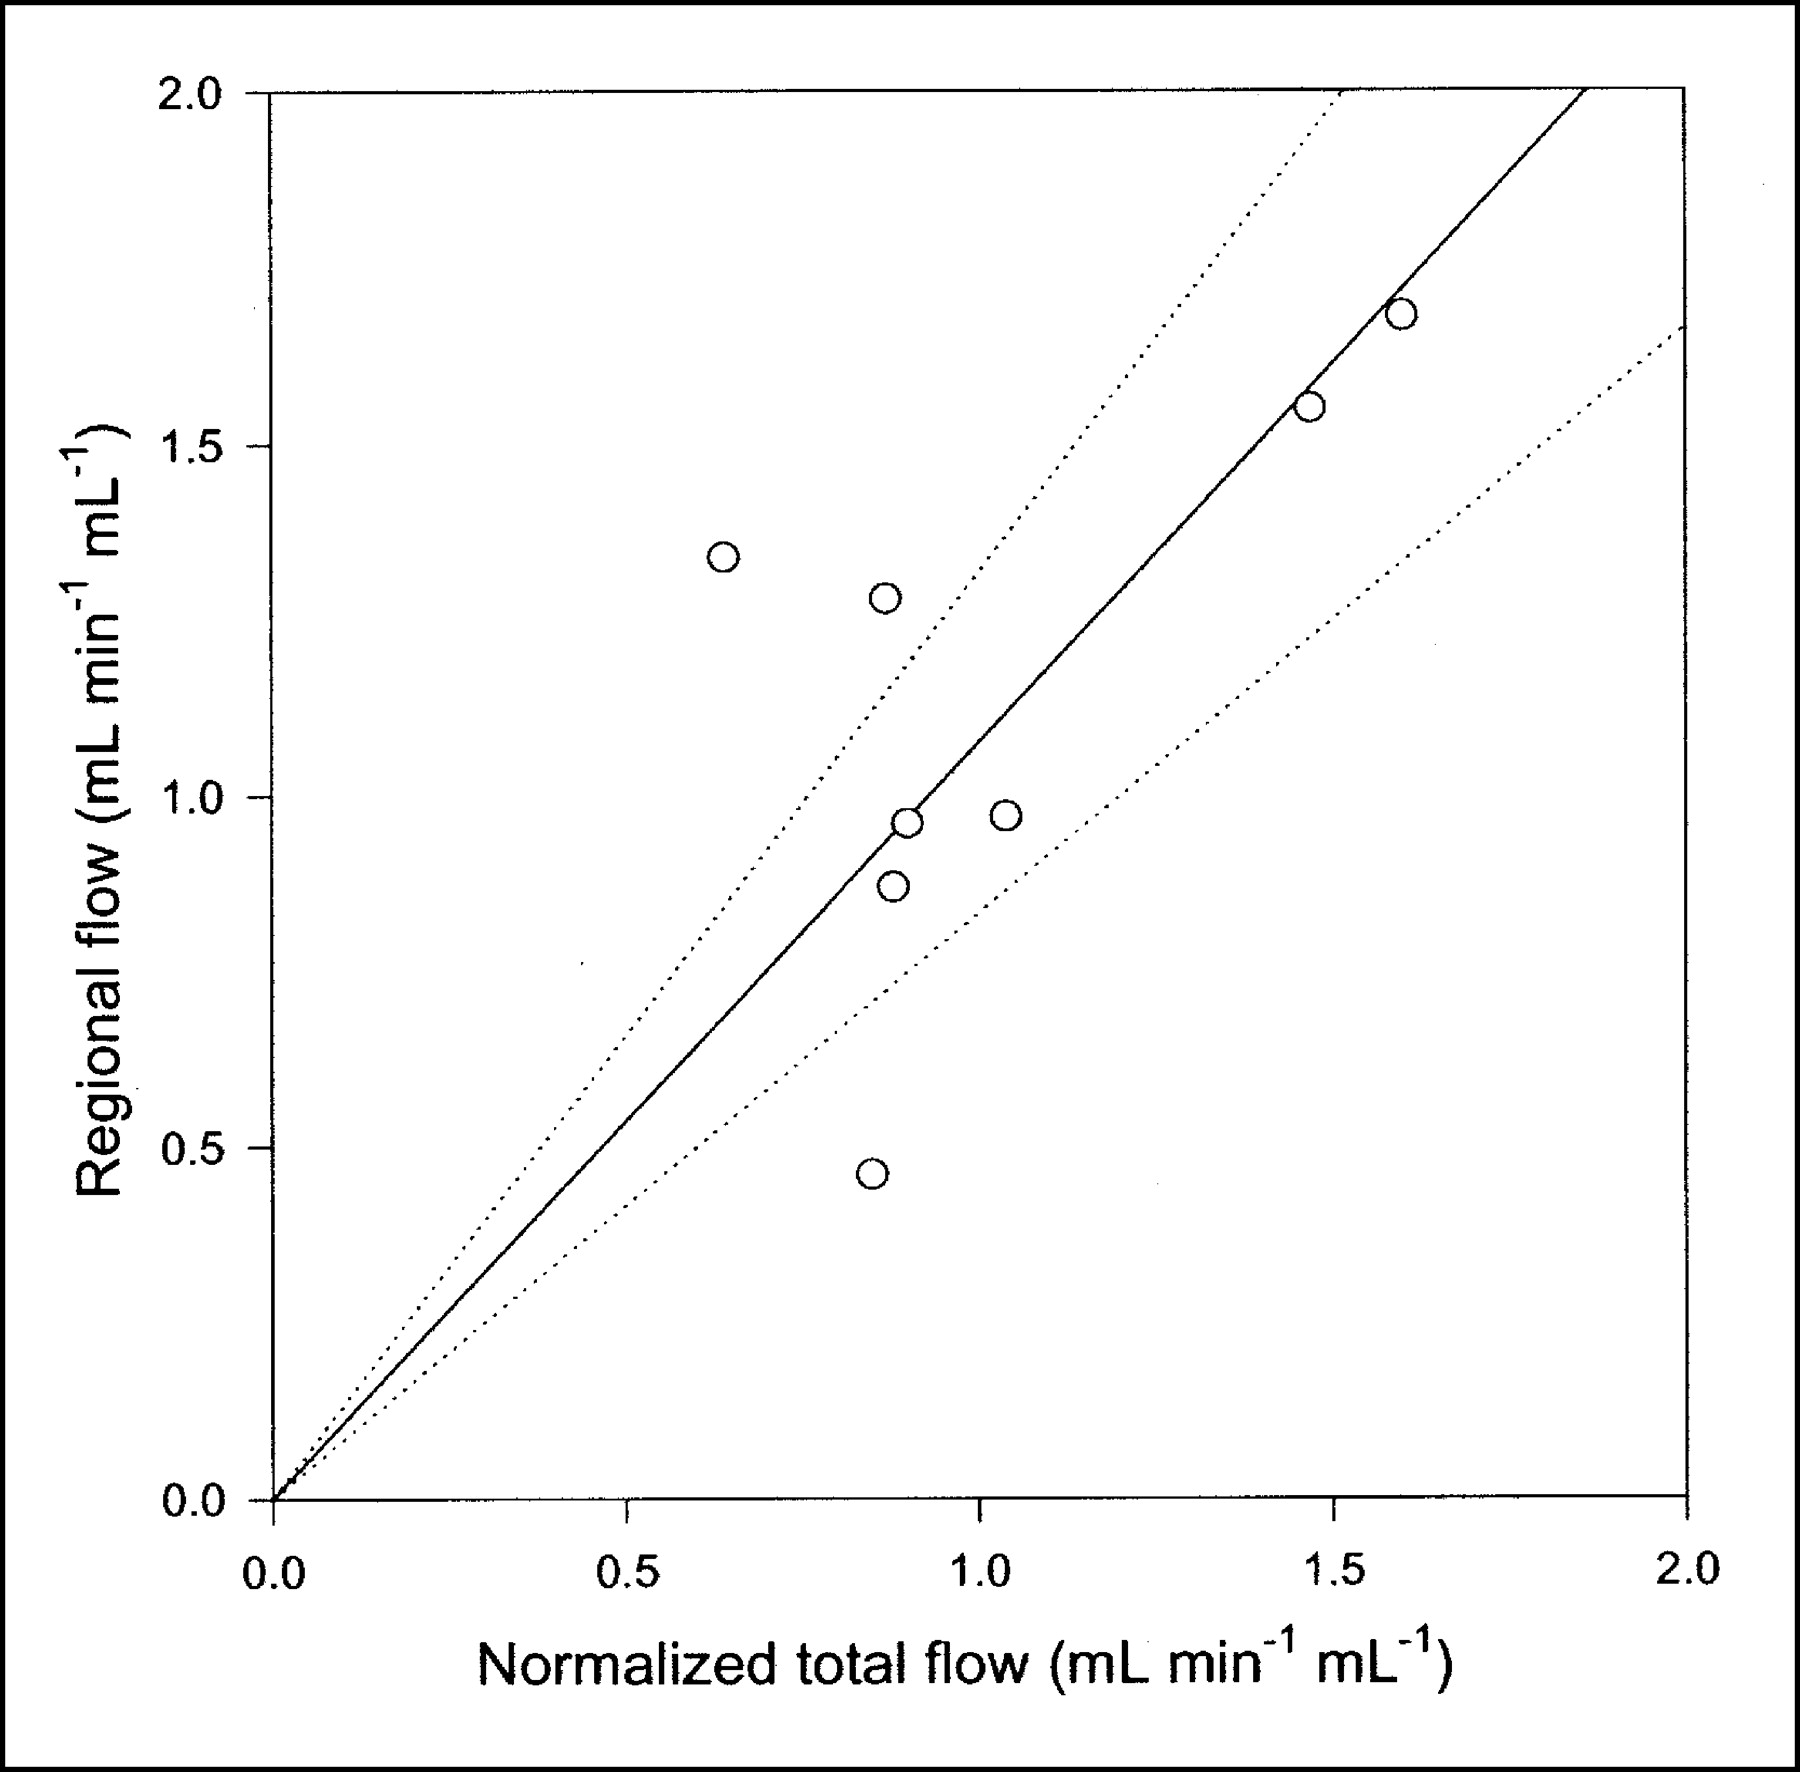
    Regional blood flow estimated by multiple-capillary microvascular model with synchronization plotted against normalized total flow measured by flow meters (n = 8). Solid line = linear regression through origin; dotted lines = 95% confidence intervals.

  • FIGURE 7.
    • Download figure
    • Open in new tab
    • Download powerpoint
    FIGURE 7.

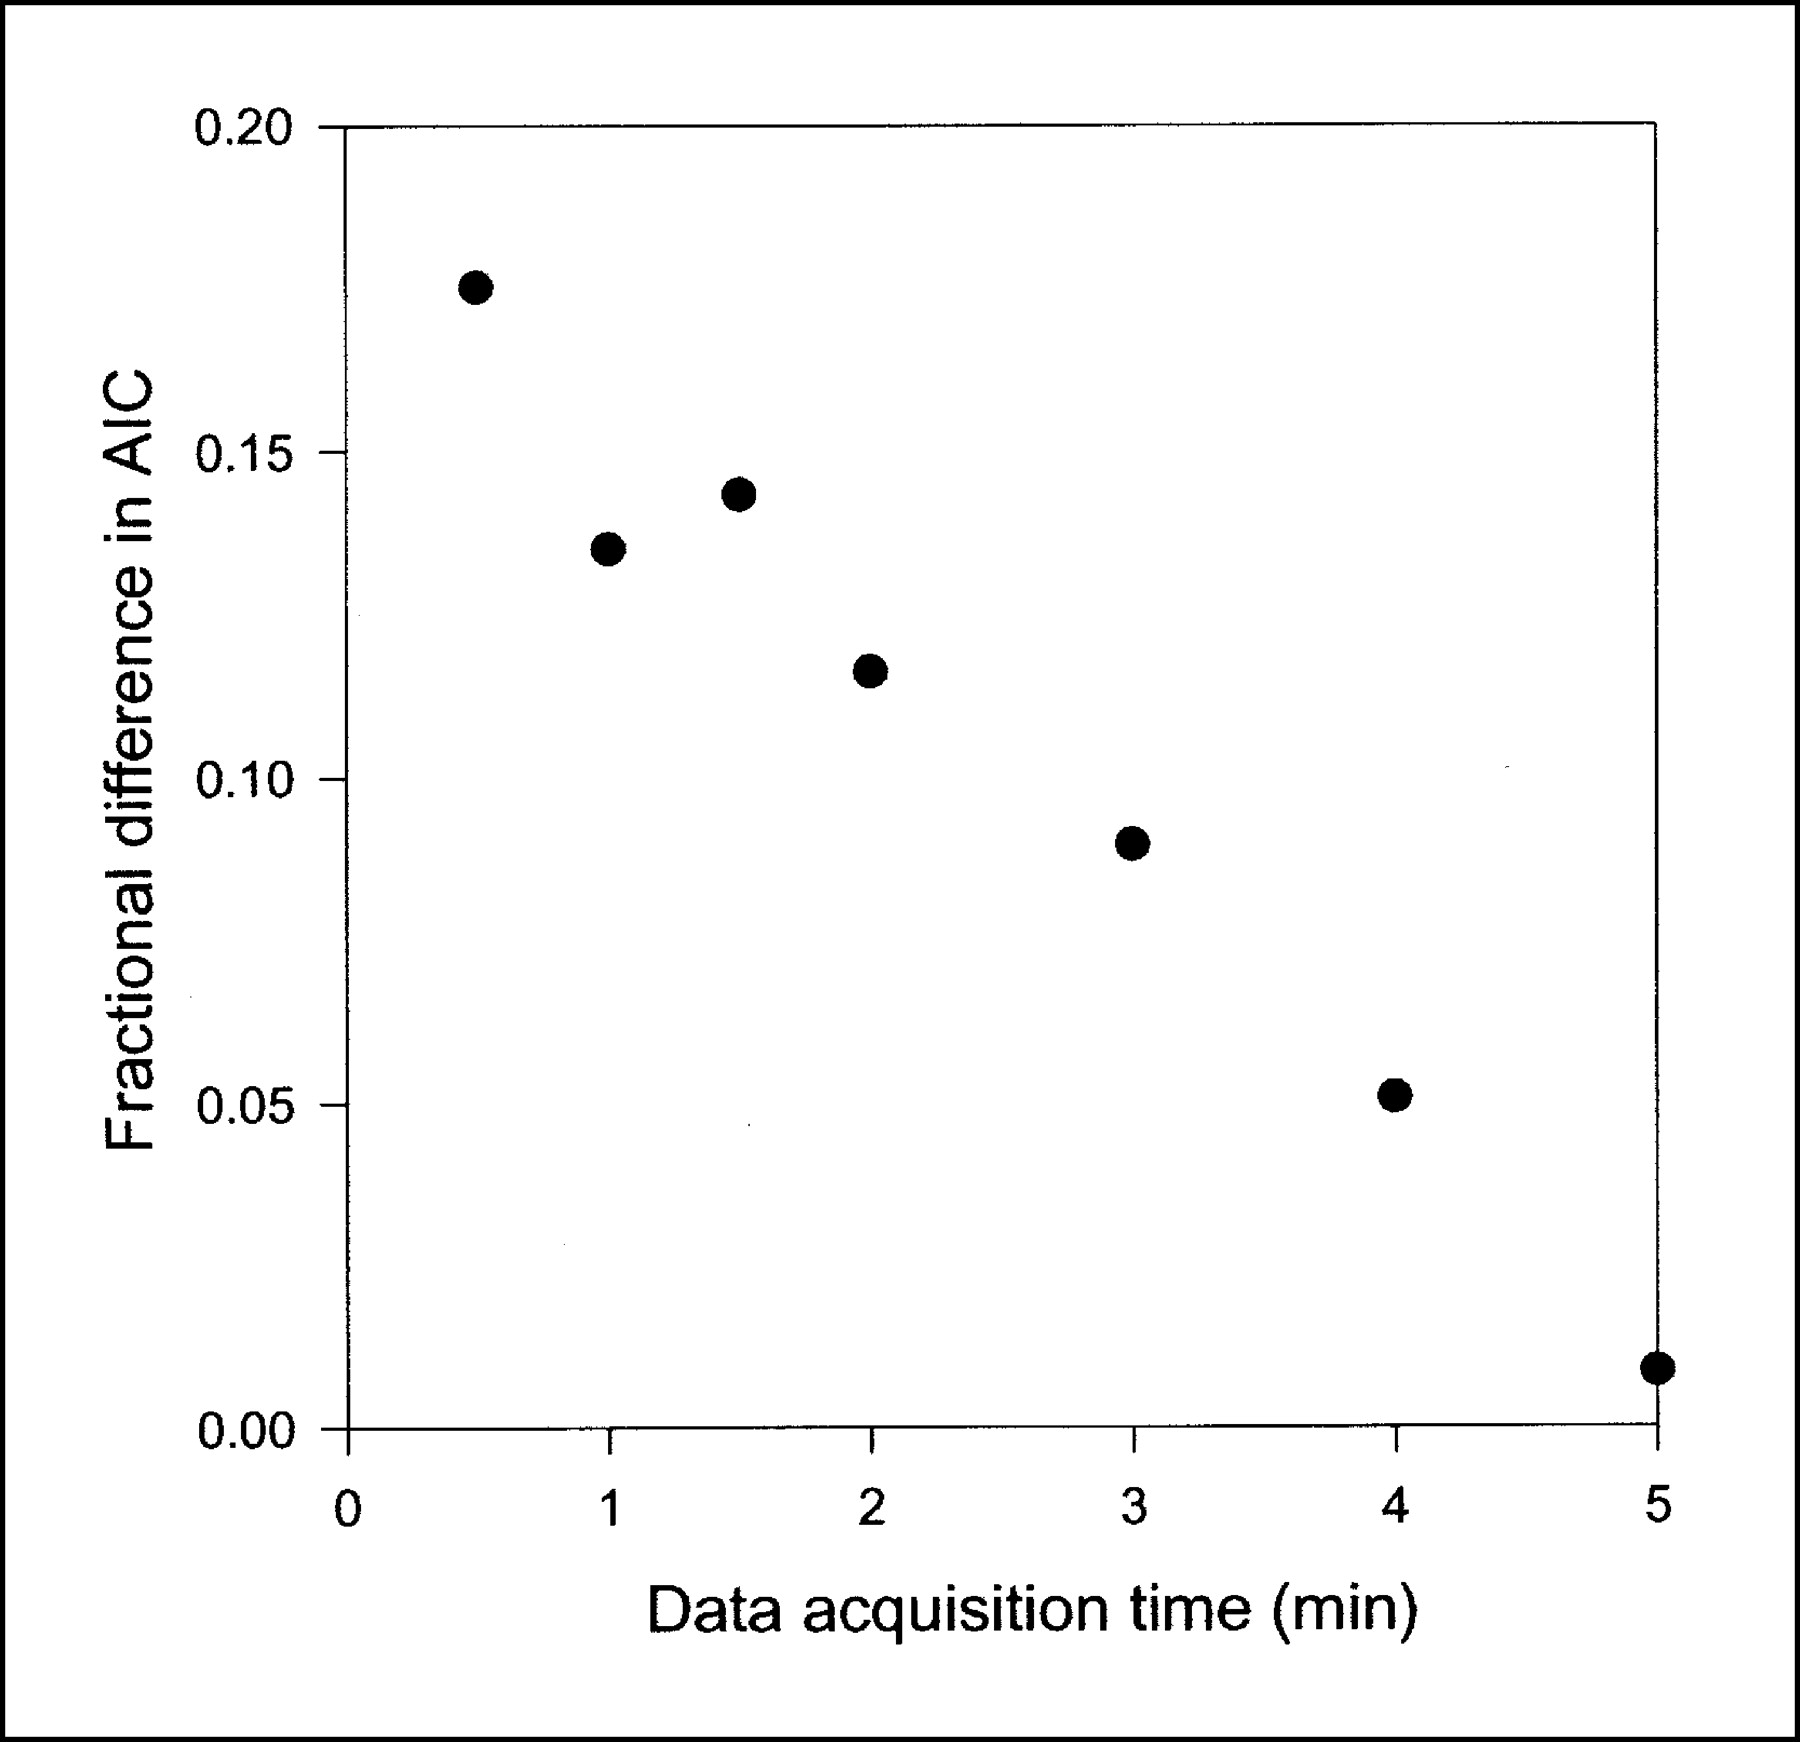
    Fractional difference in AIC scores between compartment model and single-capillary microvascular model with synchronization as function of data acquisition time. Points represent mean fractional difference in AICs calculated as (AIC for the compartment model − AIC for the microvascular model)/AIC for the microvascular model (n = 8). Shorter data acquisition times were simulated by skipping late PET data. When all data up to 5 min were used, AICs were almost the same for 2 models, but as data acquisition time became shorter, the effect on AICs of using physiologically richer microvascular model became more apparent.

Tables

  • Figures
    • View popup
    TABLE 1

    Parameter Estimates and Statistical Criteria for Three Models

    ParameterMean ± SEM value (n = 8) for the following model:
    CompartmentSingle-capillary microvascularMulticapillary microvascular
    V (mL mL−1)*0.18 ± 0.010.19 ± 0.010.19 ± 0.01
    F (mL min−1 mL−1)†1.3 ± 0.31.14 ± 0.14
    CoV‡0.9 ± 0.2
    AIC98 ± 693 ± 798 ± 6
    • ↵* Volume parameter (V) is V0 for compartment model and Vb for microvascular models.

    • ↵† Mean normalized liver blood flow (F) measured by flow meters was 1.03 ± 0.12 mL min−1 mL−1.

    • ↵‡ Coefficient of variation (CoV) is σ/T̄.

PreviousNext
Back to top

In this issue

Journal of Nuclear Medicine
Vol. 44, Issue 11
November 1, 2003
  • Table of Contents
  • Index by author
Print
Download PDF
Article Alerts
Sign In to Email Alerts with your Email Address
Email Article

Thank you for your interest in spreading the word on Journal of Nuclear Medicine.

NOTE: We only request your email address so that the person you are recommending the page to knows that you wanted them to see it, and that it is not junk mail. We do not capture any email address.

Enter multiple addresses on separate lines or separate them with commas.
Determination of Regional Flow by Use of Intravascular PET Tracers: Microvascular Theory and Experimental Validation for Pig Livers
(Your Name) has sent you a message from Journal of Nuclear Medicine
(Your Name) thought you would like to see the Journal of Nuclear Medicine web site.
Citation Tools
Determination of Regional Flow by Use of Intravascular PET Tracers: Microvascular Theory and Experimental Validation for Pig Livers
Ole Lajord Munk, Ludvik Bass, Howard Feng, Susanne Keiding
Journal of Nuclear Medicine Nov 2003, 44 (11) 1862-1870;

Citation Manager Formats

  • BibTeX
  • Bookends
  • EasyBib
  • EndNote (tagged)
  • EndNote 8 (xml)
  • Medlars
  • Mendeley
  • Papers
  • RefWorks Tagged
  • Ref Manager
  • RIS
  • Zotero
Share
Determination of Regional Flow by Use of Intravascular PET Tracers: Microvascular Theory and Experimental Validation for Pig Livers
Ole Lajord Munk, Ludvik Bass, Howard Feng, Susanne Keiding
Journal of Nuclear Medicine Nov 2003, 44 (11) 1862-1870;
Twitter logo Facebook logo LinkedIn logo Mendeley logo
  • Tweet Widget
  • Facebook Like
  • Google Plus One
Bookmark this article

Jump to section

  • Article
    • Abstract
    • MATERIALS AND METHODS
    • RESULTS
    • DISCUSSION
    • CONCLUSION
    • Acknowledgments
    • Footnotes
    • REFERENCES
  • Figures & Data
  • Info & Metrics
  • PDF

Related Articles

  • No related articles found.
  • PubMed
  • Google Scholar

Cited By...

  • Bringing Physiology into PET of the Liver
  • Google Scholar

More in this TOC Section

  • 11C-Methionine PET of Myocardial Inflammation in a Rat Model of Experimental Autoimmune Myocarditis
  • Counting Rate Characteristics and Image Distortion in Preclinical PET Imaging During Radiopharmaceutical Therapy
  • Design and Fabrication of Kidney Phantoms for Internal Radiation Dosimetry Using 3D Printing Technology
Show more Basic Science Investigations

Similar Articles

SNMMI

© 2025 SNMMI

Powered by HighWire