
Main menu

  • Home
  • Content
    • Current
    • Ahead of print
    • Past Issues
    • JNM Supplement
    • SNMMI Annual Meeting Abstracts
    • Continuing Education
    • JNM Podcasts
  • Subscriptions
    • Subscribers
    • Institutional and Non-member
    • Rates
    • Journal Claims
    • Corporate & Special Sales
  • Authors
    • Submit to JNM
    • Information for Authors
    • Assignment of Copyright
    • AQARA requirements
  • Info
    • Reviewers
    • Permissions
    • Advertisers
  • About
    • About Us
    • Editorial Board
    • Contact Information
  • More
    • Alerts
    • Feedback
    • Help
    • SNMMI Journals
  • SNMMI
    • JNM
    • JNMT
    • SNMMI Journals
    • SNMMI

User menu

  • Subscribe
  • My alerts
  • Log in
  • My Cart

Search

  • Advanced search
Journal of Nuclear Medicine
  • SNMMI
    • JNM
    • JNMT
    • SNMMI Journals
    • SNMMI
  • Subscribe
  • My alerts
  • Log in
  • My Cart
Journal of Nuclear Medicine

Advanced Search

  • Home
  • Content
    • Current
    • Ahead of print
    • Past Issues
    • JNM Supplement
    • SNMMI Annual Meeting Abstracts
    • Continuing Education
    • JNM Podcasts
  • Subscriptions
    • Subscribers
    • Institutional and Non-member
    • Rates
    • Journal Claims
    • Corporate & Special Sales
  • Authors
    • Submit to JNM
    • Information for Authors
    • Assignment of Copyright
    • AQARA requirements
  • Info
    • Reviewers
    • Permissions
    • Advertisers
  • About
    • About Us
    • Editorial Board
    • Contact Information
  • More
    • Alerts
    • Feedback
    • Help
    • SNMMI Journals
  • View or Listen to JNM Podcast
  • Visit JNM on Facebook
  • Join JNM on LinkedIn
  • Follow JNM on Twitter
  • Subscribe to our RSS feeds
OtherBasic Science Investigations

Assessment of Treatment Response by Autoradiography with 14C-Aminocyclopentane Carboxylic Acid, 67Ga-DTPA, and 18F-FDG in a Herpes Simplex Virus Thymidine Kinase/Ganciclovir Brain Tumor Model

Tadashi Miyagawa, Takamitsu Oku, Toshio Sasajima, Rovathi Dasai, Bradley Beattie, Ronald Finn, Juri Gelovani Tjuvajev and Ronald Blasberg
Journal of Nuclear Medicine November 2003, 44 (11) 1845-1854;
Tadashi Miyagawa
  • Find this author on Google Scholar
  • Find this author on PubMed
  • Search for this author on this site
Takamitsu Oku
  • Find this author on Google Scholar
  • Find this author on PubMed
  • Search for this author on this site
Toshio Sasajima
  • Find this author on Google Scholar
  • Find this author on PubMed
  • Search for this author on this site
Rovathi Dasai
  • Find this author on Google Scholar
  • Find this author on PubMed
  • Search for this author on this site
Bradley Beattie
  • Find this author on Google Scholar
  • Find this author on PubMed
  • Search for this author on this site
Ronald Finn
  • Find this author on Google Scholar
  • Find this author on PubMed
  • Search for this author on this site
Juri Gelovani Tjuvajev
  • Find this author on Google Scholar
  • Find this author on PubMed
  • Search for this author on this site
Ronald Blasberg
  • Find this author on Google Scholar
  • Find this author on PubMed
  • Search for this author on this site
  • Article
  • Figures & Data
  • Info & Metrics
  • PDF
Loading

Article Figures & Data

Figures

  • Tables
  • FIGURE 1.
    • Download figure
    • Open in new tab
    • Download powerpoint
    FIGURE 1.

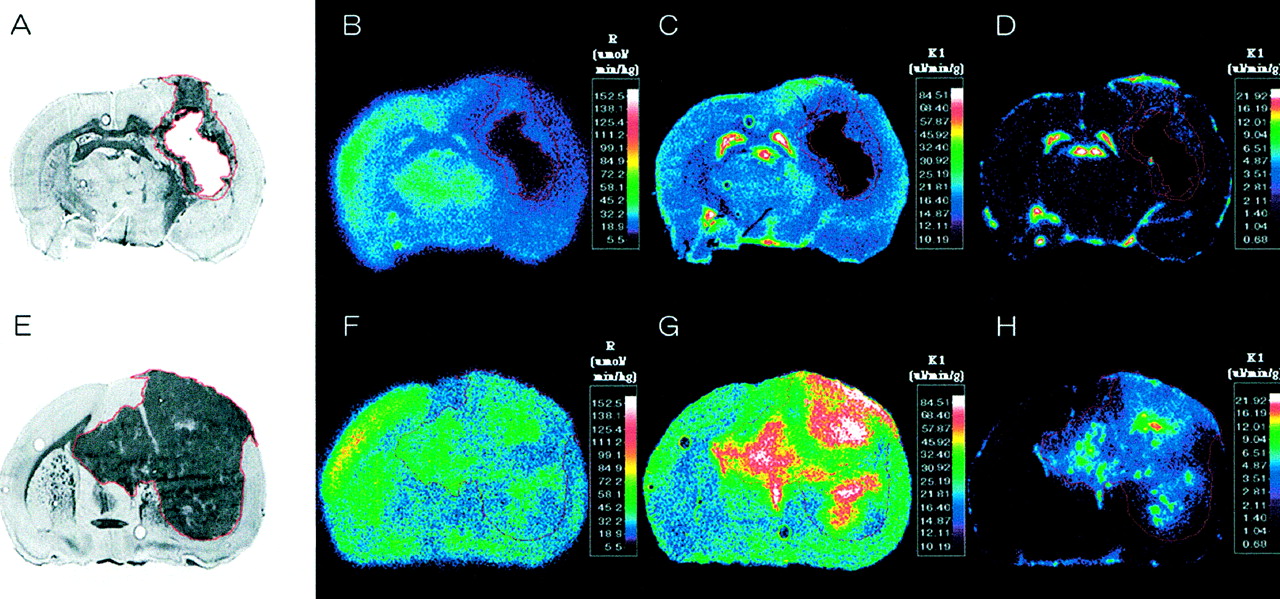
    Corresponding images from 2 intracerebral RG2TK+ xenografts: one treated with gancyclovir (A–D) and the other treated with normal saline (control; E–H). From left to right are toluidine blue-stained histology (A and E) and parametric images of R measured with 18F-FDG (B and F), K1 of 14C-ACPC (C and G), and K1 of 67Ga-DTPA (D and H). Histology and parametric images for each animal were obtained from same tissue section. Parametric images are color coded to a range of values. Tumor outline (in red) was drawn on histologic image and electronically transferred to previously registered autoradiographic images.

  • FIGURE 2.
    • Download figure
    • Open in new tab
    • Download powerpoint
    FIGURE 2.

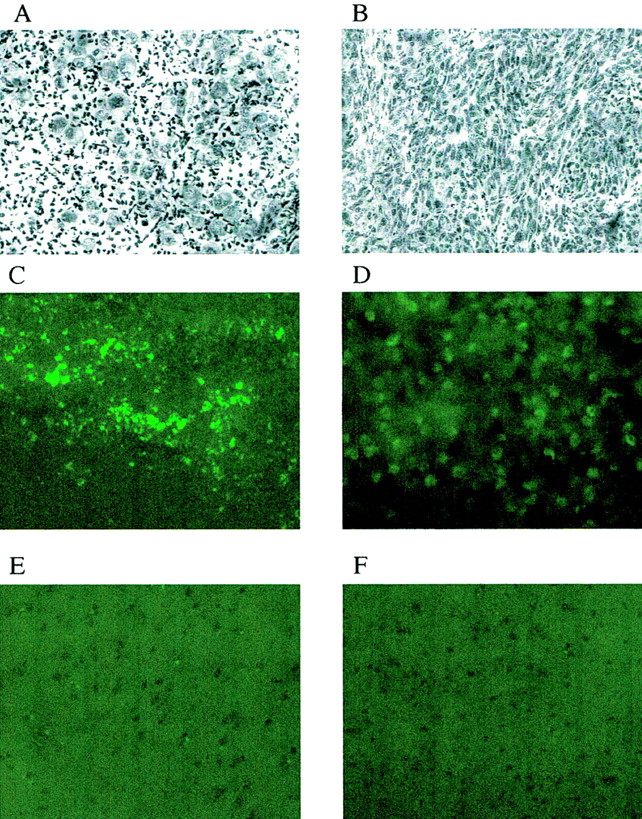
    (A and B) Photomicrographs of RG2TK+ xenografts after 3 d of GCV treatment (A) and normal saline treatment (B). (toluidine blue, ×200) (C–F) TdT-mediated dUTP-X nick-end labeling (TUNEL) staining of RG2TK+ tumor treated with GCV (C) and normal saline (D) and normal brain in treated animal (E) and nontreated animal (F). (×200)

  • FIGURE 3.
    • Download figure
    • Open in new tab
    • Download powerpoint
    FIGURE 3.

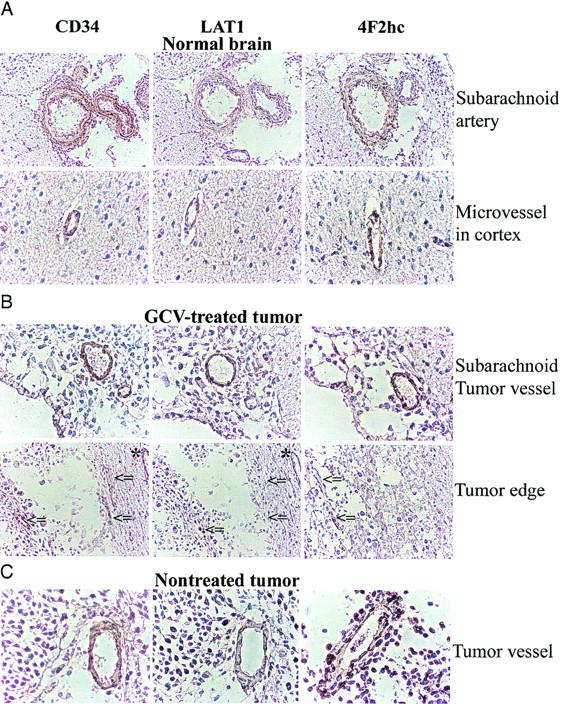
    Microphotographs of immunostaining for CD34, LAT1, and 4F2hc. CD34-positive endothelial cells also express LAT1 and 4F2hc in normal brain (A) and some intratumoral vessels in CGV-treated tumor (B) and in nontreated tumor (C). However, some microvessels in GCV-treated tumor expressing CD34 were stained weakly or marginally by LAT1, whereas CD98 staining intensity was relatively retained (arrows) despite microvessel in normal brain around tumor that remained LAT1 positive (asterisks).

  • FIGURE 4.
    • Download figure
    • Open in new tab
    • Download powerpoint
    FIGURE 4.

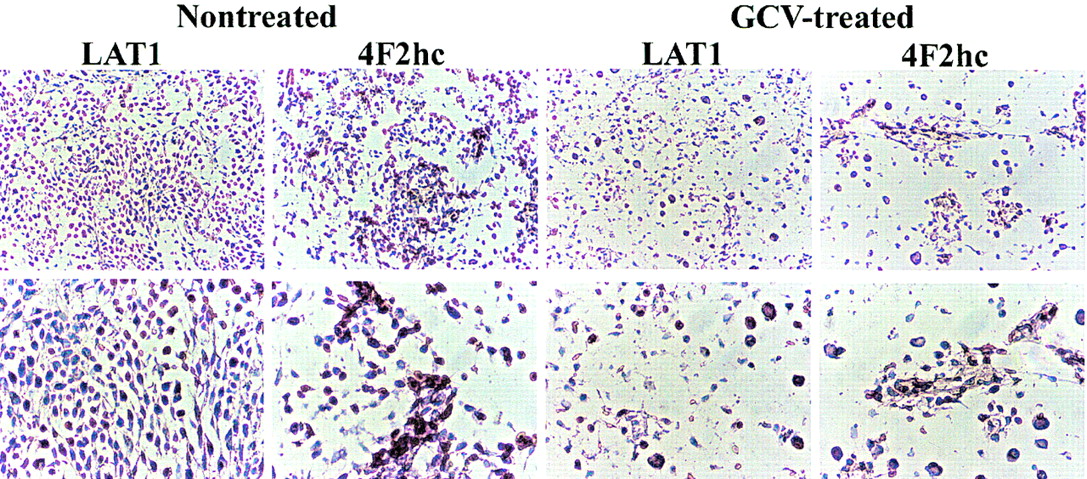
    Microphotographs of immunostaining for LAT1 and 4F2hc in nontreated tumor and in GCV-treated tumor. (Top, ×100; bottom, ×200)
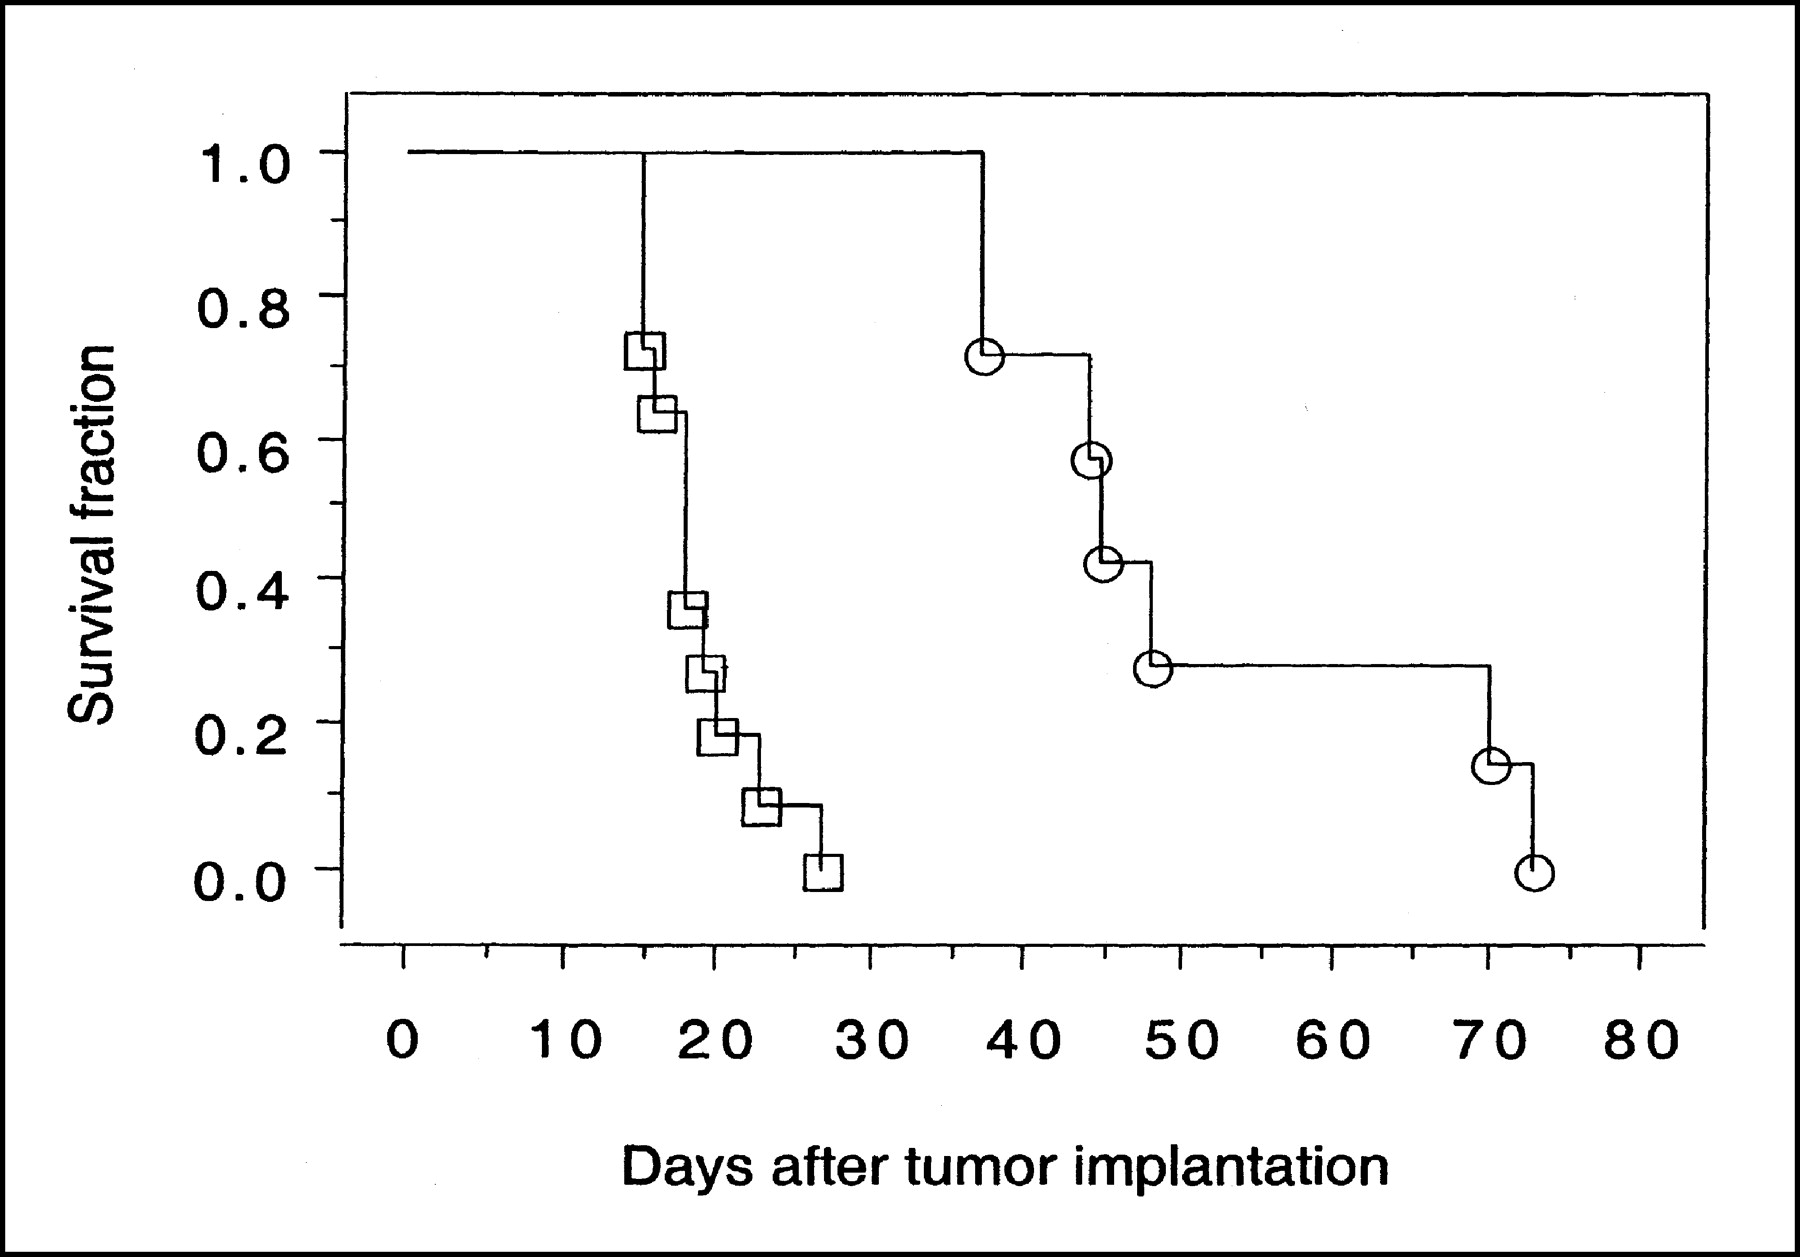
  • FIGURE 5.
    • Download figure
    • Open in new tab
    • Download powerpoint
    FIGURE 5.

    Survival of animals bearing intracerebral RG2TK+ xenografts after 3 d of treatment with GCV (○) or normal saline (□). Three GCV-treated long-term survivors are not included in plot.

Tables

  • Figures
    • View popup
    TABLE 1

    Comparison of Uptake in HSV-tk Transduced Tumor

    TissueUntreated (saline)Treated (GCV)
    14C-ACPC K1 (μL/min/g)14C-ACPC ∂K1 (μL/min/g)67Ga-DTPA K1 (μL/min/g)18F-FDG R (μmol/hg/min)14C-ACPC K1 (μL/min/g)14C-ACPC ∂K1 (μL/min/g)67Ga-DTPA K1 (μL/min/g)18F-FDG R (μmol/hg/min)
    Tumor
     Whole tumor34.5 ± 9.4 (5)*†33.8 ± 8.9 (5)*†0.182 ± 0.099 (5)†25.4 ± 7.3 (5)9.8 ± 2.7 (6)‡9.5 ± 2.7 (6)‡0.115 ± 0.051 (6)12.3 ± 3.8 (5)*†‡
     Viable tumor35.2 ± 9.6 (5)*†34.9 ± 9.7 (5)*†0.168 ± 0.014 (5)*†26.1 ± 7.5 (5)9.7 ± 2.8 (6)‡9.5 ± 2.8 (6)‡0.096 ± 0.019 (6)†‡13.1 ± 3.8 (5)*†‡
     Impending necrosis50.4 ± 18.9 (4)44.5 ± 20.1 (4)0.87 ± 0.19 (4)37.3 ± 10.6 (4)13.7 ± 7.4 (4)11.6 ± 5.1 (4)1.12 ± 1.43 (4)18.1 ± 9.0 (4)
     Necrotic tumor————1.0 ± 1.3 (5)§1.3 ± 1.2 (5)§−0.16 ± 0.61 (5)4.5 ± 1.5 (5)*†‡§
    Contralateral brain
     Frontal cortex18.9 ± 4.2 (5)18.8 ± 4.2 (5)0.081 ± 0.019 (5)42.1 ± 15.1 (5)10.9 ± 3.0 (6)‡10.7 ± 3.0 (6)‡0.092 ± 0.004 (6)30.0 ± 12.4 (5)
     Corpus callosum14.9 ± 4.1 (5)14.8 ± 4.1 (5)0.054 ± 0.011 (5)22.9 ± 7.5 (5)8.2 ± 3.2 (6)‡8.2 ± 3.2 (6)‡0.059 ± 0.018 (6)18.9 ± 7.7 (5)
    • ↵* Statistically significant value compared with corresponding contralateral frontal cortex (P < 0.05, paired t test).

    • ↵† Statistically significant value compared with corresponding contralateral corpus callosum (P < 0.05, paired t test).

    • ↵‡ Statistically significant value compared with untreated rats (P < 0.05).

    • ↵§ Significantly different from whole-tumor and viable tumor values (P < 0.05, paired t test).

    • Initial transport (clearance) constant, K1, was calculated from 10-min 14C-ACPC and 10-min 67Ga-DTPA experiments (Eq. 1); ∂K1 of ACPC was calculated (Eq. 2), and relative glucose utilization (R) was calculated from 60-min 18F-FDG data (Eq. 3; hg = 100 g). Data are shown for untreated (saline) control animals and for animals treated with GCV. Values are the mean ± SD; number of animals is given in parenthesis. One saline-treated animal died during study, and 1 GCV-treated animal did not receive 18F-FDG because radiopharmaceutical was not available.

    • View popup
    TABLE 2

    Plasma Amino Acid Concentrations

    Amino acidAmino acid classUntreated (saline) Average ± SD (pmol/μL)Treated (GCV) Average ± SD (pmol/μL)
    GlyA411 ± 216308 ± 243
    AlaA650 ± 388412 ± 277
    SerA+318 ± 167267 ± 198
     Total A1,380 ± 745987 ± 713
    ValA-L273 ± 146255 ± 173
    MetA-L77 ± 3144 ± 24
    ProA-L248 ± 137180 ± 116
     Total A-L579 ± 279464 ± 305
    PheL118 ± 54104 ± 77
    IleL122 ± 54131 ± 100
    LeuL288 ± 162314 ± 221
    TyrL95 ± 4576 ± 47
    ThrL+211 ± 121130 ± 72
     Total L834 ± 340755 ± 492
    LysB423 ± 262328 ± 232
    ArgB360 ± 207343 ± 238
    HisB79 ± 4074 ± 28
     Total B861 ± 446720 ± 468
    AspAc105 ± 87105 ± 78
    GluAc361 ± 229341 ± 273
     Total Ac466 ± 271447 ± 340
    Total amino acids (mean ± SD)4,131 ± 1,9433,373 ± 2,302
    • Values are means ± SD for individual animals.

    • View popup
    TABLE 3

    Comparison of 14C-ACPC, 18F-FDG, and 67Ga-DTPA Uptake in Morphologically Distinct Intratumoral Regions

    TissueUntreated (saline)Treated (GCV)
    14C-ACPC67Ga-DTPA18F-FDG14C-ACPC67Ga-DTPA18F-FDG
    Viable tumor
     High cell density1.28 ± 0.32 (5)1.28 ± 0.19 (5)*1.23 ± 0.17 (5)*1.04 ± 0.13 (6)1.01 ± 0.26 (6)1.20 ± 0.13 (5)*
     Low cell density0.89 ± 0.12 (5)0.99 ± 0.24 (5)0.96 ± 0.07 (5)0.98 ± 0.07 (6)0.87 ± 0.14 (6)*0.86 ± 0.10 (5)
     Impending necrosis1.43 ± 0.22 (4)*1.71 ± 0.81 (4)1.44 ± 0.07 (4)*1.97 ± 0.28 (4)2.22 ± 0.99 (4)1.35 ± 0.35 (4)
    Necrotic tumor
     Necrosis———0.29 ± 0.27 (5)†0.62 ± 0.45 (5)†0.38 ± 0.10 (4)†
    • ↵* Statistically significant values, paired t test (P < 0.05).

    • ↵† Statistically significant values, paired t test (P < 0.01).

    • Tumor region-to-mean tumor ratio was calculated; values are mean ± SD; number of animals is given in parenthesis.

    • View popup
    TABLE 4

    Tissue Uptake (% dose/g) of 14C-ACPC, 18F-FDG, and 67Ga-DTPA Uptake in RG2-tk Gliomas

    TissueUntreated (saline)Treated (GCV)
    14C-ACPC67Ga-DTPA18F-FDG14C-ACPC67Ga-DTPA18F-FDG
    Tumor0.28 ± 0.09 (5)*0.054 ± 0.013 (5)†0.70 ± 0.21 (5)†0.11 ± 0.04 (6)‡0.057 ± 0.028 (6)0.63 ± 0.15 (5)†
    Frontal cortex0.16 ± 0.04 (5)0.024 ± 0.006 (5)1.12 ± 0.27 (5)0.12 ± 0.05 (6)0.036 ± 0.011 (6)1.51 ± 0.54 (5)
    Final plasma0.43 ± 0.18 (5)2.3 ± 0.9 (5)0.40 ± 0.09 (5)0.65 ± 0.26 (6)3.7 ± 1.5 (6)0.38 ± 0.09 (6)
    • ↵* Statistically significant values compared with frontal cortex, paired t test (P < 0.01).

    • ↵† Statistically significant values compared with frontal cortex, paired t test (P < 0.05).

    • ↵‡ Statistically significant value compared with untreated rats, unpaired t test (P < 0.01).

    • % injected dose/g tissue weight; values are mean ± SD; number of animals is given in parenthesis.

PreviousNext
Back to top

In this issue

Journal of Nuclear Medicine
Vol. 44, Issue 11
November 1, 2003
  • Table of Contents
  • Index by author
Print
Download PDF
Article Alerts
Sign In to Email Alerts with your Email Address
Email Article

Thank you for your interest in spreading the word on Journal of Nuclear Medicine.

NOTE: We only request your email address so that the person you are recommending the page to knows that you wanted them to see it, and that it is not junk mail. We do not capture any email address.

Enter multiple addresses on separate lines or separate them with commas.
Assessment of Treatment Response by Autoradiography with 14C-Aminocyclopentane Carboxylic Acid, 67Ga-DTPA, and 18F-FDG in a Herpes Simplex Virus Thymidine Kinase/Ganciclovir Brain Tumor Model
(Your Name) has sent you a message from Journal of Nuclear Medicine
(Your Name) thought you would like to see the Journal of Nuclear Medicine web site.
Citation Tools
Assessment of Treatment Response by Autoradiography with 14C-Aminocyclopentane Carboxylic Acid, 67Ga-DTPA, and 18F-FDG in a Herpes Simplex Virus Thymidine Kinase/Ganciclovir Brain Tumor Model
Tadashi Miyagawa, Takamitsu Oku, Toshio Sasajima, Rovathi Dasai, Bradley Beattie, Ronald Finn, Juri Gelovani Tjuvajev, Ronald Blasberg
Journal of Nuclear Medicine Nov 2003, 44 (11) 1845-1854;

Citation Manager Formats

  • BibTeX
  • Bookends
  • EasyBib
  • EndNote (tagged)
  • EndNote 8 (xml)
  • Medlars
  • Mendeley
  • Papers
  • RefWorks Tagged
  • Ref Manager
  • RIS
  • Zotero
Share
Assessment of Treatment Response by Autoradiography with 14C-Aminocyclopentane Carboxylic Acid, 67Ga-DTPA, and 18F-FDG in a Herpes Simplex Virus Thymidine Kinase/Ganciclovir Brain Tumor Model
Tadashi Miyagawa, Takamitsu Oku, Toshio Sasajima, Rovathi Dasai, Bradley Beattie, Ronald Finn, Juri Gelovani Tjuvajev, Ronald Blasberg
Journal of Nuclear Medicine Nov 2003, 44 (11) 1845-1854;
Twitter logo Facebook logo LinkedIn logo Mendeley logo
  • Tweet Widget
  • Facebook Like
  • Google Plus One
Bookmark this article

Jump to section

  • Article
    • Abstract
    • MATERIALS AND METHODS
    • RESULTS
    • DISCUSSION
    • CONCLUSION
    • Acknowledgments
    • Footnotes
    • REFERENCES
  • Figures & Data
  • Info & Metrics
  • PDF

Related Articles

  • No related articles found.
  • PubMed
  • Google Scholar

Cited By...

  • Heterogeneous Blood-Tumor Barrier Permeability Determines Drug Efficacy in Experimental Brain Metastases of Breast Cancer
  • Selective Killing of Tumor Neovasculature Paradoxically Improves Chemotherapy Delivery to Tumors
  • Molecular Imaging with 123I-FIAU, 18F-FUdR, 18F-FET, and 18F-FDG for Monitoring Herpes Simplex Virus Type 1 Thymidine Kinase and Ganciclovir Prodrug Activation Gene Therapy of Cancer
  • Google Scholar

More in this TOC Section

  • Tumor-Specific Binding of Radiolabeled PEGylated GIRLRG Peptide: A Novel Agent for Targeting Cancers
  • PET/MRI of Hypoxic Atherosclerosis Using 64Cu-ATSM in a Rabbit Model
  • Tumor Uptake of Anti-CD20 Fabs Depends on Tumor Perfusion
Show more Basic Science Investigations

Similar Articles

SNMMI

© 2025 SNMMI

Powered by HighWire