


Abstract
Assessments of herpes simplex virus 1 thymidine kinase (HSV-tk)/ganciclovir (GCV) treatment response, early in the course of therapy, are important in the evaluation and clinical management of patients. This study addresses whether imaging amino acid transport, glucose utilization, and passive vascular permeability provides an early indication of treatment response and can predict long-term outcome. Methods: Fischer 344 rats with intracerebral HSV-tk transduced RG2TK+ xenografts were studied. GCV-treated (50 mg/kg twice daily) and saline-treated control animals were compared; triple-label quantitative autoradiography was performed 3 d after initiating treatment, and long-term survival was determined. Autoradiograms of 18F-FDG, 67Ga-diethylenetriaminepentaacetic acid (67Ga-DTPA), and 14C-aminocyclopentane carboxylic acid (14C-ACPC) were obtained; measurements of 14C-ACPC and 67Ga-DTPA plasma clearance (K1), 14C-ACPC transport (∂K1), relative glucose utililization (R), and normalized radioactivity (% dose/g) were obtained in tumor and brain tissues. Adjacent sections were stained to detect apoptotic cells, microvessels, and type L neutral amino acid transporter in tumor and normal brain. Results: GCV treatment reduced ∂K1 and % dose/g of 14C-ACPC in RG2TK+ xenografts to ∼30% of that in nontreated animals (from 34 ± 9 [mean ± SD] to 9.5 ± 2.7 μL/min/g and from 0.28 ± 0.09 to 0.11 ± 0.04 % dose/g, respectively). GCV had a significant but substantially smaller effect than toxicity on glucose utilization and little or no effect on passive vascular permeability of RG2TK+ xenografts. These differences could not be explained by differences in plasma amino acid or glucose concentration at the time of the study. Histology revealed a large fraction of dead tumor cells and only a sparse distribution of apoptotic cells in GCV-treated tumors. Many CD34-positive endothelial cells in GCV-treated tumors showed only weak or marginal LAT1 staining, whereas CD98 staining remained unchanged. Survival was significantly increased by GCV treatment from 18 ± 4 to 56 ± 17 d. Conclusion: 14C-ACPC influx, K1ACPC, facilitated transport, ∂K1ACPC, and % dose/g ACPC are good indicators of early treatment response after HSV-tk/GCV gene therapy. The parametric images and changes in K1ACPC, ∂K1ACPC, and % dose/g ACPC are substantial and are better than the corresponding measures obtained in the same animals and in the same tissue (tumor) regions with 67Ga-DTPA and 18F-FDG. Amino acid transport imaging may be a good surrogate paradigm to monitor treatment response of brain tumors.
The transfer of genes into target cell populations is being developed to treat a variety of human diseases, including disorders of the central nervous system. Retroviral and adenoviral vectors are being used to transduce therapeutic genes directly into tumor cells in experimental animal studies (1,2) as well as in clinical gene therapy studies in patients with brain tumors (3,4). The transfer of the herpes simplex virus 1 thymidine kinase (HSV-tk) gene into experimental rat brain tumors with subsequent ganciclovir (GCV) treatment has been shown to cause tumor regression (1). The HSV-tk gene product, viral thymidine kinase, is known to convert GCV to phosphorylated nucleoside analogs, which are cytotoxic and lead to inhibition of DNA synthesis and to tumor cell death, mediated in part through apoptotic pathways (5). However, similar studies in patients have not yielded corresponding treatment responses, and this may reflect the low efficiency and level of transduction that was achieved with retroviral vectors (5,6).
One of the issues to be considered with respect to the HSV-tk/GCV gene therapy is that there are appropriate in vivo monitoring systems (imaging) of HSV TK protein in tumor cells and markers to assess the treatment response; in addition, surrogate imaging using established clinical imaging paradigms can address this problem (7).
We previously demonstrated that the delivery and expression of the HSV1-tk transgene can be imaged using radiolabeled 5-iodo-2′-fluoro-2′deoxy-1-β-d-arabinofuranosyluracil (FIAU) and γ-scintigraphy (8), PET (9), or quantitative autoradiography (QAR) (10). We and others have shown that the level of HSV1-tk expression corresponds to the level of accumulated radioactivity (8,9,11). We have also observed that the level of HSV1-tk expression depends on cell and tissue viability (8,9), and early treatment response is likely to be reflected by changes in glucose metabolism and vascular transport parameters that can be imaged with current clinical imaging modalities.
Amino acid transport systems play an important role in supplying nutrition to cells. Most cells express transport systems known as A, ASC, and L. Type L amino acid transporter 1 (LAT1), which was cloned by Kanai et al. (12), is a Na+-independent amino acid transporter and belongs to the amino acid transport system L. For the functional expression, LAT1 requires the heavy chain of the cell surface antigen 4F2 (CD98) (12,13). 4F2 has been originally identified as an activation antigen of lymphocytes and is a heterodimer consisting of a type II membrane glycosylated protein of around 80 kDa (heavy chain; 4F2hc) and a nonglycosylated protein of around 40 kDa (light chain; LAT1(4F2lc)) linked by a disulfide bond. Miyagawa et al. (14) have demonstrated that imaging with aminocyclopentane carboxylic acid (ACPC), which is mainly transported by type L transporter, had a large advantage in detecting malignant gliomas because facilitated transport of 14C-ACPC is upregulated across C6 and RG2 glioma capillaries.
This article addresses the issue of whether noninvasive, surrogate imaging in an animal model can predict treatment response early in the course of treatment, before changes in tumor volume (15). Prior studies of HSV-tk/GCV gene therapy have shown effects on nucleoside uptake (16); 18F-FDG transport, phosphorylation, and GLUT1 expression (17,18); and GCV toxicity (19). To address whether established clinical imaging paradigms can be used as surrogate endpoints (20), we performed triple-label QAR to directly compare the effects of GCV treatment on intracerebral HSV-tk transduced RG2TK+ xenografts in Fischer 344 rats. Three functional measures and the corresponding parametric images were compared: (a) glucose utilization, (b) amino acid transport, and (c) passive vascular permeability. The results indicate that imaging amino acid transport before and after GCV treatment is the most sensitive parameter to assess early treatment response.
MATERIALS AND METHODS
Cell Culture
The RG2TK+ glioma cell line was developed in our laboratory (10); it is derived from an RG2 cell line provided by Daryl Bigner (Duke University) and was transduced with the recombinant STK retrovirus containing the HSV1-tk gene as previously described (8). The RG2TK+ cell line has been maintained under G418 and has remained stable with respect to GCV sensitivity and FIAU accumulation in vitro.
Tumor Inoculation
The experimental protocol was approved by the Institutional Animal Care and Use Committee. Thirty-three male Fischer 344 rats, weighing 250–300 g, were studied. The rats were anesthetized with a gas mixture consisting of 5% of isoflurane, 70% nitrous oxide, and 30% oxygen, and they were maintained with 1.5% isoflurane. After a midline scalp incision was made, a 25-gauge needle attached to a Hamilton syringe was stereotactically inserted and 5.0 × 10⁵ tumor cells in 10 μL medium were injected into the right caudate nucleus over 5 min. After the procedure, the animals were placed in standard cages and fed ad libitum.
Isotope Preparation
18F-FDG was synthesized by the cyclotron/chemistry core of the Memorial Sloan-Kettering Cancer Center by nucleophilic reaction of 18F anion with 1,3,4,6-tetra-O-acetyl-2′-O-trifluoromethane sullenly-δ-d-monopyronose (21). 67Ga-DTPA solution was prepared, mixing 67Ga-citrate (1,554 GBq/mmol [42 Ci/mmol]) solution purchased commercially (Mallinckrodt Medical, Inc.) with one-tenth volume of a 10−2 mol/L unlabeled DTPA and 3.0 × 10⁻³ mol/L CaCl2 saline solution and adjusted to pH 7.4. 14C-ACPC (1-[carboxyl-14C-; 2,035 MBq/mmol [55 mCi/mmol]) was purchased commercially (American Radiolabeled Chemicals, Inc.). 67Ga-DTPA and 14C-ACPC were assayed by high-pressure liquid chromatography before use and confirmed radiochemical purity was >98%.
Study Groups
Twenty-four rats with tumors were studied, 4 rats per set × 6 repeat studies. Two animals in each set were treated with GCV (50 mg/kg twice daily, as an intraperitoneal injection of a 1-mL saline solution) for 3 d (GCV-treated group). The other 2 animals received intraperitoneal saline injections (untreated control group). Twelve or 13 d after tumor inoculation (and 3 d after initiating GCV treatment), 1 treated and 1 untreated animal were prepared for QAR imaging studies (these animals were fasting for 12 h but had water ad libitum). Two animals (1 treated, 1 untreated) in each set were used in survival studies. In addition to these 12 animals, another set of 9 animals was included in the survival studies.
Surgical and Experimental Procedures
Femoral artery and vein catheters were placed under gas anesthesia. Arterial blood pressure was monitored, and body temperature was maintained at 37°C with a heat lamp. The rats were allowed to recover from anesthesia for at least 2 h before study. Continuous withdrawal of arterial blood at 0.025 mL/min (Harvard Apparatus) was initiated just before intravenous injection of a 1.0-mL saline solution containing 185 MBq (5.0 mCi) 18F-FDG. At 50 min, a 1.0-mL saline solution containing 111 MBq (3 mCi) 67Ga-DTPA and 925 kBq (25 μCi) 14C-ACPC was injected intravenously. At 60 min, arterial blood was sampled, the animal was euthanized, and the brain was rapidly extracted and frozen in liquid Freon (DuPont). The 60-min blood sample and a measured fraction of the total blood withdrawn during the experiment were processed for measurements of whole blood and plasma radioactivity and hematocrit. The blood and plasma concentration-time integral (input function) was calculated as previously described (22,23).
Radioactivity Assay
All tissue, blood, and plasma samples were solubilized (Soluene-350; Packard Instrument Co., Inc.) and assayed for radioactivity. Initially, 18F and 67Ga radioactivity was measured in a 3-channel γ-counter (AutoGamma 5550 Spectrometer; Packard Instrument Co., Inc.) using narrow window settings, splash correction, and decay correction. After 18F decay, the samples were recounted to determine 67Ga radioactivity alone. The samples were then stored at 4°C for 45 d to allow for 67Ga decay. 14C radioactivity was determined by liquid scintillation counting (Tri-Carb Liquid Scintillation Analyzer, model 1600TR; Packard Instrument Co., Inc.) using external standard quench corrections.
Triple-Label QAR
The tissue processing and autoradiographic techniques were described previously (24–26). Briefly, serial coronal sections were cut at 20-μm thickness in a cryomicrotome at −13°C. The sections were used for autoradiography and histology. 18F and 67Ga autoradiographic standards were prepared from liver homogenates with a known amount of 18F and 67Ga, respectively. The radioactivity of each standard was measured. Sixteen 14C-methylmethacrylate standards (Amersham Corp.), previously calibrated to brain tissue radioactivity over the range of 162.8 Bq/g to 87.1 kBq/g brain (4.4–2,354 nCi/g brain), were also used. The tissue sections and autoradiographic standards were exposed to x-ray film (SB-5; Kodak) over 3 different intervals to generate 3 separate images representing the tissue distribution of 18F, 67Ga, and 14C radioactivity, respectively. The principles and validation of the method for generating the triple-label autoradiograms have been described (24).
Autoradiographic Image Analysis
Digitization and registration of corresponding images from the 3 autoradiograms and histology were performed using a microcomputer imaging system and MCID software (Imaging Research Inc.). The same tissue section was used to generate each of the 3 corresponding autoradiographic images as well as the histologic image, and all 4 images were registered to each other. Parametric images of the lower-limit plasma clearance (influx) constant (K1) and relative glucose utilization (R) were color coded to a range of values that were also generated using MCID software.
Calculations
K1 (μL/min/g) of 14C-ACPC and 67Ga-DTPA was calculated from:
 Eq. 1 where AT is the total radioactivity (% administered dose/g tissue), Vb is the tissue blood volume (26), and CbT is the arterial blood concentration (% administered dose/mL of blood). ∫Cp(t)dt is the plasma concentration-time integral (input function). ∫Cp(t)dt was calculated from the measurement of total radioactivity withdrawn during the experiment and knowledge of the rate of withdrawal and time of exposure (23). The basis for determining K1 from 0- to 10-min experiments has been established (26,27) and represents an “upper-limit” value.
To identify the “facilitated” component of 14C-ACPC transport across endothelial cells, ∂K1ACPC, the measured value of K1ACPC, was corrected for “passive” diffusion through tumor endothelial cell “pores” (as measured with 67Ga-DTPA) and for passive diffusion of 14C-ACPC across the lipid bilayer “membranes” of the endothelial cells using the following relationship:
 Eq. 2 where pore diffusion = K1Ga-DTPA × (DACPC/DGa-DTPA) and (DACPC/DGa-DTPA) is the ratio of aqueous diffusion constants for ACPC and Ga-DTPA at 37°C, and where membrane diffusion = antilog (4.5 + log[PCACPC × DACPC]) and PCACPC is the octanol/water partition coefficient of ACPC. Thus, ∂K1ACPC is an approximation of the facilitated component of 14C-ACPC transport across brain and tumor capillaries. The derivation and experimental support for Equation 2 have been described previously (14).
R of brain and tumor (25) was calculated because the “lumped constant” for tumor tissue in the operational equation of the deoxyglucose method (22) is not known:
 Eq. 3 where Cp* is plasma FDG and Cp† is the plasma glucose concentration.
Immunohistochemistry
Immunohistochemical staining was performed on cryosections adjacent to those used for autoradiography to access the spatial distribution of apoptosis, microvessels, and type L neutral amino acid transporter. The Fluorescein-FragEL kit (Oncogene) was used to detect apoptotic cells. To stain for microvessels (CD34) and the type L neutral amino acid transporter (LAT1-4F2hc/CD98 dimer), the sections were incubated for 1 h at room temperature with a primary antibody for CD34 (1:50, QBEnd/10; Novocastra Laboratories Ltd.), anti-LAT1 (10 μg/mL; Serotec Ltd.), or anti-CD98 (1:100; Santa Cruz Biotechnology, Inc.). Biotinylated secondary antibody (Zymed Laboratories Inc.) was applied and immunostaining was completed using a Vectastain Elite ABC kit and a peroxidase substrate kit (DAB) (Vector Co.).
Survival Studies
To assess the long-term effects and survival of a 3-d course of GCV treatment on RG2TK+ brain tumor growth in the remaining 2 animals of each set, long-term survival observations were performed over 50 d. These 12 animals were supplemented with an additional 9 animals to generate survival profiles (11 untreated, 10 treated). The survival distribution was determined from the survival curves.
Statistics
Comparisons between region-of-interest mean values were analyzed by 2 statistical methods. A paired t test was used for comparisons within individual animals (e.g., between tumor and normal brain), and a nonpaired t test was applied for comparisons between different sets of animals. Significant differences were determined at P < 0.05.
RESULTS
Imaging studies were performed in animals bearing intracerebral RG2TK+ tumors after 3 d of GCV treatment (50 mg/kg, intraperitoneally twice daily; GCV-treated group) and in similar RG2TK+ tumor-bearing animals receiving intraperitoneal saline (control, untreated group). Typical histologic and multiisotope parametric QAR images of 18F-FDG metabolism and influx of 14C-ACPC and 67Ga-DTPA profiles are shown in Figure 1. Untreated RG2TK+ tumors were characterized by dense cellularity, nuclear pleomorphism, and mitoses (Fig. 2B). The tumors were generally well circumscribed and caused compression of adjacent brain tissue, and there was focal perivascular infiltration of tumor cells into adjacent brain tissue. After 3 d of GCV treatment, the macroscopic appearance of the tumors was different; the tumors were smaller and had both large and small areas of necrosis visible on the frozen sections. Microscopically, large areas of necrosis in each of the GCV-treated tumors was confirmed, and there was a marked decrease in cell density in the more viable-appearing regions of the tumor. The presence of dark-staining nuclear debris suggested considerable tumor cell death in these tumor regions (Fig. 2A).
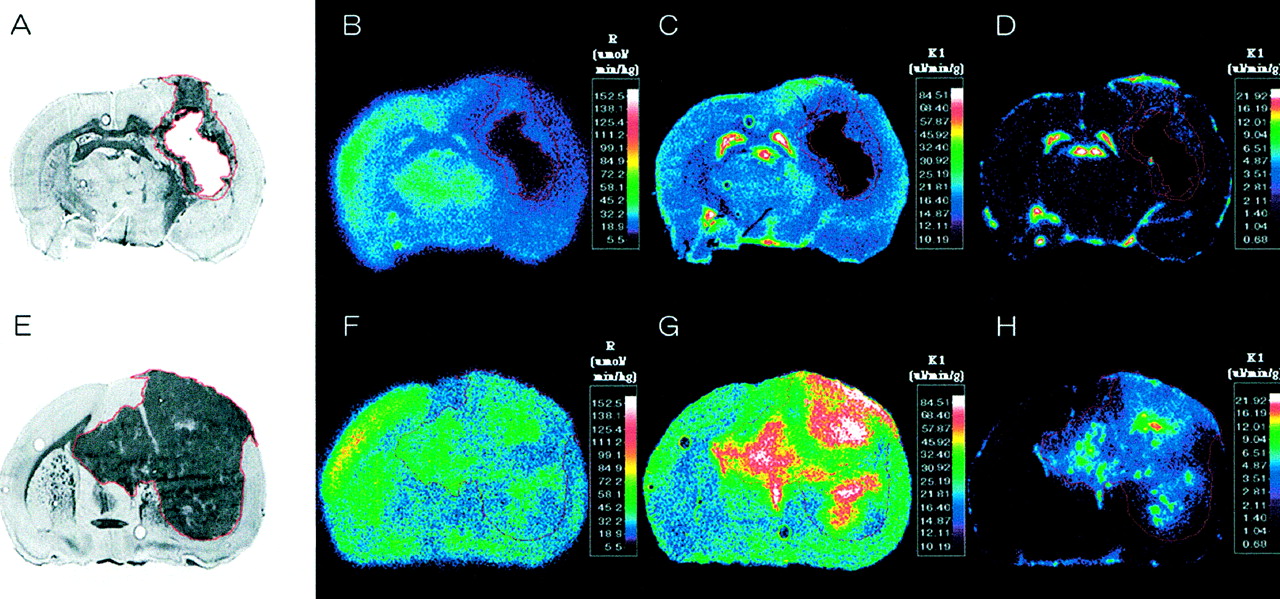
Corresponding images from 2 intracerebral RG2TK+ xenografts: one treated with gancyclovir (A–D) and the other treated with normal saline (control; E–H). From left to right are toluidine blue-stained histology (A and E) and parametric images of R measured with 18F-FDG (B and F), K1 of 14C-ACPC (C and G), and K1 of 67Ga-DTPA (D and H). Histology and parametric images for each animal were obtained from same tissue section. Parametric images are color coded to a range of values. Tumor outline (in red) was drawn on histologic image and electronically transferred to previously registered autoradiographic images.

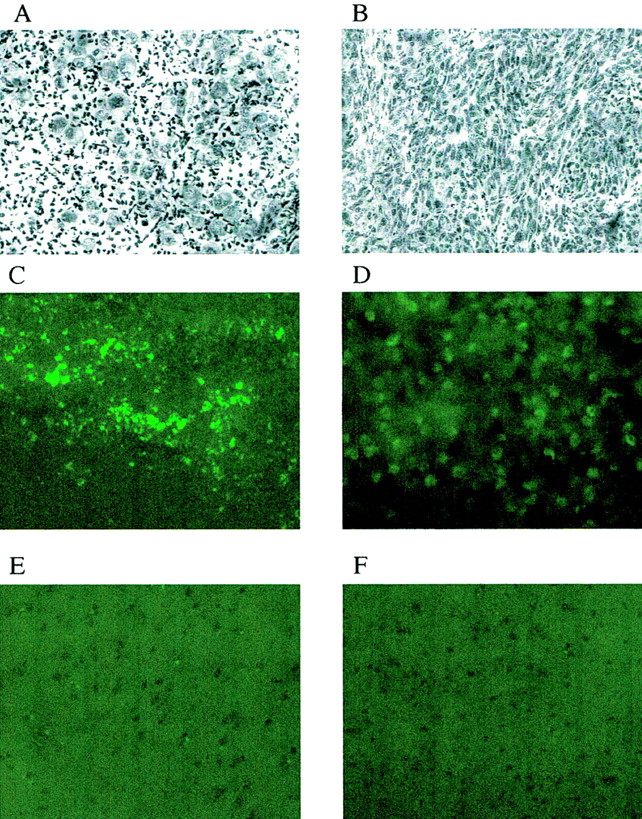
(A and B) Photomicrographs of RG2TK+ xenografts after 3 d of GCV treatment (A) and normal saline treatment (B). (toluidine blue, ×200) (C–F) TdT-mediated dUTP-X nick-end labeling (TUNEL) staining of RG2TK+ tumor treated with GCV (C) and normal saline (D) and normal brain in treated animal (E) and nontreated animal (F). (×200)
Parametric Imaging
Passive vascular permeability (K1) of the intracerebral RG2TK+ tumors, as measured with 67Ga-DTPA, was generally very low and not measurably different from that of the contralateral cortex in both the GCV-treated and the untreated groups of animals (Table 1). However, heterogeneous regions of increased vascular permeability were noted in some of the larger tumors (Fig. 1H). 14C-ACPC influx (K1) across normal brain and RG2TK+ tumor capillaries was substantially greater (>200-fold) than that of 67Ga-DTPA (Fig. 1; Table 1). This difference was largely due to facilitated 14C-ACPC transport across brain and tumor capillaries (∂K1ACPC; Eq. 2). Three days of GCV treatment significantly reduced 14C-ACPC facilitated transport across RG2TK+ capillaries compared with that in untreated animals (P = 0.0001). ∂K1ACPC values in GCV-treated RG2TK+ tumors were only 28% of that in untreated animals; however, ∂K1ACPC values for the contralateral brain of GCV-treated animals also decreased somewhat and this decrease was significant (P < 0.01). Necrotic-appearing regions of the GCV-treated tumors had very low K1 values for 67Ga-DTPA and 14C-ACPC (including ∂K1ACPC) that were not significantly different from zero. There was little or no necrosis in untreated RG2TK+ tumors.
Comparison of Uptake in HSV-tk Transduced Tumor
Plasma amino acid levels were measured at the time of the imaging studies in both GCV-treated and untreated control animals (Table 2). Amino acid levels were slightly lower in the GCV-treated animals compared with those of untreated control animals, but these differences were not significant. The variability in plasma amino acid levels was greater in the GCV-treated group.
Plasma Amino Acid Concentrations
18F-FDG accumulation in RG2TK+ tumors, reflecting R, was slightly above the level of the contralateral corpus callosum and significantly lower than that in the frontal cortex of untreated control animals (P < 0.01; Table 1). GCV treatment significantly reduced the mean value of R in tumor (P < 0.01), but the decrease in R for the contralateral cortex or corpus callosum was not significant. Blood glucose levels were not significantly different between GCV-treated (141 ± 25 mg/100 mL plasma) and untreated control (155 ± 13 mg/100 mL plasma) animals. Necrotic-appearing regions of the GCV-treated tumors had very low R values, but these values were above zero.
Morphologic Correlates
Areas of relatively high and low cell density were morphologically identified on the histologic section, and the corresponding measurements obtained from the coregistered autoradiograms are shown in Table 3. K1 for 14C-ACPC was slightly higher in high cell density regions and slightly lower in low cell density regions of untreated RG2TK+ tumors, but these differences were not significant. A similar pattern and trend for passive vascular permeability (K1 for 67Ga-DTPA) and for 18F-FDG accumulation (R) in high and low cell density regions of untreated RG2TK+ was seen, whereas tumor cell density had little or no influence on K1 or R in GCV-treated animals.
Comparison of 14C-ACPC, 18F-FDG, and 67Ga-DTPA Uptake in Morphologically Distinct Intratumoral Regions
We also assessed pale-staining tumor areas suggestive of ischemia and “impending” tissue apoptosis or necrosis (20). These morphologically identified regions in the tumor were compared with the mean value for viable-appearing RG2TK+ tumor tissue (Tables 1 and 3). 18F-FDG and 14C-ACPC accumulation (R and ∂K1ACPC) were significantly higher (P < 0.05) in pale-staining areas of RG2-TK+ tumors of untreated animals but not in GCV-treated RG2TK+ tumors. However, highly significant differences (P < 0.001) in K1 for 14C-ACPC and 67Ga-DTPA and in 18F-FDG accumulation were observed between areas of impending apoptosis or necrosis (pale-staining areas) and frankly necrotic tumor regions of GCV-treated tumors. Microscopic (×200) visualization of TdT-mediated dUTP-X nick-end labeling (TUNEL)-stained sections showed a clear difference between GCV-treated and untreated tumors. GCV-treated tumors showed substantially greater TUNEL staining compared with that of untreated tumors (Fig. 2C and 2D), and this comparison suggested that moderate-to-high apoptotic areas showed lower levels of 18F-FDG and 14C-ACPC accumulation.
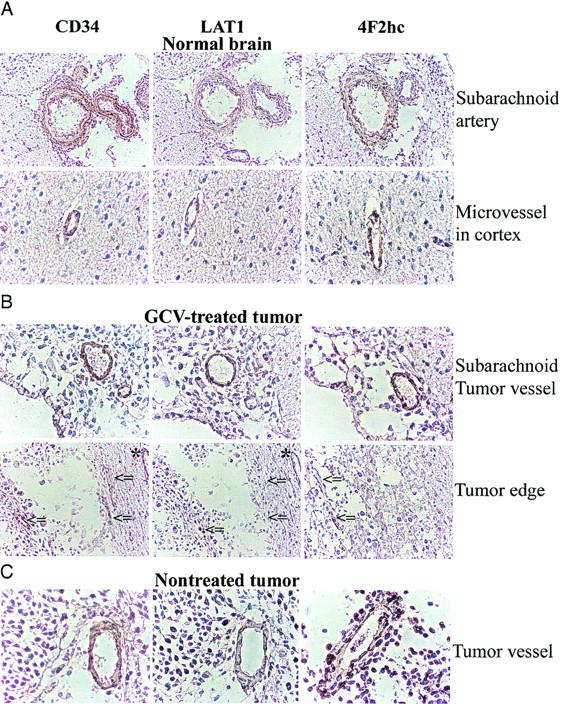
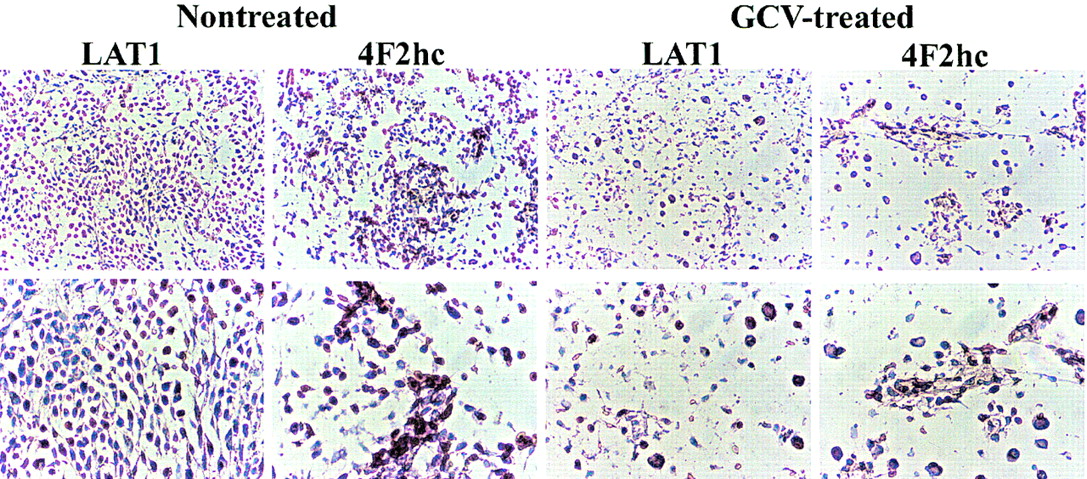
Immunostaining with an antibody against CD34 identified endothelial cells in normal brain and intratumoral microvessels. CD34-positive endothelial cells showed positive staining for LAT1 and 4F2hc in subarachnoid and normal brain vessels (Fig. 3A) as well as in the vessels of untreated tumors (Fig. 3C). In the GCV-treated tumors, LAT1 staining of intratumoral microvessels was weak or marginal when compared with microvessels in brain adjacent to the tumors (Fig. 3B, indicated by asterisks and arrows), whereas 4F2hc staining was relatively preserved. As shown in Figure 4, a large number of cells in the untreated tumor expressed LAT1 or 4F2hc. In contrast, there was only a sparse distribution of tumor cells in the GCV-treated tumors, and only a few cells were observed to be expressing LAT1 or 4F2hc (Fig. 4).

Microphotographs of immunostaining for CD34, LAT1, and 4F2hc. CD34-positive endothelial cells also express LAT1 and 4F2hc in normal brain (A) and some intratumoral vessels in CGV-treated tumor (B) and in nontreated tumor (C). However, some microvessels in GCV-treated tumor expressing CD34 were stained weakly or marginally by LAT1, whereas CD98 staining intensity was relatively retained (arrows) despite microvessel in normal brain around tumor that remained LAT1 positive (asterisks).

Microphotographs of immunostaining for LAT1 and 4F2hc in nontreated tumor and in GCV-treated tumor. (Top, ×100; bottom, ×200)
Treatment Response
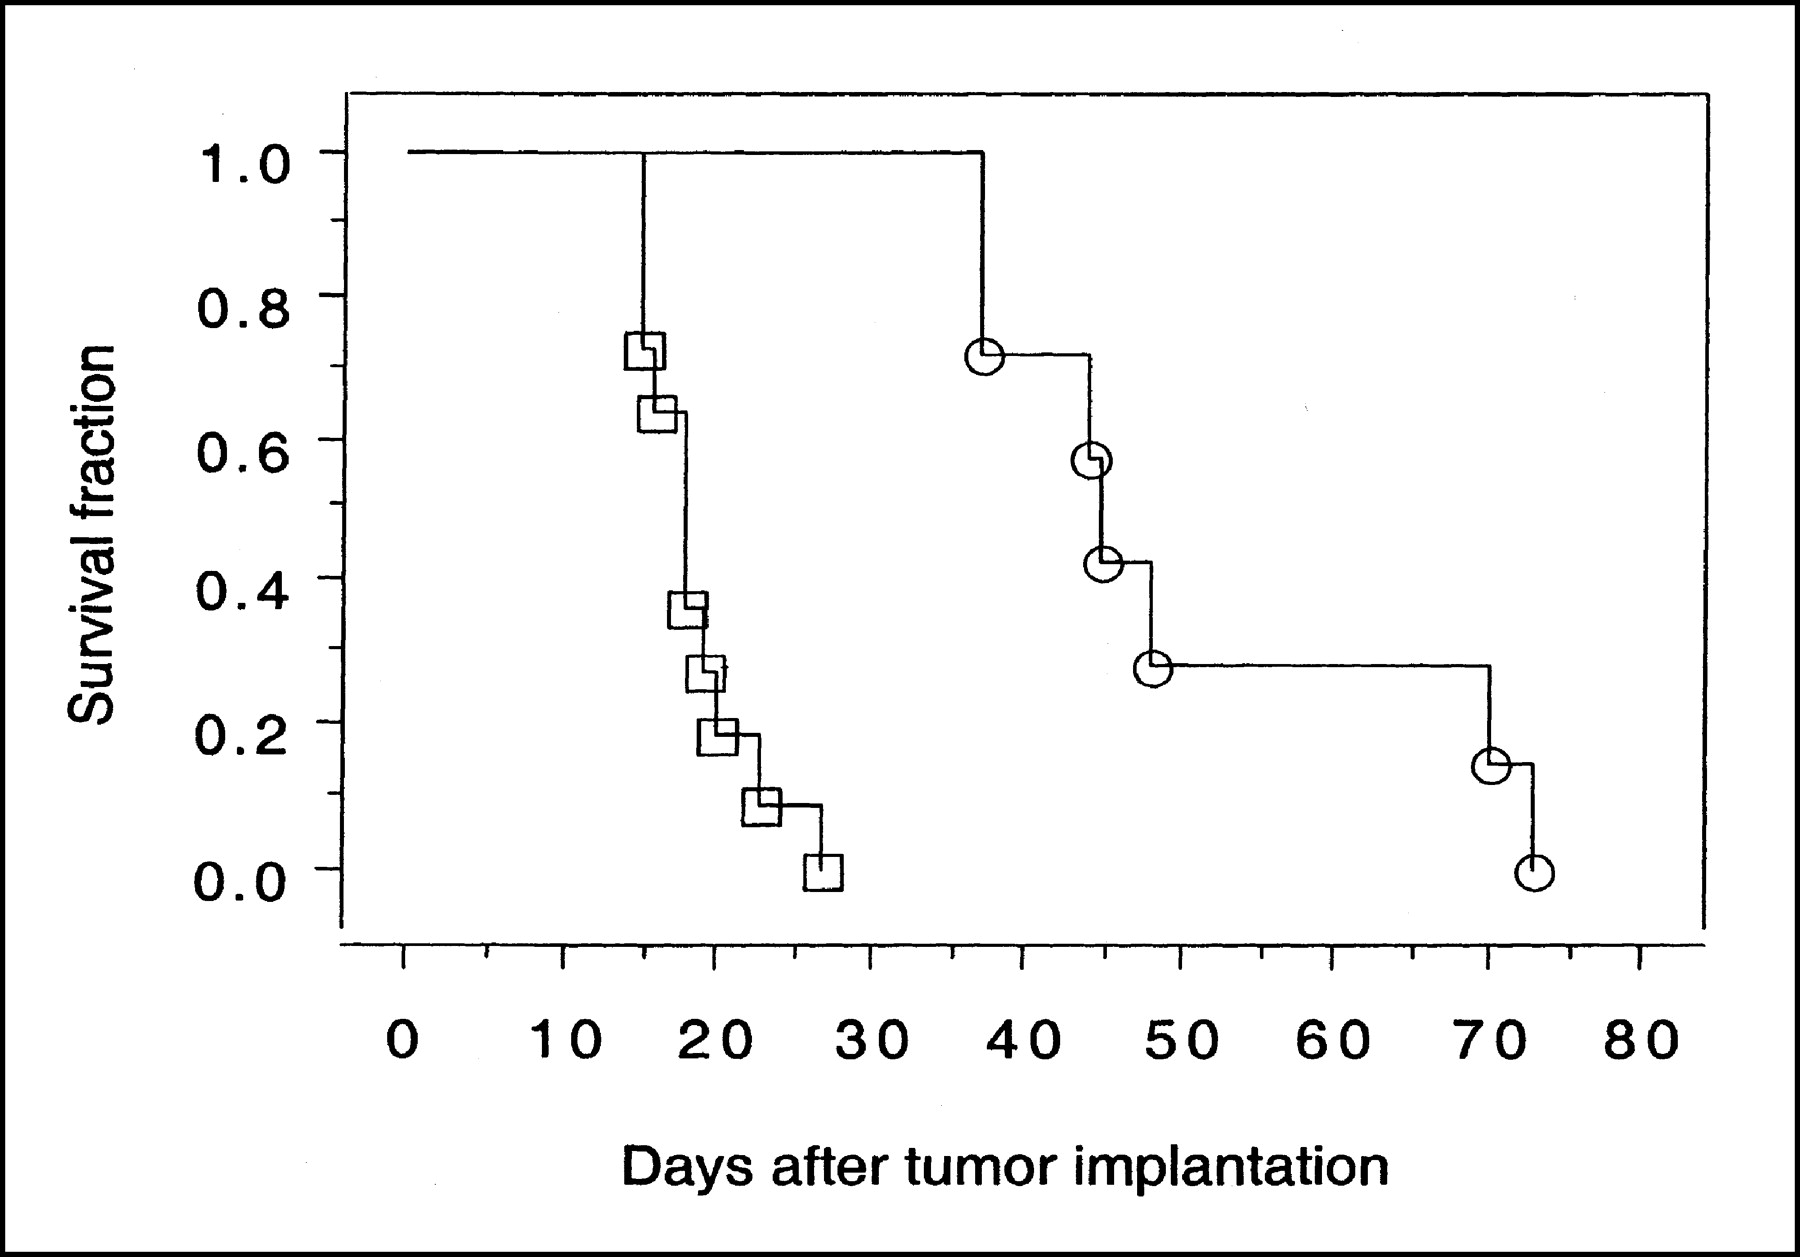
The survival of 21 GCV-treated and untreated animals was assessed (Fig. 5). Untreated animals died between day 15 and day 27 after tumor implantation (median survival, 18.0 ± 3.7 d). Three days of GCV treatment significantly increased the median survival of RG2TK+ tumor-bearing rats (P = 0.003); all animals survived >35 d and 50% of them survived >70 d (median survival excluding long-term survivors, 55.8 ± 16.5 d).

Survival of animals bearing intracerebral RG2TK+ xenografts after 3 d of treatment with GCV (○) or normal saline (□). Three GCV-treated long-term survivors are not included in plot.
DISCUSSION
Assessments of HSV-tk/GCV therapy response have been performed using CT and MRI in both animals (28–31) and patients (15). The results reported here clearly demonstrate that 14C-ACPC influx, K1ACPC, and facilitated transport, ∂K1ACPC, are good indicators of early treatment response after HSV-tk/GCV gene therapy. The changes in K1ACPC and ∂K1ACPC are substantial and are significantly greater than the corresponding changes in passive vascular permeability (K1DTPA) and relative glucose metabolism (R for FDG) that were measured in the same animals and in the same tissue (tumor) regions. Similarly, the analysis of this dataset using standard clinical nuclear medicine methods of analysis (calculating tumor-to-reference tissue radioactivity ratios and normalized tissue radioactivity [% dose/g tissue or standardized uptake value]) also demonstrates that 14C-ACPC imaging (at 10 min) is a substantially better indicator of early treatment response than 67Ga-DTPA imaging (at 10 min) or 18F-FDG imaging (at 60 min).
We have recently shown that facilitated transport of 14C-ACPC is upregulated across C6 and RG2 glioma capillaries compared with normal brain capillaries (14). In this study, we also show that facilitated 14C-ACPC transport across the capillaries of control (untreated) RG2TK+ tumors is also upregulated compared with that in the contralateral cortex and corpus callosum. This upregulation of 14C-ACPC transport occurred in the absence of a significant increase in passive vascular permeability of the tumor blood vessels. As a result, the 14C-ACPC autoradiographic images of control RG2TK+ tumors clearly demonstrated the presence of tumor and defined the infiltrating margins of the tumor in all 5 animals (Figs. 1A and 1C). In contrast, the corresponding 18F-FDG and 67Ga-DTPA images (Figs. 1B and 1D) were disappointing and did not clearly visualize the tumor nor define the tumor margins. One reason that 18F-FDG fails to show the tumor is high background in the brain. These findings are also consistent with clinical studies comparing 11C-methionine and 18F-FDG imaging of brain tumors (32).
14C-ACPC flux (K1ACPC) across the capillaries of the more viable-appearing portions of the treated tumors decreased to about 30% of their pretreatment levels in the absence of significant changes in plasma amino acid concentration, whereas passive vascular permeability (K1DTPA) changed minimally. The marked decrease in ∂K1ACPC indicates a marked decrease in facilitated neutral amino acid transport after GCV treatment. Previous studies in both animal and human tumors after radiotherapy and chemotherapy demonstrated a rapid reduction of amino acid (methionine) uptake after therapy (33,34). Haberkorn et al. showed a decrease of aminoisobutyric acid and methionine uptake in vitro in LXSNtk8 cells after GCV treatment and concluded that neutral amino acid transport and protein synthesis in the tumor cells were impaired after gene therapy with the HSVtk/GCV suicide system (20,35). Our study showed a decreased intensity of LAT1 staining of intratumoral microvessels in GCV-treated tumors, whereas vessels in the subarachnoid space and in normal brain maintained a normal staining intensity in the GCV-treated animals compared with that in untreated control animals.
The system L neutral amino acid transporter, LAT1, was recently cloned and it was demonstrated that the heavy chain of 4F2 antigen (4F2hc) is essential for functional expression of LAT1 (12); the L-transporter is formed from a heterodimeric LAT1-4F2hc complex (12). Recently, it was shown that LAT1 and 4F2hc protein are present in both the luminal and abluminal membranes of brain capillary endothelial cells (36,37). In our study, we confirmed that microvessels in normal brain cortex and relatively large arteries in the subarachnoid space express LAT1 and 4F2hc (Fig. 3A). We observed that intratumoral microvessels express high levels of LAT1 or 4F2hc (Fig. 3B and 3C) and that the intensity of staining in nontreated tumors was greater than that in normal cortex (Fig. 4), consistent with the higher 14C-ACPC uptake in RG2TK+ tumors compared with that in normal brain of untreated animals. The lower density of tumor cells and microvessels that expressed LAT1 or 4F2hc in the GCV-treated tumors may have also contributed to the lower uptake of 14C-ACPC. We also noted decreased staining for LAT1 (but not 4F2hc) in many microvessels of GCV-treated tumors (Fig. 3B, arrows), which suggests that GCV treatment decreases LAT1, but not 4F2 expression, in the endothelial cells in RG2TK+ tumors.
In general, GCV is thought to increase glucose transport and utilization (18) and decrease neutral amino acid transport (20). It, however, has a marginal effect on passive vascular permeability. The relatively high dose of GCV (50 mg/kg intraperitoneally twice daily for 3 d) used in these studies also had an adverse effect on 14C-ACPC facilitated transport across the contralateral brain capillaries. This decrease in ∂K1ACPC could not be explained by an increase in the concentration of plasma amino acids and increased competition for the neutral amino acid transporters across brain endothelial cells after GCV treatment. A qualitative comparison of brain microvessels for LAT1 and 4F2hc staining in GCV-treated and untreated animals did not show any differences. The effects of high-dose treatment tended to reduce passive vascular permeability of RG2TK+ tumors, although this reached statistical significance only in the viable-appearing portions of the tumor. Passive vascular permeability to 67Ga-DTPA of the contralateral brain tissue was unaffected by GCV treatment. GCV treatment tended to reduce the plasma clearance of 14C-ACPC and 67Ga-DTPA, as reflected by the plasma level of radiopharmaceutical at the end of the experiment (Table 4) and the plasma concentration-time integral (data not shown). Although these differences did not reach statistical significance, these changes may reflect decreased renal clearance due to decreased fluid intake and decreased hydration of the GCV-treated animals.
Tissue Uptake (% dose/g) of 14C-ACPC, 18F-FDG, and 67Ga-DTPA Uptake in RG2-tk Gliomas
The 18F-FDG images and measurements were disappointing. We had expected to demonstrate a substantially greater effect of high-dose GCV on glucose metabolism of transduced RG2TK+ tumors early in the course of treatment, and we expected that this effect would be readily visualized on the 18F-FDG autoradiogram. In clinical and experimental studies, an increase in 18F-FDG uptake has been observed early after treatment of some malignant tumors (35,38,39). Haberkorn et al. (35) suggested that this effect was predominantly due to enhanced glucose transport across the cell membrane, although the 60-min 18F-FDG images predominantly reflect hexokinase activity. Nevertheless, it has been shown that there is a redistribution of the glucose transporter from intracellular pools to the cell membrane, and this redistribution of transporter reflects a general reaction to cellular stress. Translocation of glucose transporters to the cell membrane as a first reaction to cellular stress may cause enhancement of glucose transport and represents a short-term regulatory mechanism that acts independently of protein synthesis.
In vitro multitracer uptake studies have shown that 18F-FDG uptake (nanomoles per active cells) in LXSNtk8 cells after GCV treatment was increased after 24-h exposure to GCV but subsequently decreased to the baseline after 48-h exposure. In contrast, 3-O-methylglucose (3-OMG) transport (nanomoles per active cells) was increased after 24-h exposure to GCV and remained at high values for at least 48 h (20). These in vitro studies indicate that glucose phosphorylation by mitochondrial hexokinase 2 (reflected in 18F-FDG accumulation over 60 min) and glucose transport (3-OMG transport) covary early (first 24 h) after combined HSV-tk/GCV gene therapy. However, phosphorylation and transport do not covary at later times (48 h), where 18F-FDG accumulation falls and 3-OMG transport remains high (20).
Other factors that must be considered in the interpretation of the in vivo data include the contribution of nonmalignant, stromal cellular elements within the tumor (33), the contribution of tumor-associated macrophages to the measured levels of 18F-FDG accumulation (34), and tumor cell density. Each of these factors will influence the 18F-FDG tumor image as well as tissue sampling measurements. The heterogeneity of measured values within the tumor is clearly reflected in the autoradiographic images, which have a resolution element of ∼100–200 μm (Fig. 1) (24).
In standard nuclear medicine practice, the analysis of images obtained from patient studies frequently involves a comparison between the tumor and a reference tissue (e.g., contralateral brain). A tumor-to-reference radioactivity ratio is often calculated or the standard uptake values (SUVs) (40) for tumor and reference tissues are compared. The SUV value is similar to the % dose/g tissue values reported here (Table 4), where SUV = % dose/g × body weight. A comparison of the 2 image sets (Fig. 1) shows that 14C-ACPC visualized the GCV treatment effects better than 18F-FDG or 67Ga-DTPA. This is also reflected by the highly significant changes in the tumor-to-contralateral brain ratio and the tumor accumulation (% dose/g) of 14C-ACPC in comparison with that of 18F-FDG and 67Ga-DTPA (Table 4). These results demonstrate that 14C-ACPC provides a better pretreatment assessment of transduced RG2TK+ brain tumors than 18F-FDG, consistent with previous studies (14,24), as well as a better assessment of GCV treatment effects.
CONCLUSION
These results demonstrate that 14C-ACPC transport (K1ACPC, ∂K1ACPC, and % dose/g ACPC) is a good indicator of early treatment response after HSV-tk/GCV gene therapy. The parametric images and changes in these values are substantial and are better than the corresponding measures obtained with 67Ga-DTPA and 18F-FDG in the same animals and in the same tumor regions. Amino acid transport imaging may be a good surrogate paradigm to monitor treatment response of brain tumors.
Acknowledgments
This work was supported by National Institutes of Health grants CA60706, CA57599, P50 CA86438, and R24CA80983.
Footnotes
Received Mar. 27, 2003; revision accepted Jul. 22, 2003.
For correspondence or reprints contact: Ronald G. Blasberg, MD, Department of Neurology, M-639, Memorial Sloan-Kettering Cancer Center, 1275 York Ave., New York, NY 10021.
E-mail: blasberg{at}neuro1.mskcc.org
REFERENCES
In this issue


Jump to section
Related Articles
Cited By...
- Heterogeneous Blood-Tumor Barrier Permeability Determines Drug Efficacy in Experimental Brain Metastases of Breast Cancer
- Selective Killing of Tumor Neovasculature Paradoxically Improves Chemotherapy Delivery to Tumors
- Molecular Imaging with 123I-FIAU, 18F-FUdR, 18F-FET, and 18F-FDG for Monitoring Herpes Simplex Virus Type 1 Thymidine Kinase and Ganciclovir Prodrug Activation Gene Therapy of Cancer