


Abstract
Microsphere technique is the reference for assessment of pulmonary blood flow (PBF) but is destructive; PET, however, can determine PBF noninvasively. Comparisons of these 2 methods are scanty. Our study aimed at comparing these 2 techniques using a mathematic model taking into account the right ventricle in determining the transit time of a tracer through lung tissue. Methods: Ten normal pigs were investigated at baseline, during dobutamine infusion, and during 10 cm H2O of positive end-expiratory pressure. Under each condition, PBF was successively measured with PET (PET-PBF) and radioactive microspheres (MS-PBF). For PET-PBF, 2 mCi (74 MBq) 15O-labeled water were injected intravenously over 20 s and PET scanning was performed for 10 min. The input function was determined noninvasively from PET and invasively from mixed venous blood withdrawals. PET-PBF was computed using a mathematic model taking into account the right ventricle in determining the transit time of the tracer through lung tissue. For MS-PBF, 1 given isotope was injected under a given condition. PET-PBF and MS-PBF for 5 lung regions were compared. Results: PET-PBF significantly correlated with MS-PBF both over all experimental points (PET-PBF = 0.79 · MS-PBF + 1,538; r = 0.79; P < 0.001) and in separate lung regions. Invasive and noninvasive input functions also correlated significantly (r = 0.90; P < 0.001). Simulations stressed the crucial role of the right ventricle to the transit time of tracer through lung tissue in the determination of PET-PBF. Conclusion: PBF can accurately be assessed using PET and a mathematic model taking into account the right ventricle in determining the transit time of a tracer through lung tissue. Noninvasive determination of the input function of the right ventricle is accurate and can readily be used for clinical applications.
Pulmonary blood flow (PBF) can be assessed by many methods, but few of them provide accurate and repeatable regional measurements. The indicator dilution method leads to quantitative but no regional information. The method using γ-radiolabeled microspheres (MS-PBF) is probably the gold standard for measuring regional PBF but requires invasive measurement of radioactivity in the arterial pulmonary circulation. Furthermore, with the MS technique, accurate quantitative regional information can be obtained only by removing the lung and processing individual tissue samples, an approach that excludes use in humans.
PET can accurately and noninvasively measure regional PBF with 15O-labeled water (H215O) (1). In their pioneering study, Mintun et al. (1) compared PET-PBF measured using H215O with 68Ga MS as a gold standard and found close agreement between the 2 techniques. In this study, however, using PET in both methods could have led to a methodological bias, in the sense that the same apparatus was used for the 2 measurements. Determination of PBF by means of H215O PET has extensively been used on dogs by the same group (2–4). In these studies, the values of PBF were obtained using a mathematic model stemming from the autoradiographic technique originally described by Kety (5,6). This approach has, however, some drawbacks. It requires that a second PET scan be performed at the equilibration between tissue and blood to compute the coefficient of partition of water (λ), which is needed for PBF determination. Because pulmonary arteries and the right ventricle are close to each other, tissue radioactivity can be overestimated as a result of spillover of vascular radioactivity. Other mathematic models may allow for continuous adjustments of λ (7). With the new generation of PET devices, 3-dimensional acquisitions can be performed and less radioactivity is required. Obviously, using lower amounts of radioactivity to protect patients and health-care providers is of paramount importance.
The determination of PBF requires a tracer input function. This can be determined by withdrawing blood samples from the pulmonary artery. It is possible, however, to determine the input function noninvasively using a region of interest (ROI) in the right ventricular chamber during PET. Such an assessment of input function has been applied to the left ventricle for the study of myocardial blood flow (8,9) but not, to our knowledge, to the lung for the study of PBF.
Therefore, this study was undertaken to investigate the measurement of PBF with PET using a new generation of PET device (PBF-PET). γ-radiolabeled MS measurement (MS-PBF) was used as the reference, a new mathematic model was applied to take into account the time delay between vascular and tissue invasions, and invasive and noninvasive input functions were included. We aimed at detecting changes in regional PBF by the 2 techniques. Therefore, during our investigation a wide range of cardiac output was processed in normal pigs.
MATERIALS AND METHODS
Animal Preparation
This study was approved by the University of Lyon animal research committee and was performed on 10 pigs (mean body weight ± SD, 23.7 ± 1.9 kg) of either sex. They were premedicated with an intramuscular injection of xylazine (20 mg), ketamine (70 mg), and droperidol (5 mg). Anesthesia was induced with 100 mg intravenous propofol followed by a continuous intravenous infusion of 350 mg/h. Analgesia was maintained with repeated injections of 100 μg fentanyl every 30 min. Finally, a continuous intravenous infusion of pancuronium bromide (3 mg/h) was used to completely relax the muscles.
After tracheotomy, all pigs were mechanically ventilated (Cesar II; Taema, Antony, France) in volume-controlled mode with a squared inflation flow and settings aiming to achieve normoxia (mean fractional concentration of oxygen in inspired gas ± SD, 34.4% ± 23.9%) and normocapnia (mean respiratory rate ± SD, 16.9 ± 0.7 breath · min−1; tidal volume, 10 mL · kg−1) on zero end-expiratory pressure. Body temperature was kept normal using a heating pad.
The carotid artery was cannulated with a 8.5-French catheter (Exacta; Ohmeda, Herts, U.K.). A 7.5-French pulmonary artery catheter (Swan-Ganz CCOmbo; Baxter Healthcare Corp., Deerfield, IL) was inserted through the left internal jugular vein. An 8.5-French 3-lumen central venous catheter (Seldiflex; Plastimed Laboratories, St. Leu la Foret, France) was then inserted into the right internal jugular vein.
To explore a wide range of PBF values, we studied the animals at baseline, during dobutamine infusion, during a positive end-expiratory pressure of 10 cm H2O, and again at baseline. Two pigs were studied only at baseline. Each condition was applied for 30 min.
Physiologic Measurements
Cardiac output was measured by thermodilution technique in triplicate (Edwards Critical Care Explorer; Baxter). Five milliliters of 0.9% saline at room temperature were injected into the proximal site of the Swan-Ganz catheter regardless of the respiratory cycle. The 3 values were then averaged.
PBF Assessment with PET
An ECAT EXACT HR+ 3D PET scanner (CTI, Knoxville, TN/Siemens Medical Systems, Inc., Hoffman Estates, IL), whose design and performance characteristics have been discussed elsewhere (10), was used. The nominal axial resolution was 4.1 mm in full width at half maximum (FWHM) at the center of the field of view, and the nominal transverse resolution was 4.4 mm FWHM (11). The image reconstruction resolution was 9.5 mm. PET tissue activity measurements were corrected for decay to the time of isotope administration. First, a 15-min transmission scan was obtained to correct the subsequent emission data for attenuation and also to define the lung ROI. Next, 2 mCi (74 MBq) H215O were injected over 20 s. Data were collected for 10 min 10 s from the start of the injection as follows: 10 images of 4-s duration each, 3 images of 10-s duration, 2 images of 30-s duration, 1 image of 2-min duration, and 1 equilibrium image of 6-min duration.
Data were analyzed with Capp software (CTI/Siemens). Of the 63 original planes, those without lung parenchyma were excluded. The 36 remaining planes were divided by 4 to finally obtain 9 planes. Lung ROIs included all lung elements of each side of the thorax and excluded hila, chest wall, and diaphragm. ROIs were stored in the computer, and the time-activity curves (TACs) of these regions were subsequently measured on emission scans (Fig. 1).

Lung PET images of 1 pig. (A) Transmission scan used to identify lung ROIs. (B) Image obtained 6 s after injection of 2 mCi (74 MBq) H215O and used to draw ROI inside right ventricle. (C) Image obtained 38 s after injection of 2 mCi (74 MBq) H215O. (D) TAC curves of right ventricle and lung obtained from preceding drawn ROIs.
The radioactivity of the blood entering the lung after tracer infusion is assumed to be the input function of the tracer in the lung. The input function was assessed invasively by withdrawing blood from the pulmonary artery through the Swan-Ganz catheter every 6 s during 1 min and then every 30 s until the end of acquisition. The activity in these samples was measured immediately in a well counter (Cobra II Auto-Gamma; Packard Instrument Co., Inc., Downers Grove, IL), and samples were weighed. Counts in each sample were corrected for physical decay to the time of isotope administration and were expressed as becquerels per milliliter, assuming a density for blood of 1.05 g · mL−1. To ensure a perfect match between activity measured with the counter and activity measured with the PET camera, the 2 devices were cross calibrated before the animal experiment. Input function was noninvasively assessed from the blood TACs in the right ventricle ROI on the PET images (Fig. 1).
Data Analysis of PET
The autoradiographic model of Kety (5,6) was applied to measure regional PBF using PET (1). In the current investigation, another strategy was applied to the model of Kety and is referred to as the dynamic model. This consisted of collecting all the radioactivity values within the 10 min 10 s after tracer infusion and fitting these to the following equation:
 Eq. 1 where ti is the starting time of the PET image; CT and Ca are tissue and pulmonary arterial blood concentrations, respectively; t is instantaneous time; dt is the time derivative; F/V is the flow per unit of tissue volume; e is an exponential function; d is the time delay between Ca and arrival of activity in the tissue; and * is the convolution operator. CT and Ca were measured from experimental data, whereas F/V and λ were estimated by minimizing the sum of squared deviations. Therefore, the optimal value of F/V was obtained by a direct search over the entire range of values. We were unable to implement the former algorithm with d, probably because of the 4-s duration of the PET images. Therefore, d was set at 2 s to minimize the least squares sum of fitted TAC to tissue TAC.
The concordance of units between PET (mL · min−1 · 100 mL−1) and MS (mL · min−1 · 100 g−1) was obtained from measurement of regional lung density. This was assessed with PET in each ROI on the transmission images after calibration of our PET scan according to Schuster et al. (12). The relationship between the known density and the attenuation coefficient measured with PET was adequately described by the following equation: Density = 10.5 · attenuation coefficient + 0.008 (r = 1; P < 0.001).
Data Analysis of Input Function
The TAC values obtained from the invasive method were first fitted for delay (i.e., right ventricle-pulmonary artery transit time plus transit time in the Swan-Ganz catheter) to the TAC values obtained from the noninvasive method. The dispersion of both TACs was assessed by measurement of FWHM activity on both curves in each pig under each experimental condition. Second, delay-fitted invasive TACs were interpolated to match PET measurement times. The relative errors of input functions were computed as the ratio of the difference (PET right ventricle activity − counter pulmonary artery activity) to the mean values of these activities. Finally, delay-fitted and interpolated invasive and noninvasive TACs were integrated over 60 s (12 frames) for each pig under each experimental condition.
Simulations
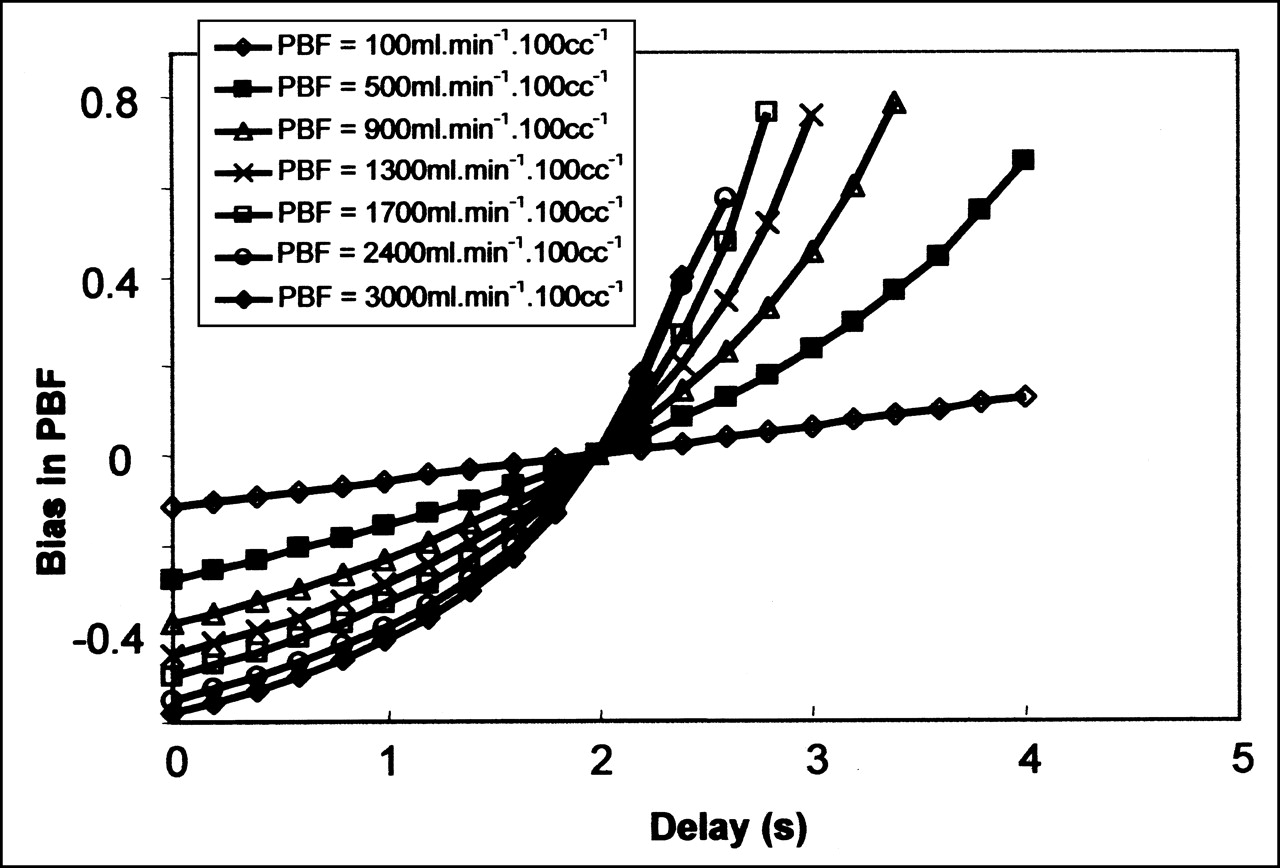
Simulations showed the effect of parameter d (Eq. 1) on the values of PBF obtained from the dynamic model. Right ventricle TACs were true curves after injection of 2 mCi (74 MBq) H215O, whereas lung tissue TACs were simulated by setting λ at 0.3 and d at 2 s. Parameter d was then varied from 0 to 4 s and both true vascular and simulated tissue curves were fitted to obtain a simulated value of PBF. The relative error in PBF was computed from the ratio of the difference between the simulated and true values of PBF to the true value of PBF. Bias in PBF was assessed at 7 fixed values of PBF.
PBF Assessment with MS
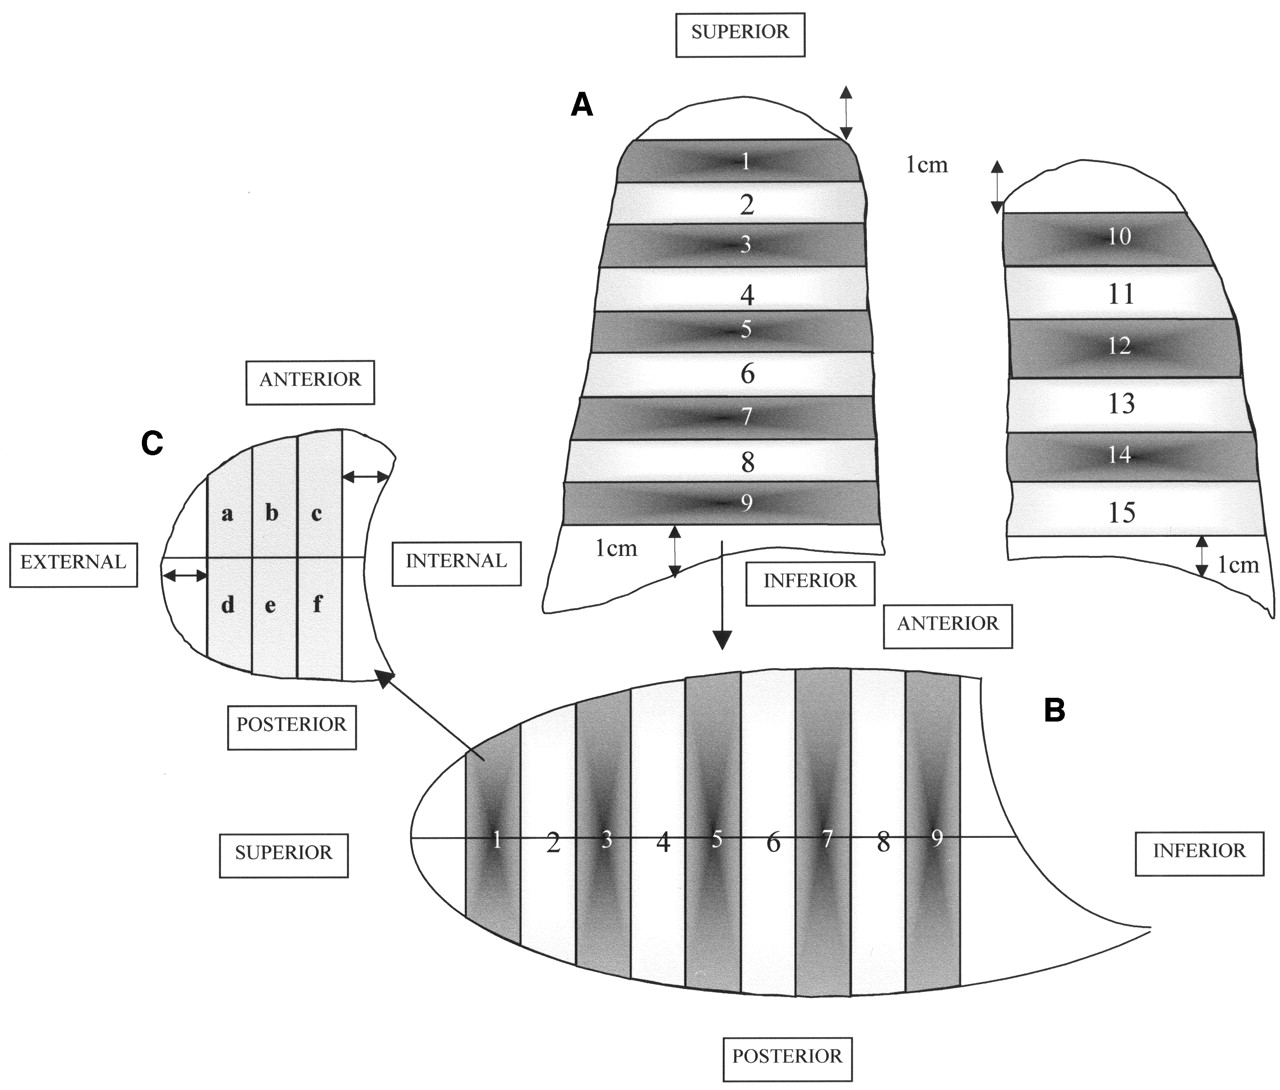
MS-PBF was systematically measured after PET-PBF. MS-PBF was assessed using the following 15-μm-diameter radioactive MS: 46Sc, 103Ru, 113Sn, and 141Ce (NEN-TRAC; NEN Life Science Products, Boston, MA). A given microsphere was attached to a given experimental condition in all cases. The MS were suspended in 3 mL 0.9% saline with 0.01% polysorbate 80 as surfactant agent, sonicated for 5 min, and stirred immediately before injection. The injection was administered in 10 s through the proximal part of the 3-lumen catheter (3–7 × 10⁶ MS per injection). The catheter was thoroughly flushed with 0.9% saline after the injection. Before and for 30s after the injection, blood was withdrawn through the Swan-Ganz catheter into a heparinized syringe at 0.17 mL · s−1. The activity of blood withdrawn was determined with a γ-counter as described below. No cardiorespiratory change was noted after the injection of the MS. At the end of the experiment, the animals were deeply anesthetized and killed by an intravenous injection of potassium chloride. A sternotomy was performed, and the trachea was occluded during mechanical ventilation at functional residual capacity. The lungs and heart were then removed. Immediately after removal, the fresh lungs were weighed and sectioned as follows (Fig. 2). Approximately a 1-cm width of lung tissue was removed in the uppermost, lowermost, and most external parts to avoid a decrease in counting efficiency and thus uncertainty in PBF and in weight because of the low radioactivity of these small samples. The lungs were divided into transversal planes of equal size (9 in the right lung and 6 in the left lung). Each plane was then sectioned into anterior and posterior coronal parts. Each of these was further divided into 3 sagittal areas (external, medial, and internal). All large airways seen at visual inspection were removed from the lung pieces. Then, we obtained 90 lung samples per pig. Each fresh sample was then weighed before assessment of radioactivity. A well crystal γ-counter (Cobra II Auto-Gamma) was used to estimate tissue and blood sample radioactivity. The measured activity for each nuclide energy peak was corrected for decay time and spillover by use of the matrix inversion method. Each sample was counted long enough to ensure a counting error < 1%. The heart and 1 kidney were harvested to ensure that the radioactivity count lacked excess from the background. Regional PBF was then calculated by the standard MS reference technique (13).

Method of lung sectioning. (A) First, most peripheral regions of upper, lower, external, and internal parts of each lung were excised over 1 cm (↔). Each lung was then sectioned into transverse slices (9 for right lung and 6 for left lung). (B) Then, each of these sections was divided into 2 coronal planes. (C) Last, each coronal slice was divided into 3 sagittal sections.
Data Analysis
At the time of lung dissection, upper (slices 1–3 in Fig. 2), middle (slices 4–6), and lower (slices 7–9) regions were grossly identified in the right lung and upper (slices 10–12) and lower (slices 13–15) regions were grossly identified in the left lung. To replicate the above lung compartmentalization into the PET images, great care was taken to delineate similar lung volumes by merging adjacent ROIs. PET-PBF and MS-PBF were measured in these regions.
Values are expressed as mean ± SD. Regression was analyzed by the least squares method with the following 2 specific features: The y values were centered on the mean value of x, and the same pig was used for the different experimental conditions. For the latter, we applied a mixed linear model with random intercept and random slope using the “proc mixed” procedure available on SAS software (version 6.12; SAS Institute Inc., Cary, NC). Agreement between PET-PBF and MS-PBF was tested using the Bland-Altman method (14). The level of significance was set at <0.05. Statistical analysis was otherwise performed using SigmaStat (version 2.03; SPSS Inc., Chicago, IL) for Windows (Microsoft, Redmond, WA).
RESULTS
The average values of cardiac output were 3.6 ± 0.8 L · min−1 (range, 1.5–5.6 L · min−1) under the basal condition, 4.8 ± 0.8 L · min−1 (range, 3.5–5.6 L · min−1) with dobutamine, and 2.3 ± 0.4 L · min−1 (range, 1.53–2.99 L · min−1) with positive end-expiratory pressure.
Comparison of PET-PBF and MS-PBF
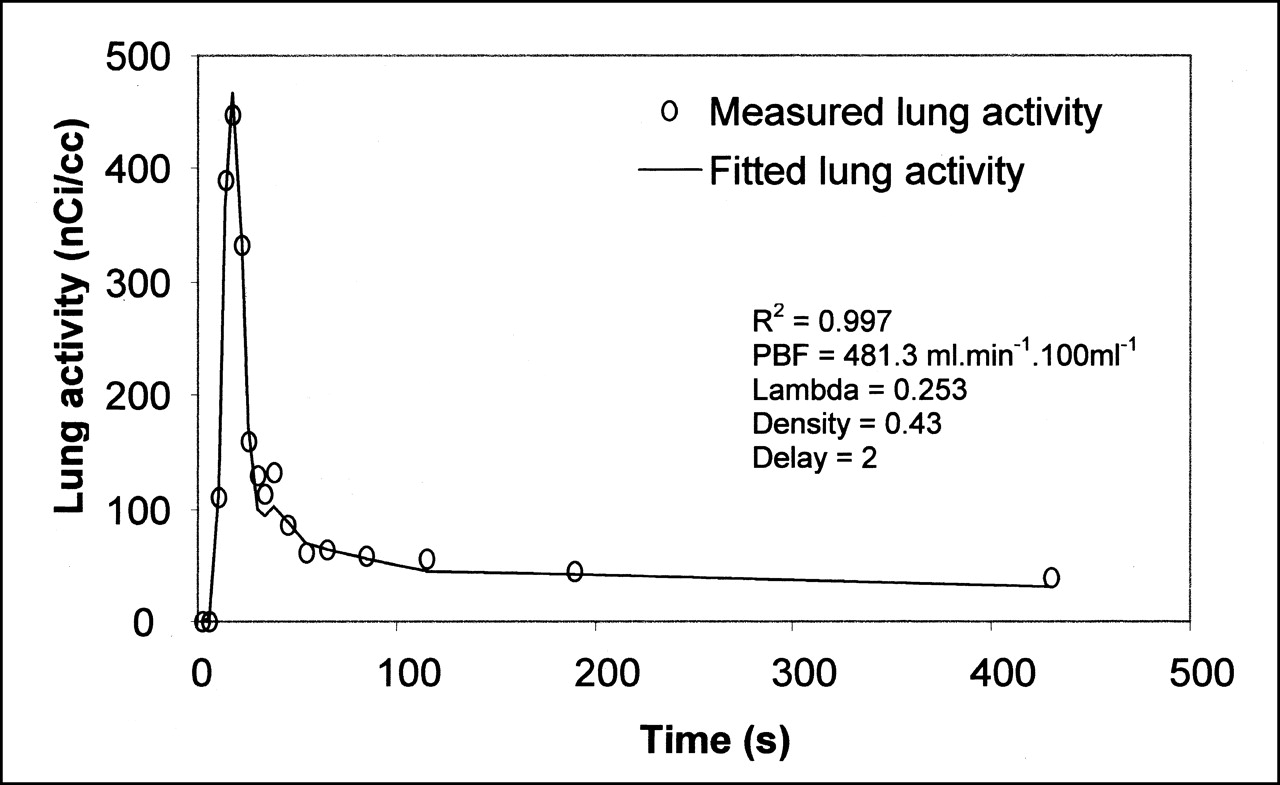
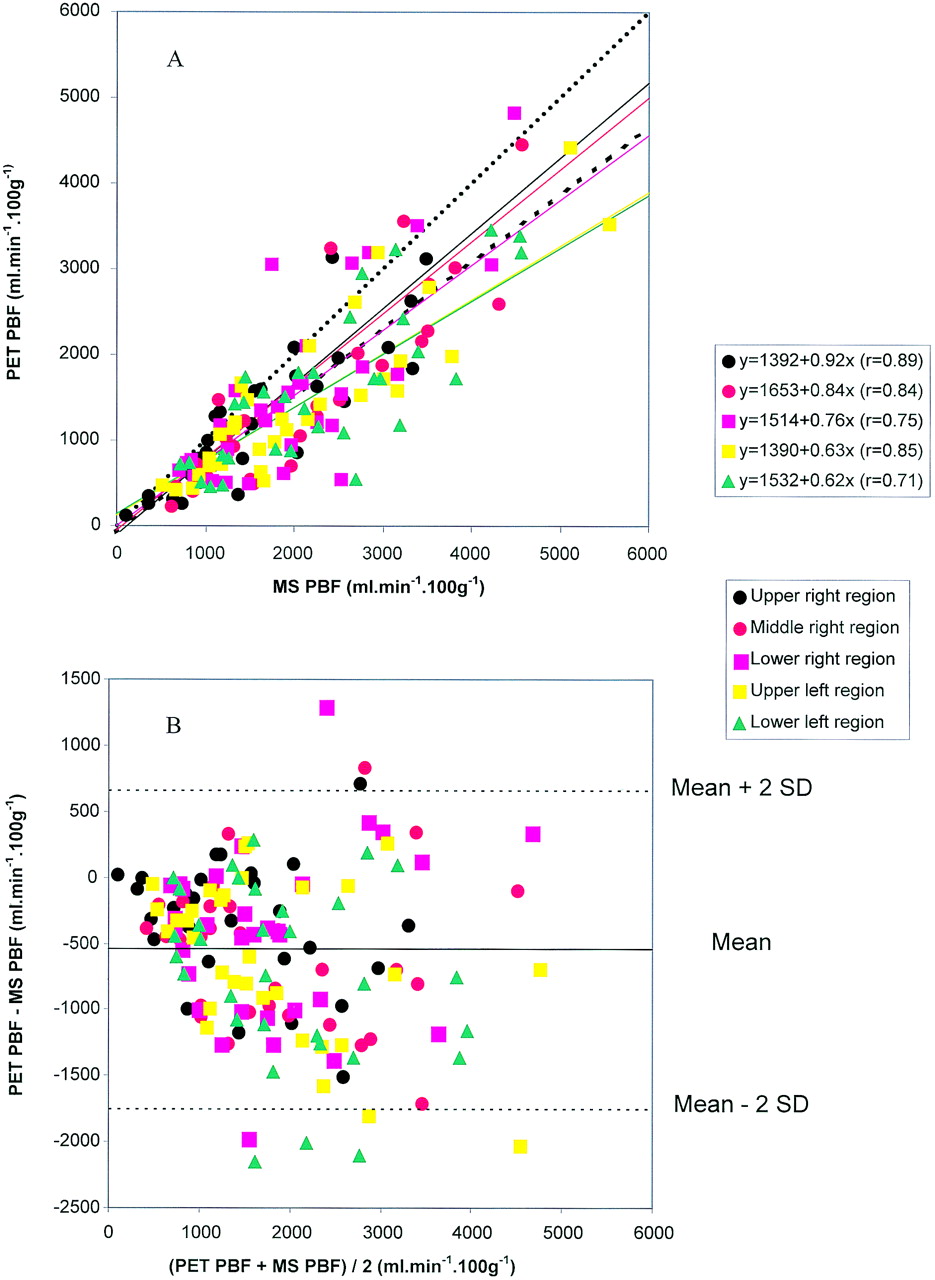
As shown in Figure 3, Equation 1 adequately fitted the experimental points of lung tissue activity against time. The relationships between PET-PBF and MS-PBF in each of the 5 lung regions are shown in Figure 4A. As can be seen, the correlations were significant. The mean MS-PBF values were 1,696, 2,021, 1,999, 2,019, and 2,242 mL · min−1 · 100 g−1 lung for upper right, middle right, lower right, upper left, and lower left regions, respectively. Over the entire set of data points, the mean MS-PBF was 2,029 mL · min−1 · 100 g−1 lung and the regression line equation was PET-PBF = 0.79 · MS-PBF + 1,538 (r = 0.79; P < 0.001). As a whole, the mean value of PET-PBF was 1,557 ± 1,042 mL · min−1 · 100 g−1 lung (range, 101–5,422 mL · min−1 · 100 g−1 lung). The corresponding average value of λ was 0.26 ± 0.07. Figure 4B shows that, compared with the MS technique, PET-PBF underestimated PBF.

Using Equation 1, adequacy of fit of lung activity in 1 representative pig.

Relationships between PET-PBF and MS-PBF. (A) Relationship between PET-PBF and MS-PBF in the 5 lung regions. (B) Assessment of bias in PBF between PET and MS techniques. Each symbol is value of PBF in 1 lung region in a given experimental condition in 1 animal. Corresponding regression equations are also shown. Dotted line is regression line obtained over all experimental points. Dashed line is line of identity.
Invasive Versus Noninvasive Input Function
The right ventricle TAC obtained from PET and the pulmonary artery TAC obtained from the well counter are shown in Figure 5A for 1 pig (pig 4) under the baseline condition. The pulmonary artery curve was shifted to the right as a result of the time delay of the sampling rate in the Swan-Ganz catheter. After the pulmonary artery curve was corrected for this phase shift, the 2 curves were almost superimposed (Fig. 5B). The relative errors were then computed at each data point. Immediately after water injection, the relative errors were apparently large and in the negative direction (Fig. 5C), as is explained by the shape of the pulmonary curve, which was initially enlarged because of the dispersion function of the Swan-Ganz catheter (Fig. 5B). Actually, although the relative errors were large the absolute values of the differences were small, and once the equilibration was reached the relative errors became stable and minimal (Fig. 5C). Accordingly, the mean value of the FWHM of the noninvasive TAC amounted to 14.96 ± 2.63 s, which was not statistically different from the value for invasive TAC (16.12 ± 2.24 s). The correlation between noninvasive and invasive TACs integrated over 60 s is shown in Figure 5D. The slope of the regression line was significantly different from zero (P < 0.001), but the intercept was not.
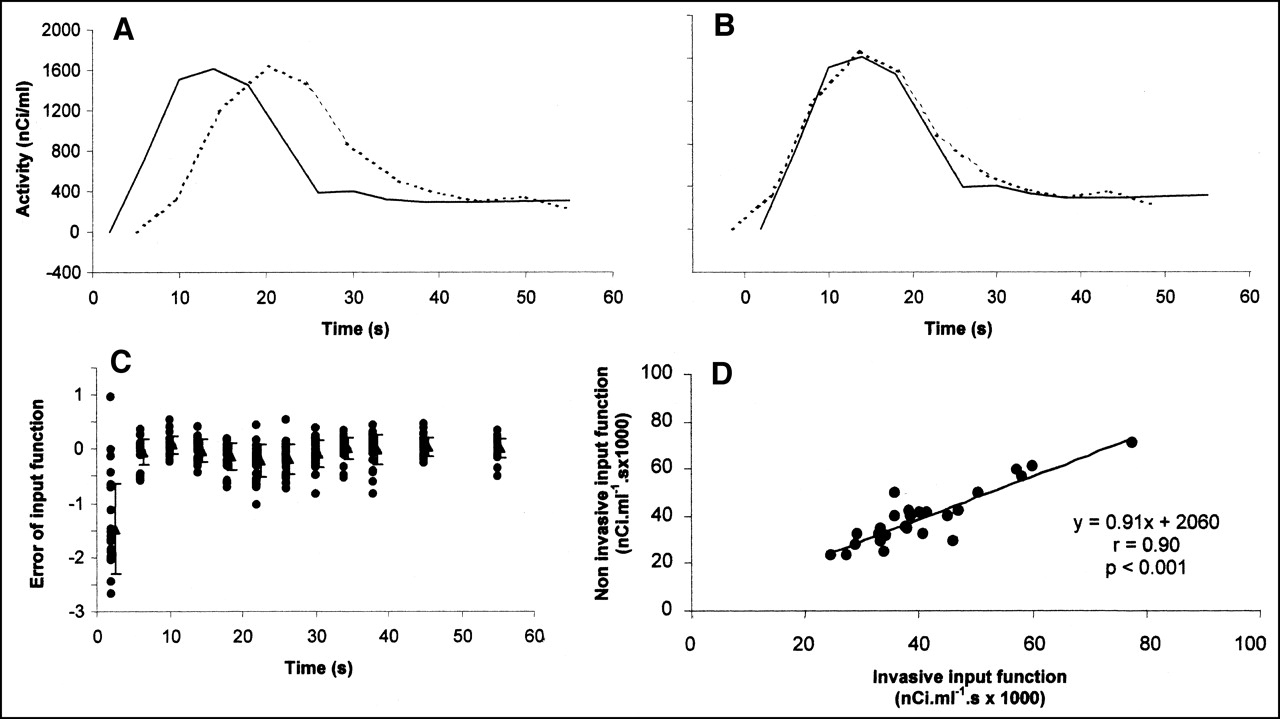
Input function assessment. (A and B) Plots of activities in right ventricle (solid lines) and pulmonary artery (dotted lines) before (A) and after (B) correction for time shift in pig 4 during baseline condition. (C) Individual (•) and mean (±SD) values (▴) of relative errors of input function as function of time of PET image. Relative error of input function was computed as ratio of difference in right ventricle and pulmonary artery activities to mean of right ventricle and pulmonary artery activities. (D) Relationship between noninvasive and invasive input functions. Values of input function are expressed as integral of time-activity curves over first 60 s after water injection.
Simulations
The effect of parameter d (Eq. 1) on the bias in PBF is shown in Figure 6. At the lowest PBF, the bias in PBF was small and increased linearly with d. At higher PBF values, the relationships between PBF bias and d were more complex. When parameter d was underestimated relative to the fixed value of 2 s, PBF was markedly underestimated and this underestimation increased with PBF. Conversely, when parameter d was overestimated, the PBF was overestimated and the bias exponentially rose with PBF.

Simulations of PBF. Fitted relationships between bias in PBF and tracer transit delay for pulmonary artery and lung tissue (d in Eq. 1) at different fixed values of PBF. Bias was assessed as relative error in PBF and computed from ratio of difference between simulated and true values of PBF to true value of PBF.
DISCUSSION
The main findings of this study on mechanically ventilated normal pigs were that regional PBF measured with H215O closely correlated with regional PBF measured with radioactive MS, that the right ventricle time activity was validated as a noninvasive input function for PBF assessment, and that the time lag between right ventricle and lung tissue was an important determinant of regional PBF.
We injected 2 mCi (74 MBq), a dose that did not result in crystal saturation and provided an adequate signal-to-noise ratio. In previous studies, more radioactivity was used (1), to match the requirements of earlier PET devices that allowed only 2-dimensional acquisition. Newer PET devices allow 3-dimensional acquisition, thereby increasing sensitivity and requiring less radioactivity. The risk of crystal saturation is therefore avoided. Furthermore, the use of low-dose radioactivity is of paramount importance in human applications.
The comparison of PBF with the 2 methods could have been affected by several factors. First, because of vascular sampling from the pulmonary artery, we could not simultaneously measure PBF with the 2 techniques. Furthermore, the radioactive MS can induce variations in the local blood flow by obstructing the vascular bed. However, we believe that, because of the small size of the MS used (15 μm) and the absence of change in cardiac output after MS injection, the accuracy of the PBF-MS comparison was not affected in our study. Moreover, we systematically injected the MS after measurement of lung radioactivity with PET. Second, one could argue that γ-radioactive MS could not ensure that regional tissue MS activity was determined in the same plane and geometry as H215O activity with PET. Indeed, MS activity was determined on excised lung, whereas H215O activity was measured in vivo. To avoid such uncertainty, we compared the mean values of PBF obtained over the large lung regions by the 2 methods. We are aware that this approach was grossly relative to the method of lung dissection introduced by Glenny et al. (15). However, that method is extraordinarily long and complex. Moreover, had we been able to carry it out, we would also have had concerns about the spatial matching of very small lung samples between lung dissection and PET dissection. Finally, the mean MS-PBF in our study was 2,046 ± 1,024 mL · min−1 · 100 g−1 of fresh lung (range, 594–5,058 mL · min−1 · 100 g−1), a value close to that reported for frozen fresh lung in normal dogs (2,050 ± 270 mL · min−1 · 100 g−1) (16).
Using a so-called static model, Mintun et al. (1) found that, on average, PBF in normal dogs amounted to 178 mL · min−1 · 100 mL−1, much lower than the 714 mL · min−1 · 100 mL−1 found in our study. In our study, using the same static model, PBF averaged 201 mL · min−1 · 100 mL−1 (data not shown). We hypothesized that the difference between these 2 values might be explained by the tracer transit time between the right ventricle and the lung tissue, a factor that is not considered with the static model. The crucial importance of time delay has already been stressed in studies assessing myocardial blood flow with PET (17,18). In cardiac studies, the impact of d stemmed from the distance between the location of the entry function determination and the myocardium. It is likely that this factor is even more important for the lung because of the greater distance between the right ventricle and lung tissue. This parameter was therefore introduced into the model used in our study.
In our study, PET-PBF slightly underestimated MS-PBF. This underestimation was observed at low as well as at high PBF values. The correlation coefficients between PET-PBF and MS-PBF were not different at low versus at high PBF values. This underestimation could partly be explained by the partial-volume effect. However, our simulations of the effect of the time delay strongly suggested that this parameter was probably the most important factor accounting for the difference between PET and MS. Nevertheless, the use of a time delay > 2 s alters the quality of the fit because of an increase in residuals (data not shown). Moreover, the time delay should be very different between animals and between experimental conditions. Furthermore, the true time delay is a function of the location of the ROI studied and may increase as the distance to the right ventricle increases.
In our simulations, the bias in PBF was marked at high PBF values. It should be noted that the simultaneous occurrence of high values of both d and PBF are probably not found within the lung, making overestimation of PBF at high values of d unlikely (Fig. 6).
On the basis of simulated data, the investigators of the St. Louis group had addressed the issue of the impact of errors in input function measurement on estimation of PET-PBF (19,20). In our current study, a formal validation of noninvasive input function from actual data was performed. Noninvasive and invasive TACs were significantly correlated. Yet PET seems to slightly underestimate vascular activity, as shown in Figure 5D by the slope of the regression line (0.91) between noninvasive and invasive TACs integrated over 60 s. Because a value of 0.91 minimized the difference between noninvasive and invasive activity (data not shown), one could consider using the inverse of this value as a recovery coefficient to correct noninvasive TAC before its use in the mathematic model. Therefore, noninvasive assessment of input function can likely be used in humans, whose right ventricle is larger than that of piglets.
CONCLUSION
PBF can noninvasively and accurately be assessed from PET using water and a mathematic model that takes into account the transit time of a tracer from the right ventricle to lung tissue. Although PBF is slightly underestimated by this method, the underestimation does not invalidate PBF assessment with PET. Noninvasive determination of input function for PBF assessment with PET was accurate and can readily be used for clinical applications.
Acknowledgments
The authors thank Muriel Rabilloud, MD, for her help with statistics.
Footnotes
Received Nov. 20, 2001; revision accepted Apr. 19, 2002.
For correspondence or reprints contact: Claude Guérin, MD, Service de Réanimation Médicale et Assistance Respiratoire, 103 Grande Rue de la Croix-Rousse, Lyon 69004, France.
E-mail: claude.guerin{at}chu-lyon.fr


