


Article Figures & Data
Figures
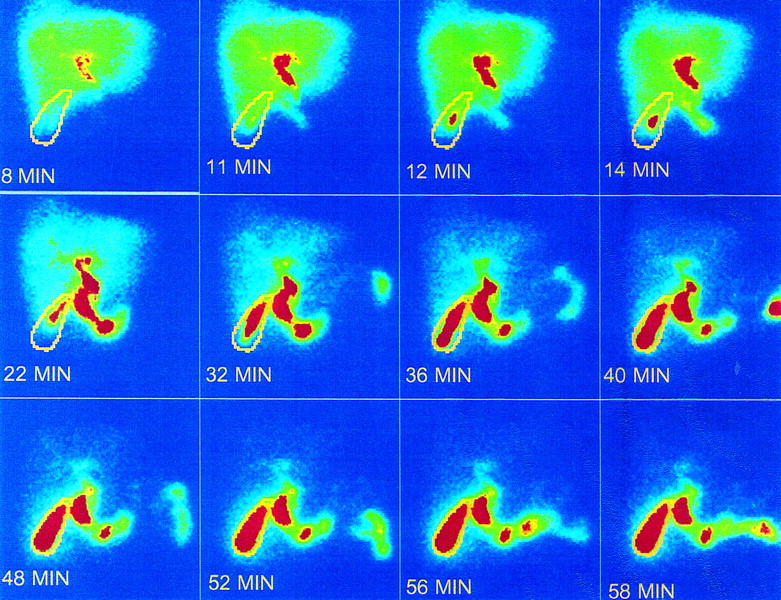
- FIGURE 1.
Hepatic bile transit pattern within gallbladder lumen. Outline of fully filled gallbladder is superimposed onto selected earlier frames along with their time of appearance from injection of 99mTc-mebrofenin. Radiolabeled hepatic bile first enters gallbladder at 12 min (upper threshold set for red color) along central long axis of images at 14, 22, 32, 36, and 40 min. Once filled fully with radiolabeled bile, not much change in size of gallbladder is shown in frames 48 through 58 min.
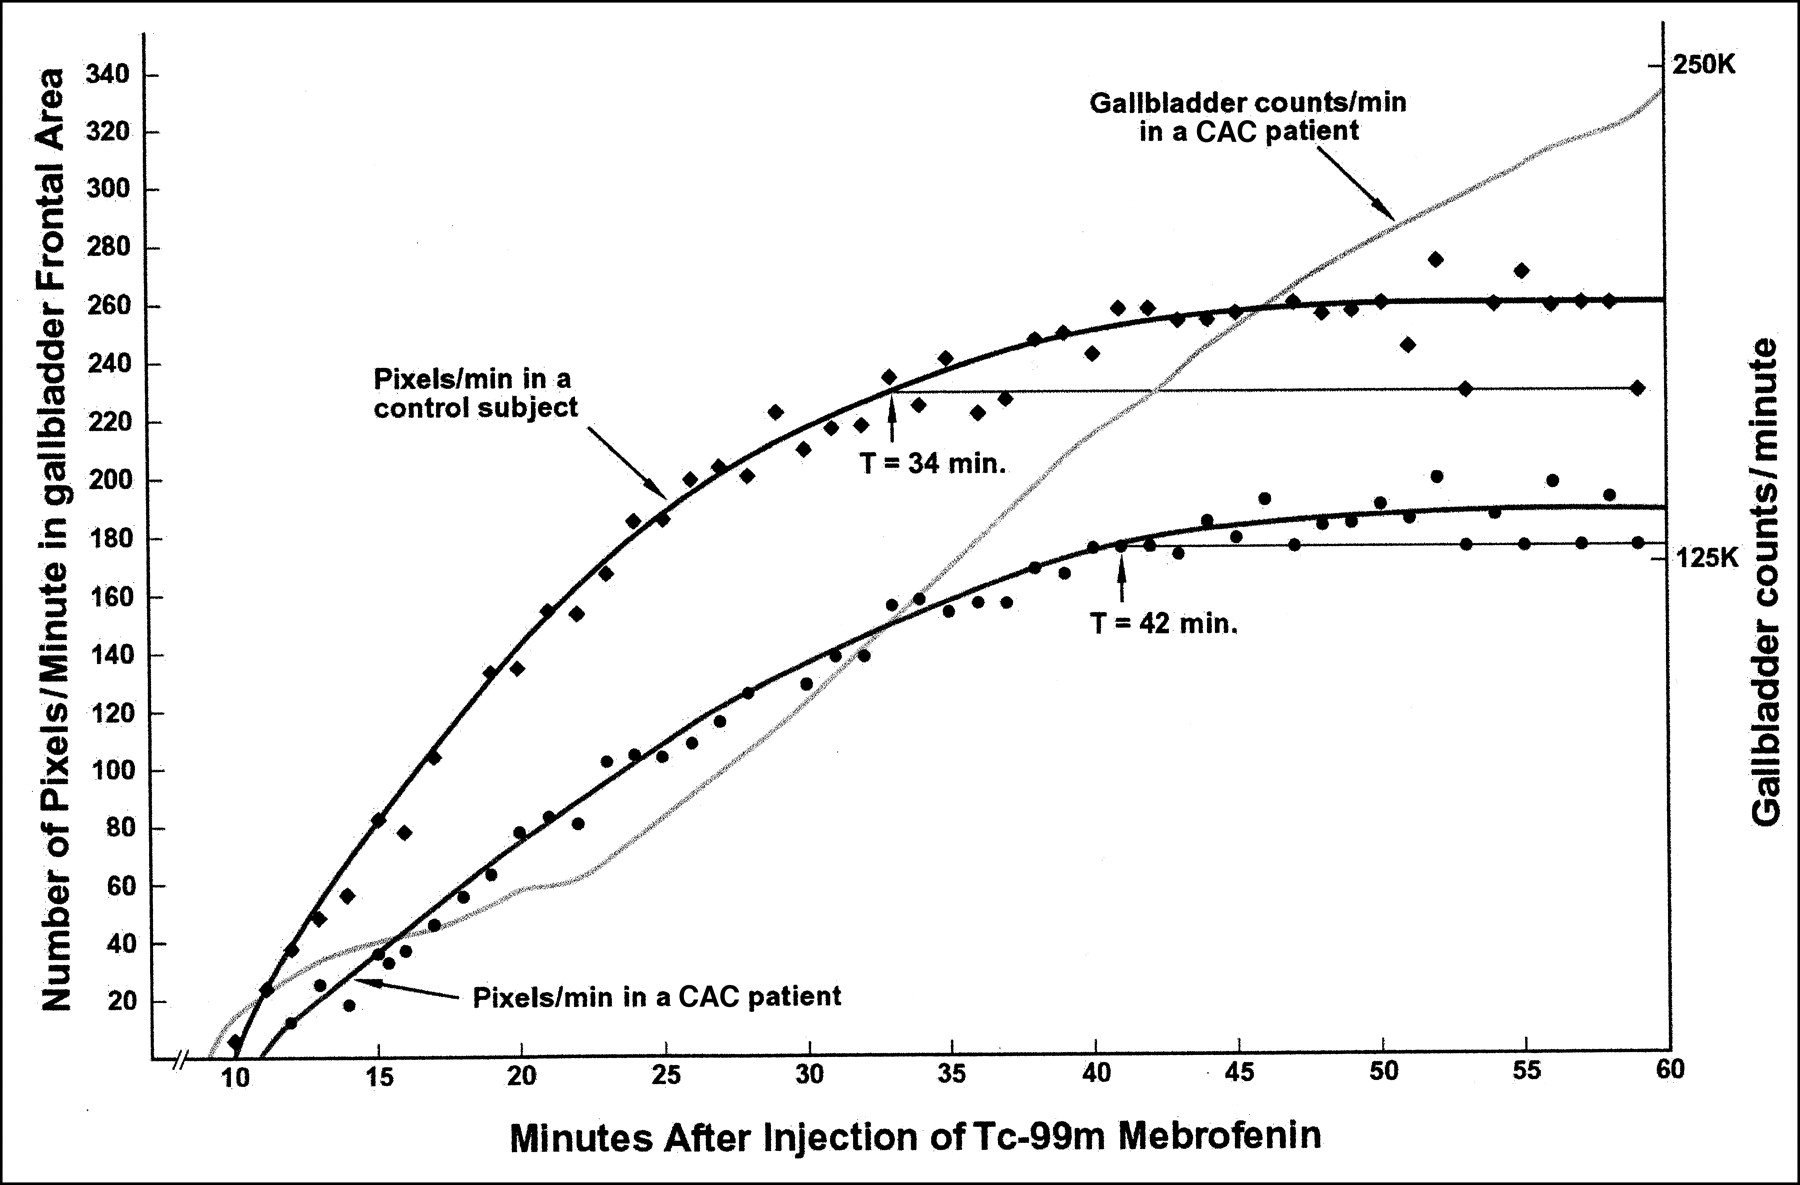
- FIGURE 2.
Hepatic bile entry pattern into gallbladder. x-Axis shows time in minutes after 99mTc-HIDA injection. y-Axis shows gallbladder area as number of pixels per minute on left and its volume as counts per minute on right. Gallbladder volume curve shows uninterrupted upslope (curve for control not shown to avoid crowding), indicating continuous bile entry during fasting. Transit time (T) is noted (arrow) at intersection of pixel-per-minute line and extrapolation line passing through lowest number of pixels between 50 and 60 min, by which time radiolabeled hepatic bile usually fills gallbladder to its full volume. Note that variation in gallbladder area (due to respiratory movement) beyond 45 min is not accompanied by any reduction in bile volume (counts per minute).
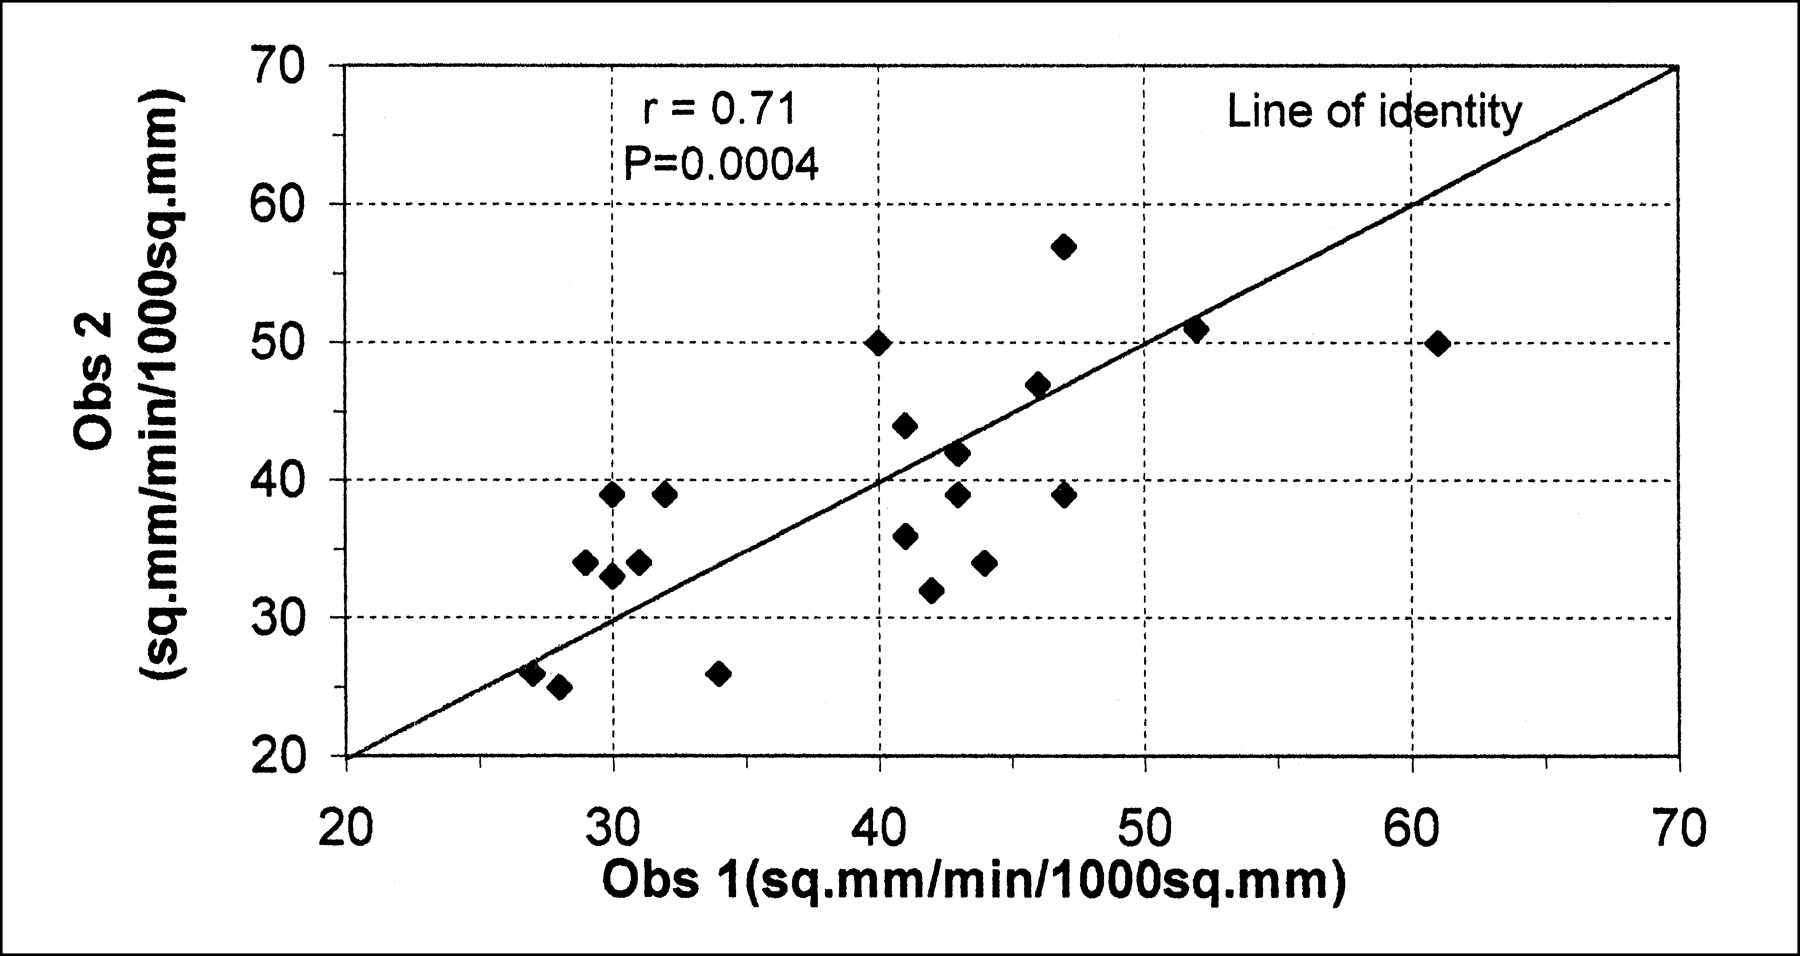
- FIGURE 3.
Reproducibility of bile transit rate measurement. Transit rate measured independently by 2 observers (Obs 1 and Obs 2) shows good correlation (r = 0.71; P = 0.0004).


Tables
- TABLE 1
Concentration and Contraction Functions of Gallbladder (GB) in Control Subjects and in Patients with CAC
No. Fl no. Age (y) Sex Wt. (kg) Hepatic bile flow GB appear. (min) IHB area (mm2) MHB area (mm2) Trans area (mm2) Trans time (min) Trans rate (mm2/min) mm2/min/1,000 mm2 GBEF (%) % GB % Inst. Obs 1 Obs 2 Control 1 202 42 F 104 92 8 15 164 2,606 2,442 23 106 43 39 40 2 209 29 F 115 96 4 10 55 2,551 2,496 23 108 43 42 37 3 216 57 F 71 94 6 15 54 1,357 1,303 28 47 34 26 51 4 224 44 F 83 55 45 12 99 1,445 1,346 20 67 47 39 41 5 226 93 F 60 77 23 16 139 1,654 1,515 20 76 46 47 65 6 230 53 F 80 60 40 14 131 1,894 1,763 32 55 29 34 75 7 241 50 F 91 44 56 13 164 1,390 1,226 20 61 44 34 43 8 262 37 F 100 57 43 12 197 1,905 1,708 33 52 27 26 79 9 273 65 M 77 48 52 15 77 1,062 985 31 32 30 33 89 10 311 47 F 72 83 17 27 164 1,128 964 21 46 41 44 38 Mean* 71 29 15 124 1,699 1,575 25 65 38 36 56 SD 20 20 5 50 542 540 5 25 8 7 20 CAC 1 45 58 M 86 42 58 11 115 1,656 1,541 18 86 52 51 2 2 51 65 F 62 87 13 17 115 1,451 1,336 15 89 61 50 14 3 57 46 F 67 49 51 26 207 2,168 1,961 30 65 30 39 29 4 58 29 M 109 25 75 11 55 1,883 1,828 24 76 40 50 24 5 65 44 F 136 68 32 26 99 1,533 1,434 20 71 47 57 10 6 68 46 F 68 90 10 15 88 1,818 1,730 23 75 41 36 16 7 83 22 F 95 66 34 14 54 1,428 1,374 30 46 32 39 17 8 116 50 F 67 20 80 16 77 602 525 31 17 28 25 20 9 132 38 F 80 48 52 14 100 1,664 1,554 24 65 42 32 21 10 138 38 F 63 98 2 12 120 1,905 1,785 30 60 31 34 14 Mean* 59 41 16 103 1,611 1,507 25 65 40 41 17 SD 27 27 6 43 422 402 6 21 11 10 8 P 0.3 0.3 0.58 0.32 0.68 0.75 0.81 1 0.64 0.23 0.00001 ↵* n = 10.
Fl no. = file number; Wt. = weight; IHB = initial hepatic bile; MHB = maximum hepatic bile; Trans = transit; GBEF = GB ejection fraction; Inst. = intestine; Obs = observer.
- TABLE 2
Hepatic Bile Transit Within Gallbladder Lumen in Control Subject and in Patient with CAC
Time after 99mTc-HIDA (min) 1 2 3 4 5 6 7 8 9 10 11 12 13 14 15 16 17 18 19 20 No. of pixels Control subject 209 — 0 0 0 0 0 0 0 0 0 5 24 38 49 57 81 79 106 120 133 CAC patient 138 0 0 0 0 0 0 0 0 0 0 0 11 24 18 35 36 44 54 61 Time after 99mTc-HIDA* (min) 21 22 23 24 25 26 27 28 29 30 31 32 33 34 35 36 37 38 39 40 No. of pixels* Control subject 209 135 154 152 167 184 186 198 204 199 221 199 213 216 233 224 238 220 225 246 248 CAC patient 138 78 81 80 101 107 105 109 115 126 130 128 137 138 155 155 151 155 162 154 168 Time after 99mTc-HIDA* (min) 41 42 43 44 45 46 47 48 49 50 51 52 53 54 55 56 57 58 59 60 No. of pixels* Control subject 209 240 255 255 251 251 253 259 252 252 258 242 273 233 256 269 255 257 258 237 267 CAC patient 138 166 172 174 171 182 179 190 174 180 182 189 182 199 174 184 179 194 179 190 180 ↵* Data are continuations of subsequent set of data.
Calculations for control subject 209:
Hepatic bile area = Number of pixels × pixel area.
Initial hepatic bile area = 5 × 10.95 = 55 mm2.
Maximum hepatic bile area = 233 × 10.95 = 2,551 mm2.
Net hepatic bile transit area = 2,551 − 55 = 2,496 mm2.
Hepatic bile transit time = 34 − 11 = 23 min.
Hepatic bile transit rate = 2,496/23 = 109 mm2/min.
Adjusted transit rate = 108 × 1,000/2,551 = 42 mm2/min/1,000 mm2.
Note that minimum number of hepatic bile pixels in frames between 51 and 60 min was 233 at 53 min. However, this low number was seen first at 34 min, indicating that gallbladder complete filling with radiolabeled hepatic bile occurred earlier at this time interval.


