


Abstract
The main objective of this study was to test the constancy and variability of gallbladder (GB) ejection fraction (EF) in long-term studies to (a) determine whether EF ever becomes normal once it is low, (b) determine how long it takes for the EF to become abnormal once it is found to be normal, (c) explore the cause of low EF, and (d) define objective parameters for biliary and nonbiliary abdominal pain. Methods: Fifty-two patients (42 women, 10 men) who underwent quantitative cholescintigraphy twice (total studies, 104), over a mean period of 38.54 mo between studies, were chosen for retrospective analysis. They were divided into the following groups: control (n = 13; nonbiliary abdominal pain), chronic acalculous cholecystitis (CAC) (n = 27; biliary abdominal pain), chronic calculous cholecystitis (CCC) (n = 6; biliary abdominal pain), and opioid (n = 6; nonbiliary abdominal pain). The last group had received an opioid before cholecystokinin-8 (CCK-8) infusion in one study but not in the other study. A GBEF value of ≥35% was considered normal with a 3-min infusion and ≥50% as normal with a 10-min infusion of CCK-8. Results: The mean GBEF value was reproducible between the 2 sequential studies in the control group (66.0% ± 20.5% vs. 73.9% ± 17.7%), CAC group (24.4% ± 22.3% vs. 16.9% ± 10.9%), and CCC group (20.8% ± 20.9% vs. 27.5% ± 34.5%) but not in the opioid group (14.8% ± 14.6% vs. 56.5% ± 31.7%). The severity of GBEF reduction in CAC increased with time: 7.2% ± 8.1% within 12 mo, 16.1% ± 14.9% in 13–47 mo, and 23.5% ± 21.3% in 48–168 mo. None of the 27 patients with CAC developed a gallstone as detected by ultrasound during the study period. In 5 patients with CAC, a mean period of 52.6 ± 28.9 mo was required for conversion from normal to a low EF. CCK-induced cystic duct spasm is the etiology for low EF in both CAC and CCC. Conclusion: Normal and low GBEF values are reproducible in long-term studies. Once the EF reaches a low value, it does not return to normal, and a normal value requires many years to become abnormal. CCK-induced cystic duct spasm is the cause of low GBEF in CAC and CCC, and the severity of EF reduction is similar for both. Exclusion of opioid intake immediately before the study is critical before attributing a low GBEF value to an irreversible GB motor dysfunction.
- gallbladder ejection fraction
- calculous cholecystitis
- acalculous cholecystitis
- opioids
- cholescintigraphy
- cholecystokinin
Gallbladder (GB) disease is one of the most common digestive system illnesses around the world and is a major source of economic drain in many nations. It affects about 20 million Americans, accounting for a total direct and indirect cost of 6.4 billion dollars in the year 2000 alone (1). Cholecystectomy is the most common therapy. Urgent cholecystectomy is preferred for acute and subacute cholecystitis, and elective cholecystectomy is preferred for chronic cholecystitis (2,3). Acute and subacute cholecystitis is characterized by obstruction of the cystic duct. Decreased emptying (low ejection fraction [EF]) is the main feature of both chronic calculus cholecystitis (CCC) and chronic acalculous cholecystitis (CAC). GB emptying has been shown to be reproducible in short-term studies (4,5), but whether the function remains normal over an extended period of time is unknown. For example, it is not known whether the GBEF ever becomes normal once it is found to be low or how long it takes for the GBEF to become low once it is shown to be normal. In addition, does a low EF value continue to decrease over time, paralleling the duration of symptoms? What and how much influence do opioids (received hours before the study) have on GBEF? Is there a significant pathophysiologic difference between CCC and CAC other than the mere presence or absence of gallstone, respectively? What causes low EF in CAC and CCC? Answers to such questions require application of a standardized technique applied over a long period of time in patients with suspected abdominal pain of biliary origin. We report here the results of such a study, which provides answers to most of these questions.
MATERIALS AND METHODS
Fifty-two patients (42 women, 10 men) who had undergone quantitative cholescintigraphy twice (total studies, 104) over an 18-y period at Tuality Community Hospital, Hillsboro, Oregon, were chosen for this retrospective analysis. Abdominal pain was the most common presenting symptom. Patients ranged in age from 29 to 84 y, with a mean age ± SD of 52.8 ± 15.1 y and a mean weight ± SD of 88.8 ± 26.7 kg. The time interval between 2 quantitative cholescintigraphic studies varied from 3 d to 15 y, with an average period of 38.54 mo (Table 1). Patient demographic data were entered into the database at the time of the first cholescintigraphic study and updated at the time of the second study. Age, weight, and ultrasound results in Table 1 reflect the data collected during the second study. The ultrasound study showed a normal GB in 44 patients and gallstones in 8. The final diagnosis was based on the findings at clinical presentation and the results of ultrasound, cholescintigraphy, and clinical follow-up. Thirteen patients with a low likelihood of liver and GB disease were chosen as the control, 27 had CAC (CAC group), 6 had CCC (CCC group), and 6 had received an opioid (opioid group) a few hours before cholecystokinin-8 (CCK-8) infusion in one of the studies (Table 2). In all 6 patients in the opioid group, opioid was given before CCK-8 infusion either for pain control or to establish cystic duct patency to exclude acute cholecystitis.
Demography, EFs, Time Interval Between EF-1 aand EF-2, Duration of CCK-8 Infusion, and Final Diagnosis in 52 Patients
GB Emptying Results in 4 Groups of Patients
Cholescintigraphy
Studies were performed 6–8 h after fasting with 111–185 MBq (3–5 mCi) of 99mTc-mebrofenin using a large-field-of-view γ-camera fitted with a low-energy, parallel-hole collimator. Anterior view hepatic phase images were obtained serially for 60 min, and GB phase images for an additional 30 min, for a total duration of 90 min as described elsewhere (6). Both phase images were acquired separately and recorded on a 128 × 128 × 16 computer matrix. In the studies obtained before March 2002, each patient received CCK-8 at 3.3 ng/kg/min for 3 min, and in the studies obtained after March 2002, the CCK-8 dose was 3 ng/kg/min for 10 min, as described (7,8). CCK-8, sincalide (Kinevac; Bracco Laboratories, Inc.), infusion was begun at 3 min into the GB phase and continued at a constant rate through an infusion pump. Forty patients received a 3-min CCK-8 infusion on both occasions. Ten patients received a 3-min infusion during the first study and a 10-min infusion during the second study. Two patients received a 10-min CCK-8 infusion on both occasions (Table 1).
Data Analysis
GBEF was calculated using a custom-designed hepatobiliary software (KHBQuant) as described elsewhere (6). A GBEF value of <35% was considered as abnormal GB function with a 3-min CCK-8 infusion, and a value of <50% was considered as abnormal with a 10-min infusion of CCK-8 (7–9). When the EF was low due to opioid intake, a repeated study without an opioid was obtained. Patients who had normal 99mTc cholescintigraphy and no other hepatobiliary abnormalities found on later follow-up were considered as the control group. Patients with a low EF and gallstone at ultrasound were assigned to CCC, and patients with low EF but without gallstone were assigned to CAC. Abdominal pain in association with a low GBEF was considered as biliary in origin, and pain with normal GBEF was considered as nonbiliary in origin. Twenty-one of 27 CAC patients had cholecystectomy soon after measurement of EF-2. Another 6 CAC patients could not be contacted. Table 1 shows the patient demography, GBEF, time interval between the first and second cholescintigraphy, difference in EF between the 2 studies, duration of CCK-8 infusion, and final diagnosis. EF-1 was plotted on the x-axis and EF-2 on the y-axis for the control, CAC, and CCC groups to determine the correlation between EF-1 and EF-2 (Fig. 1). Mean values among the patient groups were tested with the Student t test and values within the group with a paired t test. P values for the t testing is denoted by Pt. Since some of the data did not meet the full criteria for t test applicability (normality of the sample and equal variance), the various GBEFs were also tested with nonparametric tests: the Wilcoxon signed rank test as the alternative to the paired t test, and the Mann–Whitney rank sum test as the alternative to the independent t test. P values for the nonparametric testing of GBEF are denoted by Pnp.
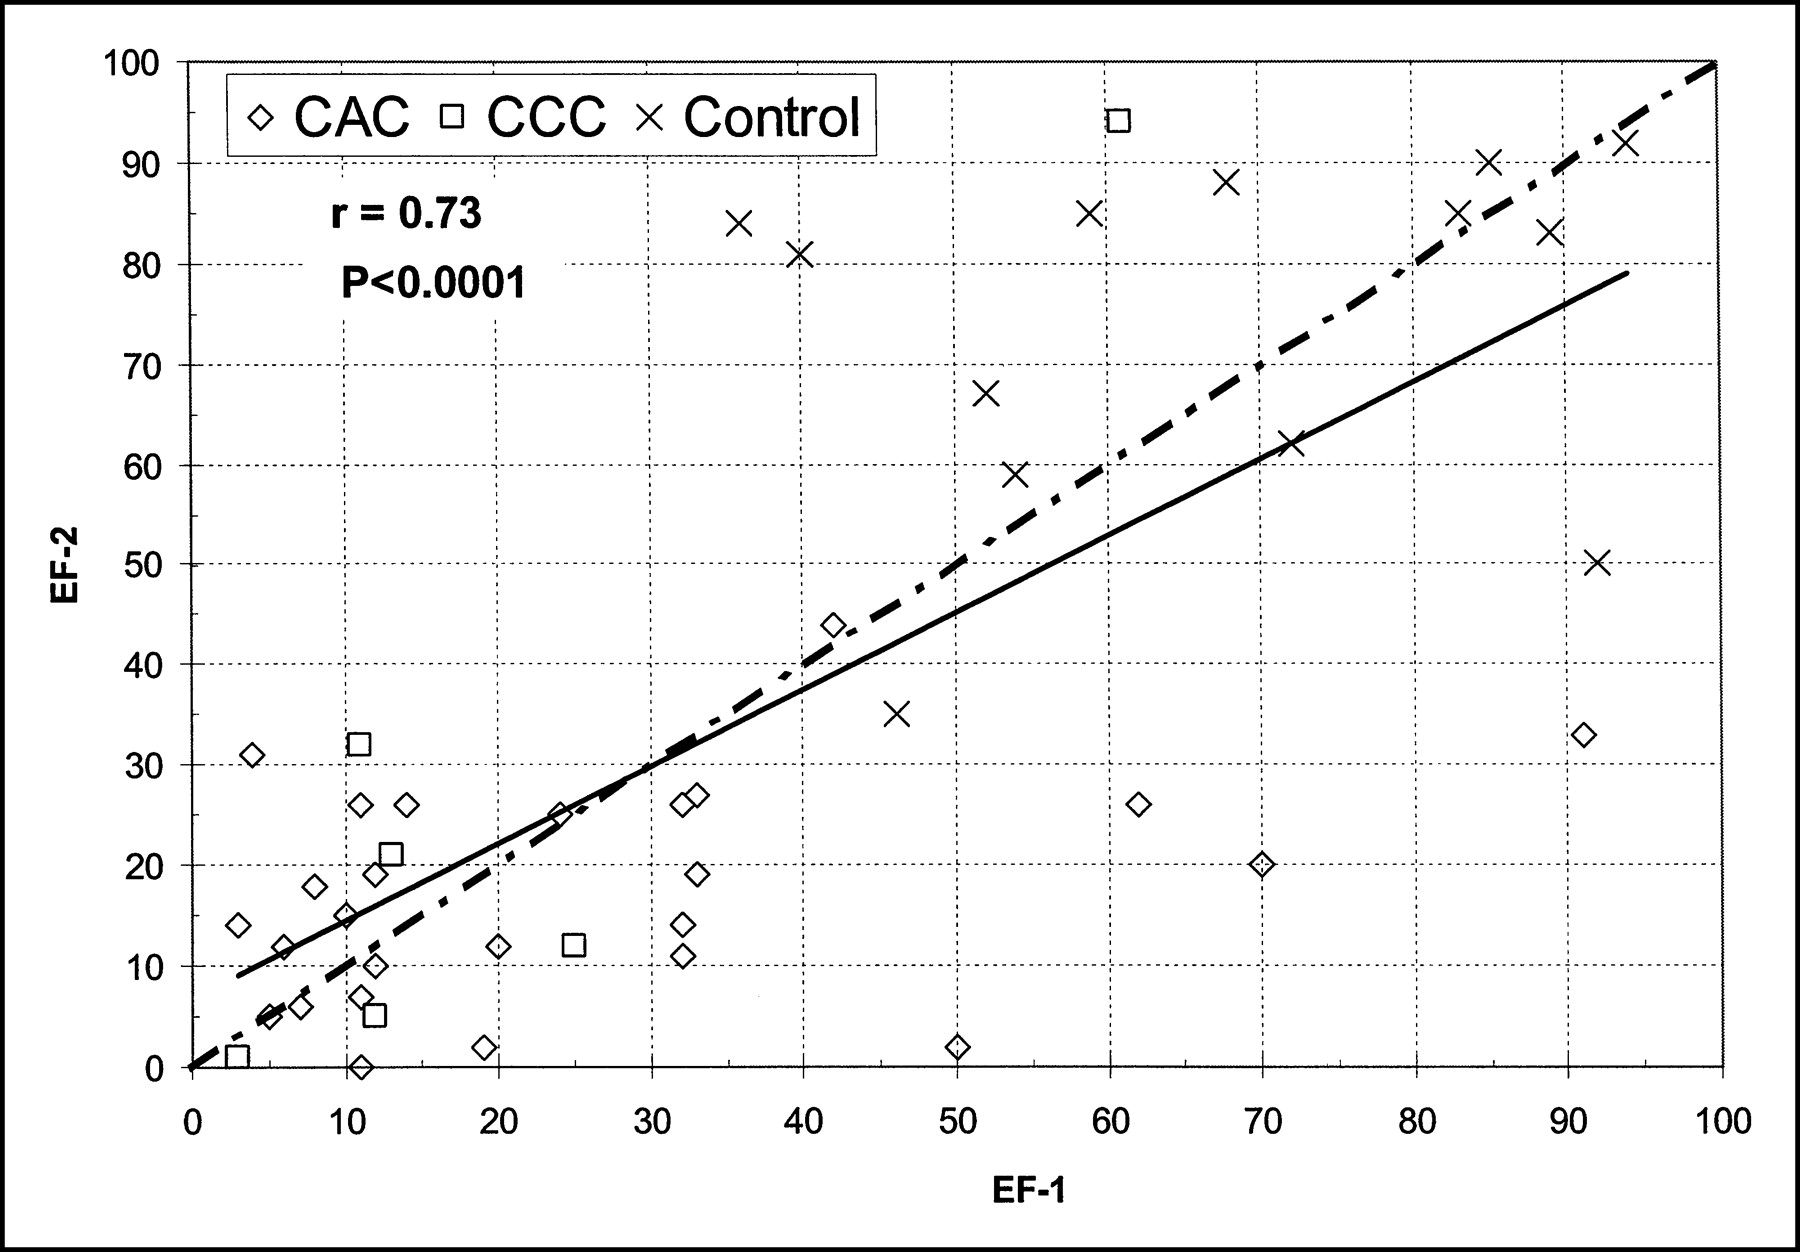
Correlation between EF-1 and EF-2 in control subjects and patients with CAC and CCC (opioid group excluded). Note good correlation between 2 EFs, with r = 0.73 (P < 0.0001). Solid line shows regression; dashed line shows line of identity.
RESULTS
Reproducibility of GBEF
In control, CAC, and CCC groups, Figure 1 shows that the EF value was reproducible, with a correlation coefficient r = 0.73 (P < 0.0001).
Comparisons of GBEFs
Figure 2 shows the mean ± SD for the first (EF-1) and second (EF-2) GBEFs for 3 subject groups. The mean values within groups were not significantly different from each other (P > 0.05).

Mean ± SD for first (EF-1) and second (EF-2) GBEF in control, CAC, and CCC groups. EF-1 and EF-2 values are not significantly different within groups (P > 0.05) but are significantly low in CAC (P < 0.0001) and CCC (P < 0.0003) when compared with control subjects.
Control Group
The control group consisted of 13 patients (10 women, 3 men). Eight patients received a 3-min CCK-8 infusion on both occasions, 4 received a 3-min infusion during the first study and a 10-min infusion during the second study, and 1 patient received a 10-min infusion on both occasions (Table 1). Figure 2 shows the GB mean ± SD, EF-1, of 66.9% ± 20.5% during the first study, and EF-2 of 73.9% ± 17.7% during the second study, which were not significantly different (Pt = 0.31, Pnp = 0.34). The time interval between the 2 studies ranged from 1 to 177 mo, with a mean of 45.7 ± 57.2 mo (Table 2).
CAC Group
The CAC group consisted of 27 patients (23 women, 4 men). Twenty patients received a 3-min CCK-8 infusion on both occasions, 6 received a 3-min infusion during the first study and a 10-min infusion during the second study, and one received a 10-min infusion on both occasions. The mean EF-1 of 24.4% ± 22.3% during the first study and the mean EF-2 of 16.9% ± 10.9% during the second study were not significantly different from each other (Fig. 2; Pt = 0.066, Pnp = 0.14), but both the first and second GBEFs in CAC patients were significantly lower than those in the control group (Fig. 2; both EF-1 and EF-2 Pt values < 0.0001, and both Pnp values < 0.0001). The mean interval between the 2 studies was 37.5 ± 46.1 mo and ranged from 10 d to 168 mo. Five of the patients who had a normal EF during the first study showed a low EF at the time of the second study.
Effect of Time on GBEF Reduction
In the 27 patients with CAC, the mean reduction in GBEF was 7.82% ± 8.1% when the time interval between 2 studies was <12 mo, 16.1% ± 14.9% between 13 and 47 mo, and 23.5% ± 21.3% between 48 and 168 mo, indicating the severity of GBEF reduction as time passes. All of the 21 of 27 CAC patients contacted stated that they had laparoscopic cholecystectomy soon after confirmation of the low EF-2 in the second study.
CCC Group
The CCC group consisted of 6 patients (4 women, 2 men). All 6 patients in this group received a 3-min CCK-8 infusion on both occasions. The mean EF-1 of 20.8% ± 20.9% during the first study and EF-2 of 27.5% ± 34.5% during the second study were not significantly different (Pt = 0.40, Pnp = 0.56) from each other, but both EF-1 and EF-2 in CCC patients were significantly lower than those in control subjects (Fig. 2; Pt = 0.0003 and Pnp = 0.0044 for EF-1; Pt = 0.0011 and Pnp = 0.025 for EF-2). The mean interval between the 2 studies was 26.52 ± 29.46 mo (Table 2). One patient had a normal GBEF on both occasions: 61% on the first and 94% on the second occasion (patient 32, Table 1). There was no significant difference in the mean GBEF values between CCC and CAC groups (Fig. 2; Pt = 0.72 and Pnp = 0.83 for EF1; Pt = 0.18 and Pnp = 0.87 for EF-2).
Opioid Group
The opioid group consisted of 6 patients (5 women, 1 man). Five patients received a 3-min CCK-8 infusion on both occasions, and one received a 3-min infusion during first study and a 10-min infusion during the second study. Five patients with a low EF during the first study (with prior opioid) had a normal EF during the second study (without prior opioid). The sixth patient who had a normal EF in the first study (without prior opioid) showed a low EF during the second study (with prior opioid). The mean EF for the group was 14.8% ± 14.6% with prior opioid and 56.5% ± 31.7% without prior opioid, indicating reversibility of GB function without an opioid. The mean interval between the 2 studies was 39.8 ± 54.02 mo (Table 2).
Conversion from Control to CAC
Five subjects with a normal GBEF (mean, 63.0% ± 19.0%) during the first study showed a low EF (31.2% ± 8.98%) during the second study done after a mean interval of 52.6 ± 28.89 mo (range, 24–98 mo) (Table 3).
Time Taken to Convert from Normal to Low EF in 5 Patients
DISCUSSION
In the United States, >750,000 cholecystectomies are performed annually for a variety of GB diseases (1). Abdominal pain is the most common presenting symptom and gallstones are the most frequent pathologic findings. Gallstones are readily detected with ultrasound, but many stones are innocent bystanders with no relation to abdominal pain (10). Their detection with ultrasound, therefore, does not establish that gallstones are the primary cause of abdominal pain. Currently there are no well-established objective parameters to separate biliary from nonbiliary abdominal pain in patients with gallstones. Other than the macroscopic presence or absence of gallstones, the microscopic changes seen on histopathology tend to be similar in both CAC and CCC.
Our results now show that reduction in the GBEF is common factor for both CAC and CCC, indicating similar functional changes. In studies repeated after many months or years, EF is reproducible in control subjects and in patients with CAC and CCC (Fig. 1; Table 2). Once the EF is low, the GB does not show any functional recovery in either CAC or CCC. Functional recovery occurred only in those who had received an opioid before the study. All 6 patients who had received an opioid before the study had a low EF but showed a normal EF when the study was repeated without an opioid (Table 2). This indicates the importance of taking a careful history of any opioid intake in all patients with a low EF before assigning an irreversible GB function abnormality. We recommend that patients not take any opioid for at least 24 h before cholescintigraphy. Opioid restriction, however, does not apply for those patients with a clinical suspicion of acute or subacute cholecystitis, who usually have an obstruction of the cystic duct.
Our results shed some insights into our understanding of the pathophysiology of CAC and CCC and help distinguish abdominal pain of biliary origin from nonbiliary origin. Basal hepatic bile entry into the GB remains normal in patients with CAC, but emptying is reduced (11). Reduction in EF promotes bile stasis in both CAC and CCC. Since the GB filling is normal, biliary pain in these patients can be attributed to GB wall stretching against impedance to bile flow through the cystic duct when stimulated with CCK (12). We consider abdominal pain as biliary in origin in those with a low EF, irrespective of the presence or absence of gallstones. Pain is considered as nonbiliary in those with a normal GBEF, despite gallstones. Abdominal pain in patients with a normal GBEF indicates its extrabiliary origin from organs such as small intestine, colon, pancreas, and so forth, which also respond to the hormone CCK (13). In many patients with a normal GBEF and abdominal pain, we have often observed rapid bile transit through the small and large bowel (unpublished data, 2004) due to increased peristalsis induced by CCK-8. We believe that low GBEF is an objective and an easily reproducible functional parameter for biliary pain, as the pain is relieved with cholecystectomy in 89% of patients with CAC (7). Similar results have been found in patients with CCC (3,14).
Of nearly 400 annual cholecystectomies performed at our hospital, about one third are attributed to CAC and two thirds are attributed to CCC. Despite low GBEF during the first study, none of 27 patients with CAC was subjected to cholecystectomy versus only 5 patients with CCC. Physicians feel comfortable in recommending cholecystectomy soon after detection of gallstones (CCC) with ultrasound (15), but they seem to hesitate to recommend it for CAC patients. Many patients with normal ultrasound findings often are not subjected to quantitative cholescintigraphy because of its unfamiliarity with some physicians. This attitude is changing gradually due to the excellent results obtained with cholecystectomy for CAC. More physicians at our hospital now request quantitative cholescintigraphy for patients with suspected abdominal pain of biliary origin, with or without gallstones, and patients are subjected to cholecystectomy as soon as the diagnosis is confirmed with low EF.
Because of no morphologic abnormality (gallstone), some may consider CAC as a less severe form of disease than CCC, but the facts are contrary to this notion. Reduction in the GBEF was as low in CAC as with CCC (Table 2). In the first study, the mean GBEF of 24.4% ± 22.3% in CAC patients was not significantly different (P = 0.072) from a mean EF-1 of 20.8% ± 20.9% in CCC patients. Furthermore, functional abnormality in CAC continues to get worse as time passes. The mean reduction in EF was 7.18% during the first 12 mo, 16.12% between 13 and 47 mo, and 23.5% between 48 and 168 mo, indicating further deterioration in GB motor function with time. Yet, CAC patients do not receive early therapy, suffer from abdominal pain for many months or years, and undergo a greater number of other diagnostic tests, often invasive, than those with CCC. In general, CAC patients undergo more gastroscopy (74% vs.17%), esophageal pH measurement (43% vs. 6%), and esophageal manometry (43% vs. 6%) than patients with CCC (14).
Basal GB bile entry is normal in patients with CAC, indicating normal absorption of water and electrolytes (concentration function) through the epithelium (11,16). Bile stasis in these patients, therefore, is secondary to poor emptying due to cystic duct spasm on exposure to CCK. CCK A receptors in the cystic duct normally maintain a much higher threshold for contraction than the receptors in the GB body and fundus. Therefore, the cystic duct does not contract (or go into spasm) when exposed to a physiologic level of CCK-8 (11). Yet, for some yet unknown reason, cystic duct CCK receptors in patients with CAC and CCC lower their threshold and contract (spasm) in response to a physiologic level of CCK-8. Spasm of the cystic duct impedes bile exit from the GB, initiating biliary pain (11,17). Since spasm is the cause of low EF in both conditions, we recommend replacing CCC and CAC terminologies with cystic duct spasm. New terminology would indicate the true pathology accurately and eliminate the wrong connotation of cholecystitis, meaning infection of the GB.
Despite that fact that gallstones and bile stasis often coexist, many patients with stasis do not form gallstones. None of our 27 patients with CAC (Table 1) formed gallstones, as detected by ultrasound during a mean follow-up period of 37.5 mo, indicating that factors other than bile stasis (lithogenic bile) or a duration of >3–4 y are required (e.g., lithogenic bile) in some patients to form gallstones (18).
Our results also show that a normal GB takes many years to become abnormal. Five of 17 (29%) patients, who had normal emptying during the first study, had a mean duration 52.6 mo before a low GBEF was evident. The minimum time interval was 24 mo (Table 3). One of 6 patients with CCC has maintained a normal EF (61% and 94%, subject 32 in Table 1) for >35 mo. Cholecystectomy is recommended for those with symptomatic gallstones (low GBEF) and an expectant observation for those with asymptomatic (normal EF) gallstones (19).
As the reliance for cholecystectomy shifts from morphology to functional imaging, it is critical to maintain a high standard of the technique used to measure GBEF. Since the GBEF is variable—depending on the dose, dose rate, and duration of infusion of CCK-8—it is important to establish a local normal value using a standard protocol or adopt the technique from a peer-reviewed published method (20,21). Normal values were reestablished when we switched from 3- to 10-min CCK-8 infusion, and we use ≥35% as the normal GBEF for a 3-min infusion and ≥50% for a 10-min CCK-8 infusion (6–9). The package insert that accompanies the Kinevac kit recommends using 0.02 μg (20 ng)/kg or 0.04 μg (40 ng)/kg CCK-8 given intravenously in 30–60 s. This dose rate established in early 1970s using the oral cholecystogram is too high and nonphysiologic for cholescintigraphy, often causes abdominal pain and low EF in 26% of healthy subjects, and should be avoided (21). Once the appropriate dose rate is chosen, the duration of infusion is a personal preference. Varieties of protocol have been suggested, some advocating continuous CCK-8 infusion for 30, 45, or 60 min (22). A 30-min GB phase data collection (for cholescintigraphy, 90 min total) is preferred by both patients and technologists and is of sufficient duration to generate all of the important parameters necessary for diagnosis. The GB phase data collection should continue for 15–20 min after termination of CCK-8 infusion to detect CCK-8–induced paradoxical filling, which occurs in patients with sphincter of Oddi spasm. Paradoxical filling usually occurs after the end of the ejection period and is likely to be missed if sufficient time is not allowed for bile entry into the GB in sphincter of Oddi spasm (23).
CONCLUSION
Both normal and low EFs are reproducible in long-term studies. Once low, the GBEF does not return to normal and continues to decrease further in CAC patients in parallel with the duration of symptoms. CCK-induced spasm of the cystic duct is the cause of low EF in both CAC and CCC. Exclusion of opioid intake before the study is important before assigning irreversible GB motor dysfunction.
Footnotes
Received Feb. 26, 2004; revision accepted May 28, 2004.
For correspondence or reprints contact: Gerbail T. Krishnamurthy, MD, Department of Nuclear Medicine, Tuality Community Hospital, 335 S.E. 8th Ave., Hillsboro, OR 97123.
E-mail: GTKrishna{at}aol.com


