


Article Figures & Data
Figures
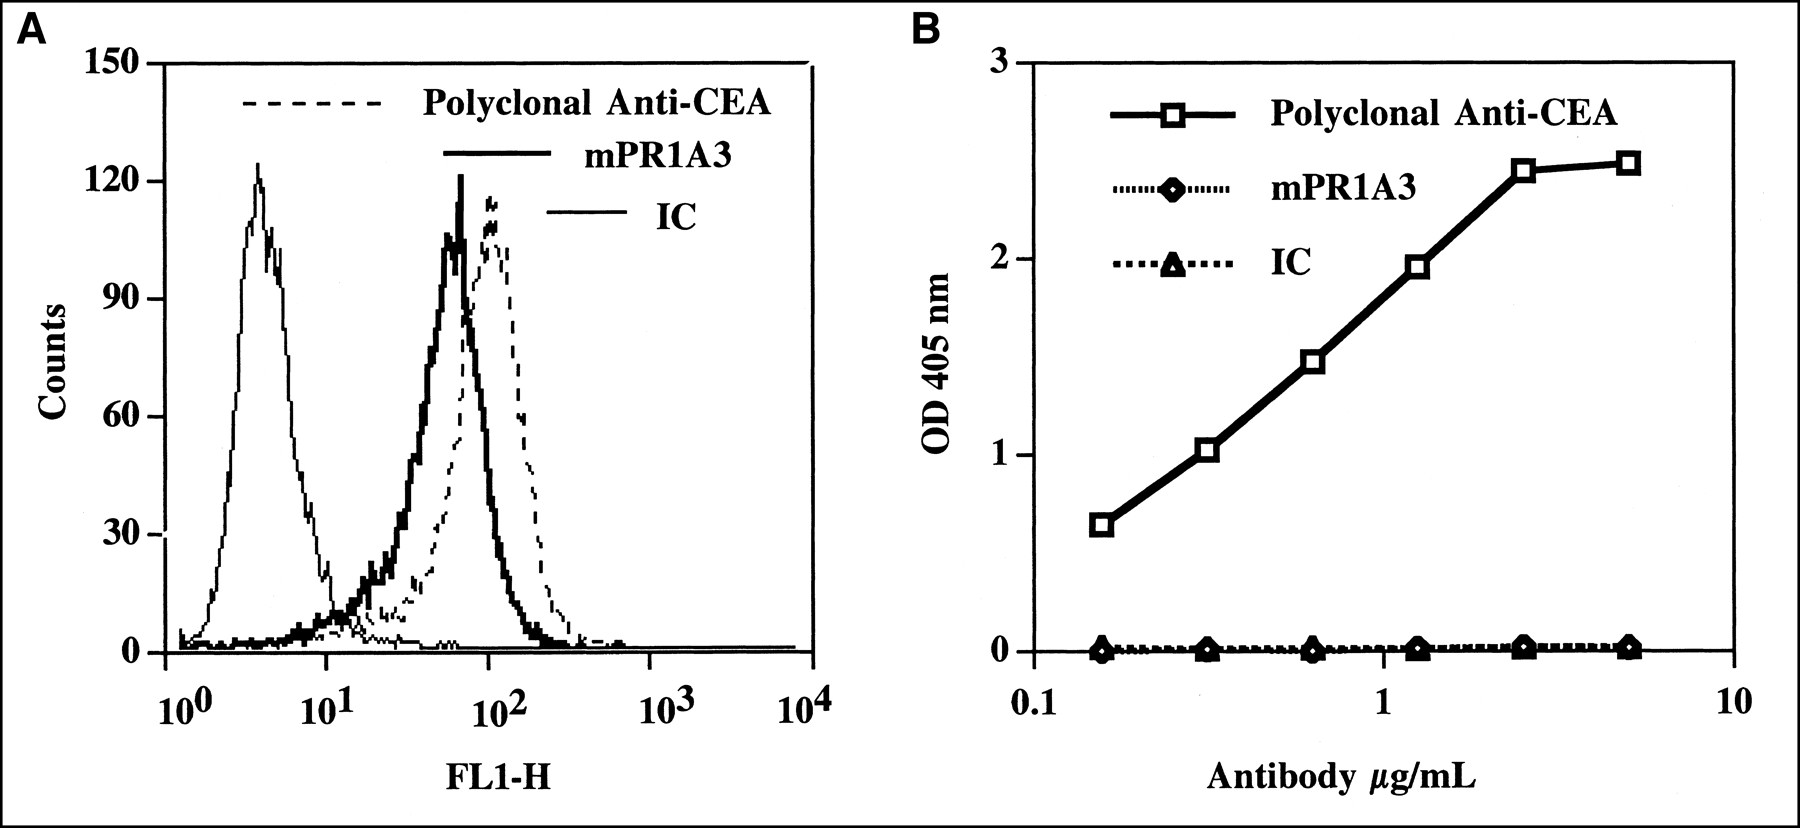
- FIGURE 1.
mPR1A3 binding to human CEA. (A) mPR1A3 binding to cell-surface CEA was determined by flow cytometry. C15 cells were stained with either mPR1A3, anti-CEA polyclonal serum, or IC mAb. (B) mPR1A3 binding to soluble CEA was determined by ELISA.
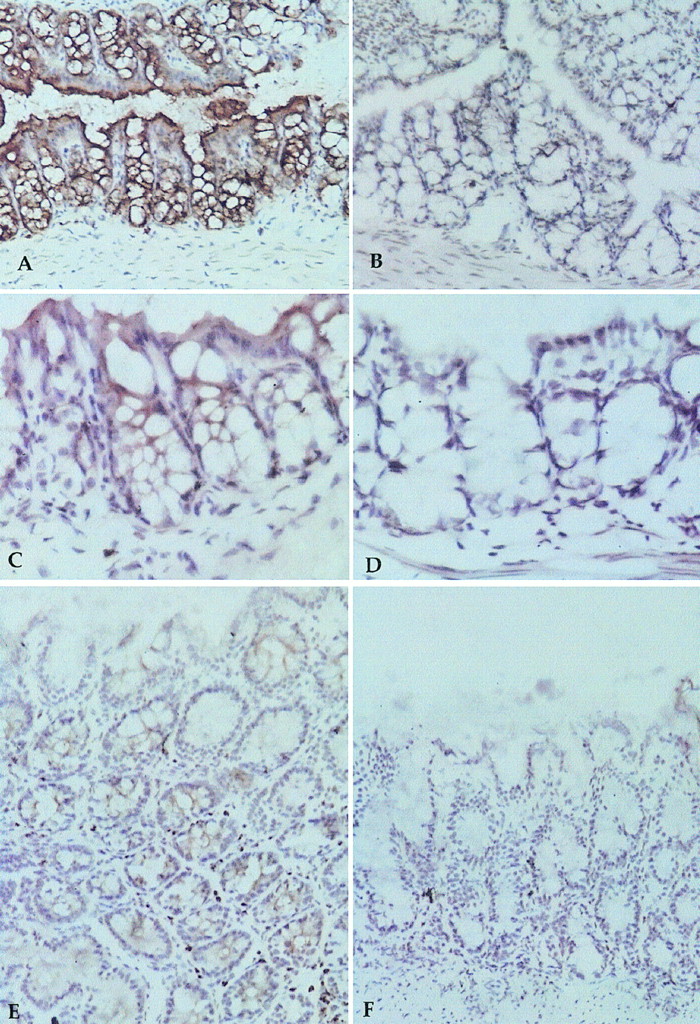
- FIGURE 2.
Human CEA expression in CEA.Tg mouse, shown by immunoperoxidase staining of gastrointestinal tract. Anti-CEA antisera stained CEA.Tg colon (A) and wild-type colon (B); hPR1A3 stained CEA.Tg colon (C) and wild-type colon (D); and hPR1A3 stained CEA.Tg cecum (E) and wild-type cecum (F).
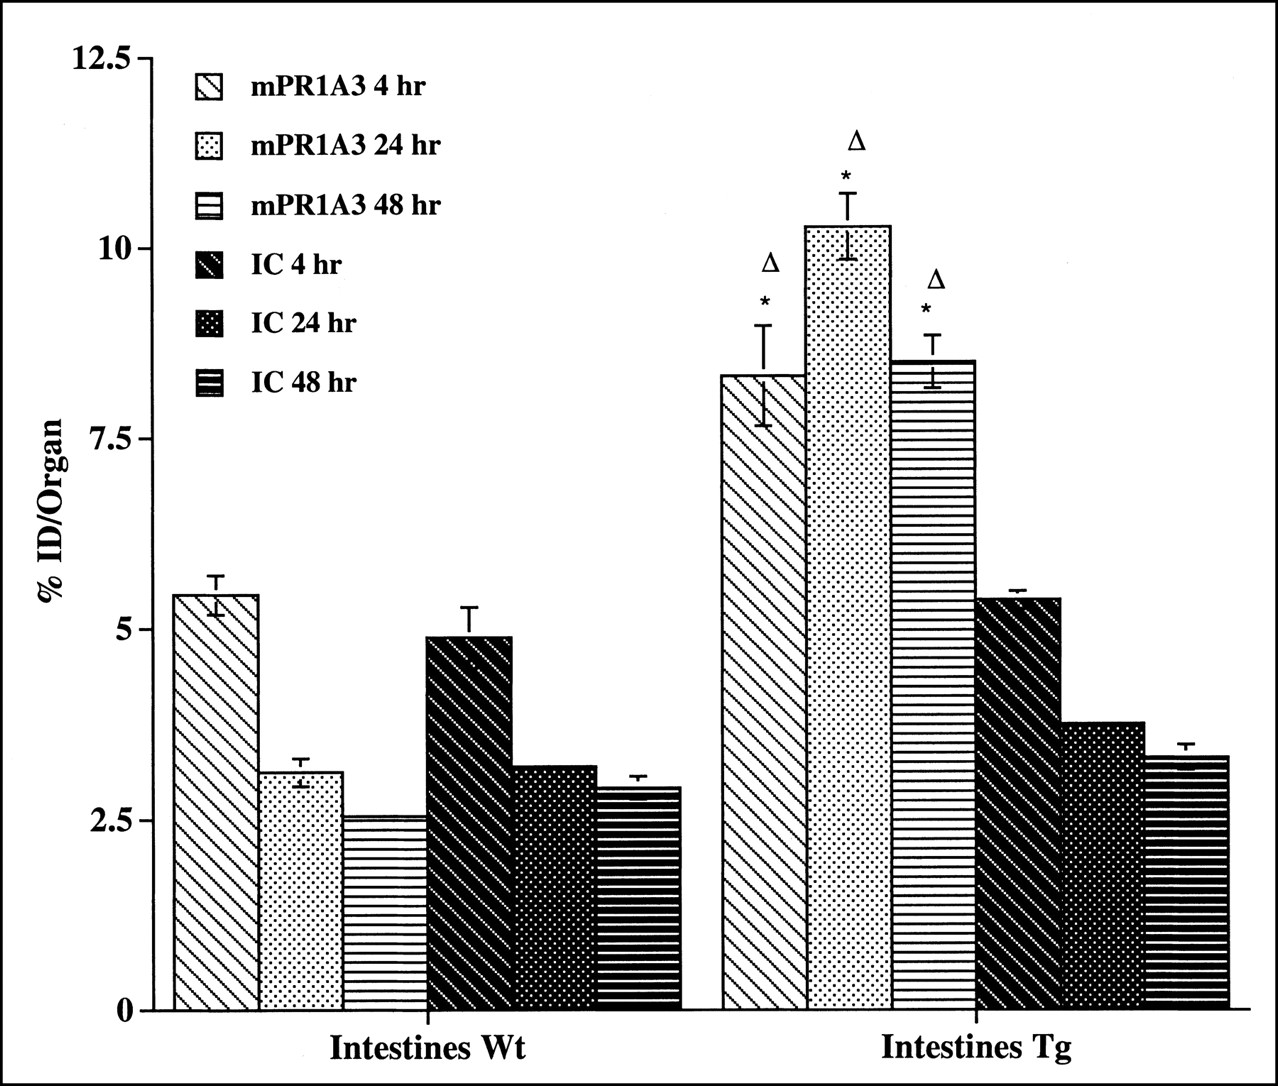
- FIGURE 3.
mPR1A3 binding to intestine of CEA.Tg (Tg) mice and wild-type (Wt) littermates. Mean %ID per organ and SEs are shown. Results are representative of 3 separate experiments. *Statistically significant difference (P < 0.05) between uptake of mPR1A3 in transgenic and wild-type animals. ▵Statistically significant difference (P < 0.05) between mPR1A3 and IC uptake in transgenic animals.
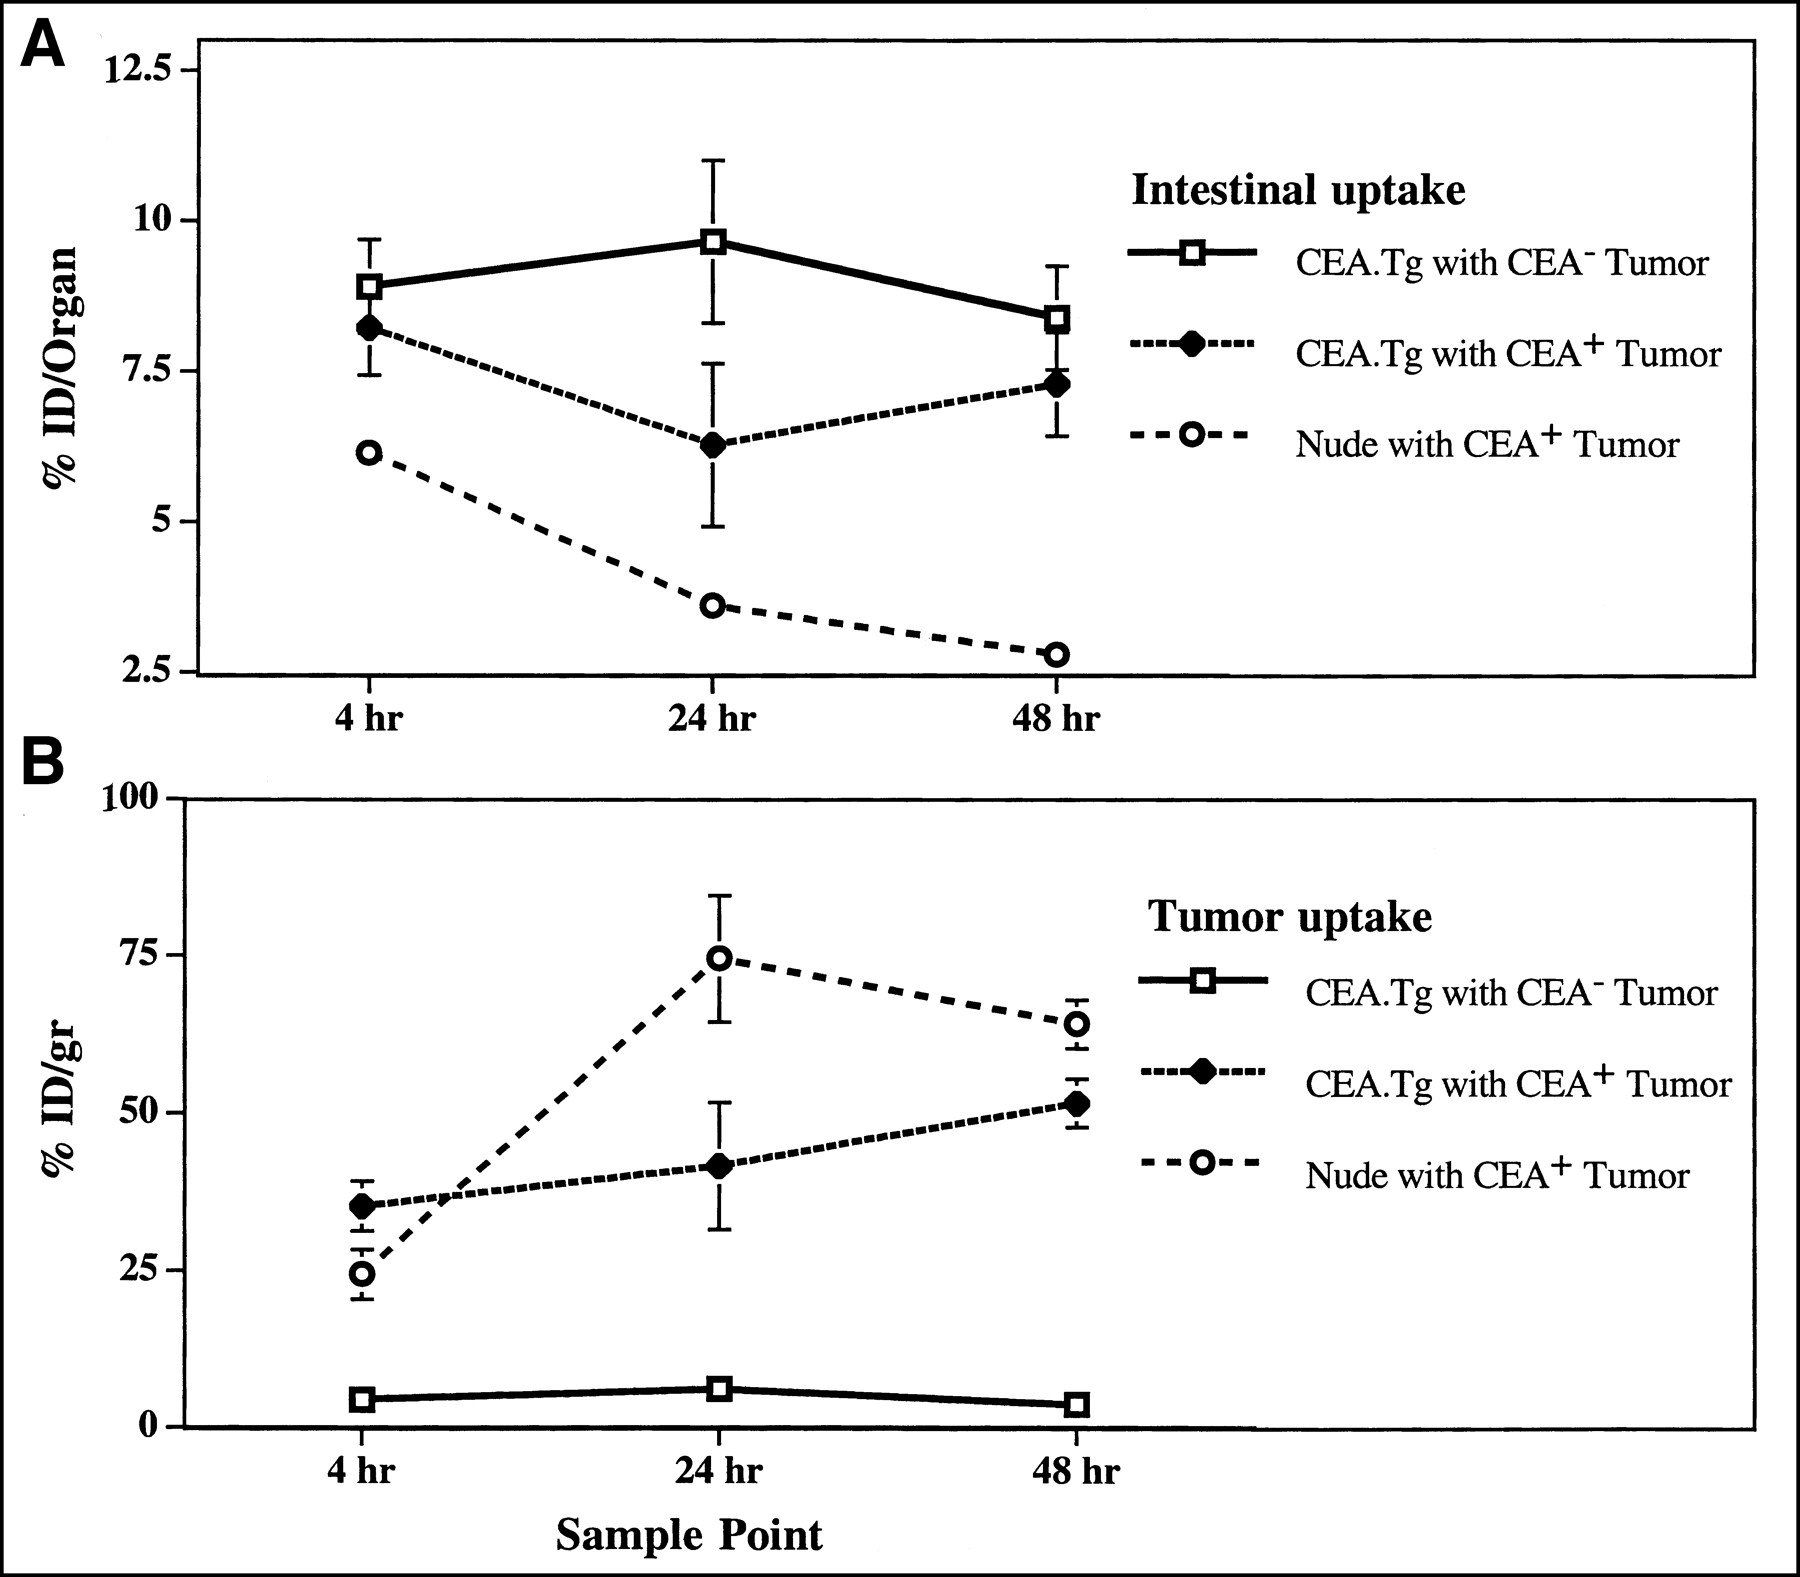
- FIGURE 4.
Comparisons of mPR1A3 uptake in tumor-bearing CEA.Tg and nude mice, including %ID in intestines of tumor-bearing mice (A) and %ID/g in tumor from same mice (B). Groups contained 4 mice, and SEs for mean %ID values are shown. Results are representative of 2 separate experiments.

Tables
Tissue mPR1A3 IC 4 h 24 h 48 h 4 h 24 h 48 h %ID per organ* Spleen 0.41 ± 0.07 0.28 ± 0.04 0.22 ± 0.02 0.38 ± 0.11 0.30 ± 0.02 0.25 ± 0.03 Kidney 1.43 ± 0.24 1.05 ± 0.09 0.81 ± 0.07 1.43 ± 0.18 1.08 ± 0.02 1.00 ± 0.13 Intestines 5.44 ± 0.51 3.11 ± 0.36 2.54 ± 0.14 4.88 ± 0.80 3.18 ± 0.05 2.91 ± 0.29 Stomach 1.37 ± 0.24 0.42 ± 0.06 0.36 ± 0.04 1.01 ± 0.26 0.59 ± 0.16 0.43 ± 0.04 Liver 6.98 ± 0.96 4.80 ± 0.69 3.81 ± 0.40 6.19 ± 0.72 4.45 ± 0.34 4.13 ± 0.54 %ID/g* Blood 24.73 ± 5.03 14.55 ± 1.33 13.21 ± 1.38 26.43 ± 6.49 15.16 ± 2.14 14.41 ± 2.26 Muscle 1.40 ± 1.21 0.93 ± 0.22 0.94 ± 0.12 0.65 ± 0.13 0.74 ± 0.47 1.17 ± 0.26 Bone 1.76 ± 0.37 1.49 ± 0.79 1.26 ± 0.07 1.30 ± 0.22 1.41 ± 0.25 1.38 ± 0.17 ↵* Mean (n = 4) ± SD.
There were no statistically significant differences in tissue distribution of the 2 antibodies.
Tissue mPR1A3 IC 4 h 24 h 48 h 4 h 24 h 48 h %ID per organ* Spleen 0.45 ± 0.08 0.30 ± 0.05 0.18 ± 0.03 0.42 ± 0.05 0.36 ± 0.04 0.28 ± 0.02 Kidney 1.46 ± 0.31 0.84 ± 0.10† 0.75 ± 0.13 1.59 ± 0.15 1.23 ± 0.10 1.06 ± 0.20 Intestines 8.31 ± 1.31† 10.27 ± 0.86† 8.49 ± 0.68† 5.37 ± 0.24 3.74 ± 0.18 3.30 ± 0.33 Stomach 0.88 ± 0.15 0.90 ± 0.12† 0.72 ± 0.08† 0.77 ± 0.08 0.63 ± 0.10 0.48 ± 0.13 Liver 6.99 ± 0.91 3.97 ± 0.22† 2.81 ± 0.33 7.69 ± 0.77 5.79 ± 0.34 4.51 ± 0.49 %ID/g* Blood 25.41 ± 2.66 17.33 ± 1.95† 11.80 ± 2.86 26.66 ± 3.47 21.31 ± 2.00 16.20 ± 1.70 Muscle 1.03 ± 0.12 1.16 ± 0.16 0.93 ± 0.05 0.81 ± 0.15 1.22 ± 0.08 1.13 ± 0.12 Bone 1.67 ± 0.29 1.50 ± 0.06† 1.20 ± 0.19 1.66 ± 0.03 1.71 ± 0.10 1.49 ± 0.26 - TABLE 3
Biodistribution of 125I-Radiolabeled mAbs in CEA Transgenic Mice Bearing CEA-Transfected Tumors
Tissue mPR1A3 IC 4 h 24 h 48 h 4 h 24 h 48 h %ID per organ* Spleen 0.43 ± 0.08 0.21 ± 0.03 0.16 ± 0.06 0.55 ± 0.15 0.61 ± 0.73 0.29 ± 0.14 Kidney 1.42 ± 0.30 0.74 ± 0.15 0.58 ± 0.18 1.78 ± 0.26 1.15 ± 0.44 1.05 ± 0.38 Intestines 8.22 ± 1.56 7.74 ± 2.11† 6.59 ± 1.57† 6.04 ± 1.25 3.70 ± 1.27 2.99 ± 1.19 Stomach 1.34 ± 0.24 0.80 ± 0.17 0.54 ± 0.07 2.28 ± 0.64 1.16 ± 0.35 0.92 ± 0.31 Liver 9.49 ± 0.92 4.33 ± 2.21 2.55 ± 0.72 8.97 ± 1.59 4.54 ± 1.66 4.29 ± 1.85 %ID/g* Blood 28.87 ± 5.57 12.07 ± 2.25 10.25 ± 2.04 34.82 ± 7.13 21.04 ± 11.45 19.80 ± 6.36 Muscle 0.75 ± 0.11 0.92 ± 0.18 0.82 ± 0.25 1.11 ± 0.26 1.31 ± 0.30 1.67 ± 0.91 Bone 1.84 ± 0.14 1.56 ± 0.20 1.12 ± 0.26 2.47 ± 0.52 2.04 ± 0.55 2.22 ± 0.89 Tumor 35.26 ± 7.92† 50.43 ± 11.80† 46.60 ± 9.39† 12.07 ± 2.67 8.89 ± 4.67 10.42 ± 3.19


