
Main menu

  • Home
  • Content
    • Current
    • Ahead of print
    • Past Issues
    • JNM Supplement
    • SNMMI Annual Meeting Abstracts
    • Continuing Education
    • JNM Podcasts
  • Subscriptions
    • Subscribers
    • Institutional and Non-member
    • Rates
    • Journal Claims
    • Corporate & Special Sales
  • Authors
    • Submit to JNM
    • Information for Authors
    • Assignment of Copyright
    • AQARA requirements
  • Info
    • Reviewers
    • Permissions
    • Advertisers
  • About
    • About Us
    • Editorial Board
    • Contact Information
  • More
    • Alerts
    • Feedback
    • Help
    • SNMMI Journals
  • SNMMI
    • JNM
    • JNMT
    • SNMMI Journals
    • SNMMI

User menu

  • Subscribe
  • My alerts
  • Log in
  • My Cart

Search

  • Advanced search
Journal of Nuclear Medicine
  • SNMMI
    • JNM
    • JNMT
    • SNMMI Journals
    • SNMMI
  • Subscribe
  • My alerts
  • Log in
  • My Cart
Journal of Nuclear Medicine

Advanced Search

  • Home
  • Content
    • Current
    • Ahead of print
    • Past Issues
    • JNM Supplement
    • SNMMI Annual Meeting Abstracts
    • Continuing Education
    • JNM Podcasts
  • Subscriptions
    • Subscribers
    • Institutional and Non-member
    • Rates
    • Journal Claims
    • Corporate & Special Sales
  • Authors
    • Submit to JNM
    • Information for Authors
    • Assignment of Copyright
    • AQARA requirements
  • Info
    • Reviewers
    • Permissions
    • Advertisers
  • About
    • About Us
    • Editorial Board
    • Contact Information
  • More
    • Alerts
    • Feedback
    • Help
    • SNMMI Journals
  • View or Listen to JNM Podcast
  • Visit JNM on Facebook
  • Join JNM on LinkedIn
  • Follow JNM on Twitter
  • Subscribe to our RSS feeds
OtherBASIC SCIENCE INVESTIGATIONS

Quantification of [18F]FDG Uptake in the Normal Liver Using Dynamic PET: Impact and Modeling of the Dual Hepatic Blood Supply

Gunnar Brix, Sibylle I. Ziegler, Matthias E. Bellemann, Josef Doll, Rudolph Schosser, Robert Lucht, Heiner Krieter, Dietmar Nosske and Uwe Haberkorn
Journal of Nuclear Medicine August 2001, 42 (8) 1265-1273;
Gunnar Brix
  • Find this author on Google Scholar
  • Find this author on PubMed
  • Search for this author on this site
Sibylle I. Ziegler
  • Find this author on Google Scholar
  • Find this author on PubMed
  • Search for this author on this site
Matthias E. Bellemann
  • Find this author on Google Scholar
  • Find this author on PubMed
  • Search for this author on this site
Josef Doll
  • Find this author on Google Scholar
  • Find this author on PubMed
  • Search for this author on this site
Rudolph Schosser
  • Find this author on Google Scholar
  • Find this author on PubMed
  • Search for this author on this site
Robert Lucht
  • Find this author on Google Scholar
  • Find this author on PubMed
  • Search for this author on this site
Heiner Krieter
  • Find this author on Google Scholar
  • Find this author on PubMed
  • Search for this author on this site
Dietmar Nosske
  • Find this author on Google Scholar
  • Find this author on PubMed
  • Search for this author on this site
Uwe Haberkorn
  • Find this author on Google Scholar
  • Find this author on PubMed
  • Search for this author on this site
  • Article
  • Figures & Data
  • Info & Metrics
  • PDF
Loading

Article Figures & Data

Figures

  • Tables
  • FIGURE 1.
    • Download figure
    • Open in new tab
    • Download powerpoint
    FIGURE 1.

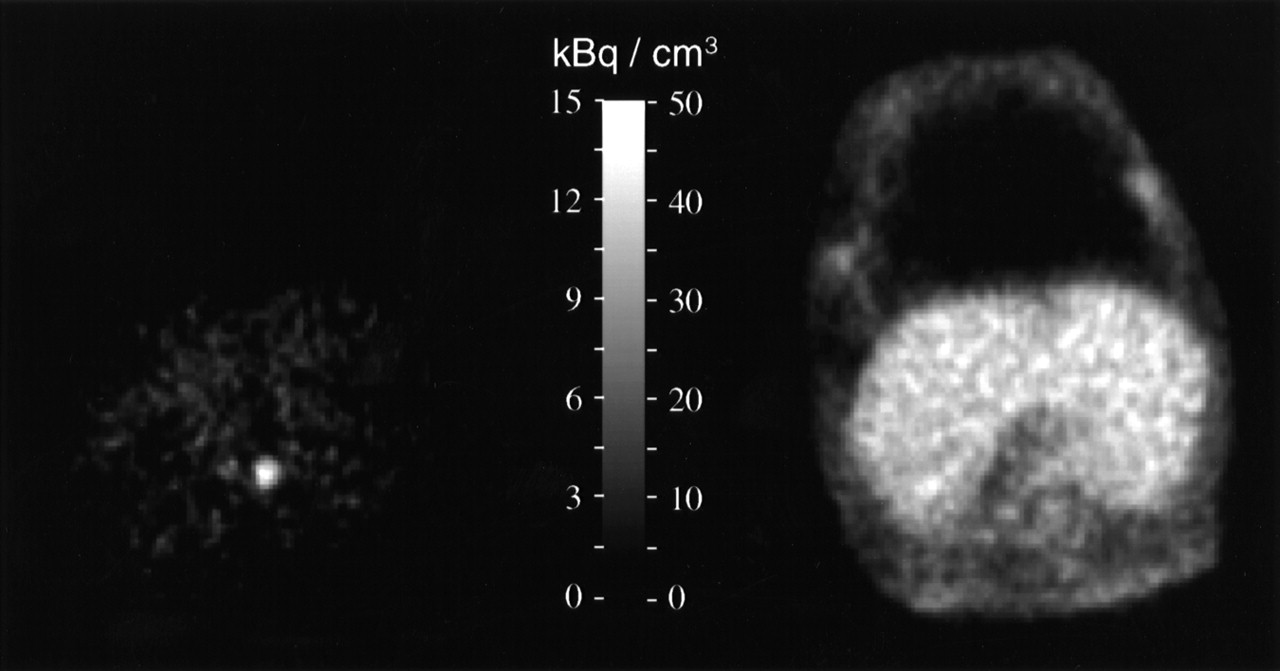
    Representative PET scans show FDG distribution in a foxhound 0.25 min (frame 1, left) and 12.5 min (frame 15, right) after intravenous FDG administration. Time–activity courses were derived from ROIs defined over aorta and over right and left side of liver.

  • FIGURE 2.
    • Download figure
    • Open in new tab
    • Download powerpoint
    FIGURE 2.

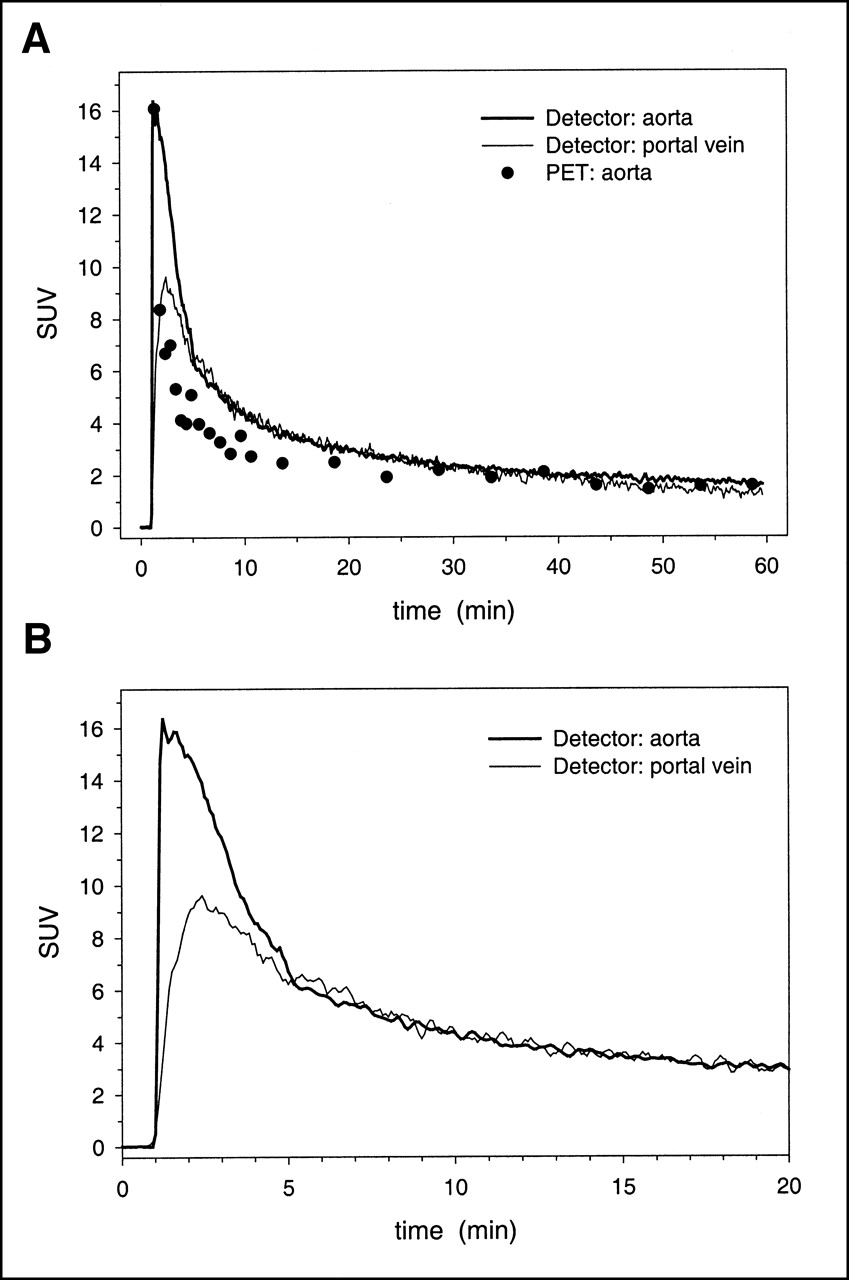
    (A) Typical blood activity curves determined in aorta and portal vein of foxhound 4. Data were determined simultaneously by 2 independent detector systems (fluid monitors) with temporal resolution of 1 s and directly from aorta visualized on PET scans (Fig. 1, left). For better comparison, PET curve was shifted so that its maximum aligns with maximum of arterial blood curve measured by fluid monitor. (B) Detail of A, which shows that initial part of portal input is characterized by much lower maximum activity concentration and later moment of maximum concentration relative to arterial input.

  • FIGURE 3.
    • Download figure
    • Open in new tab
    • Download powerpoint
    FIGURE 3.

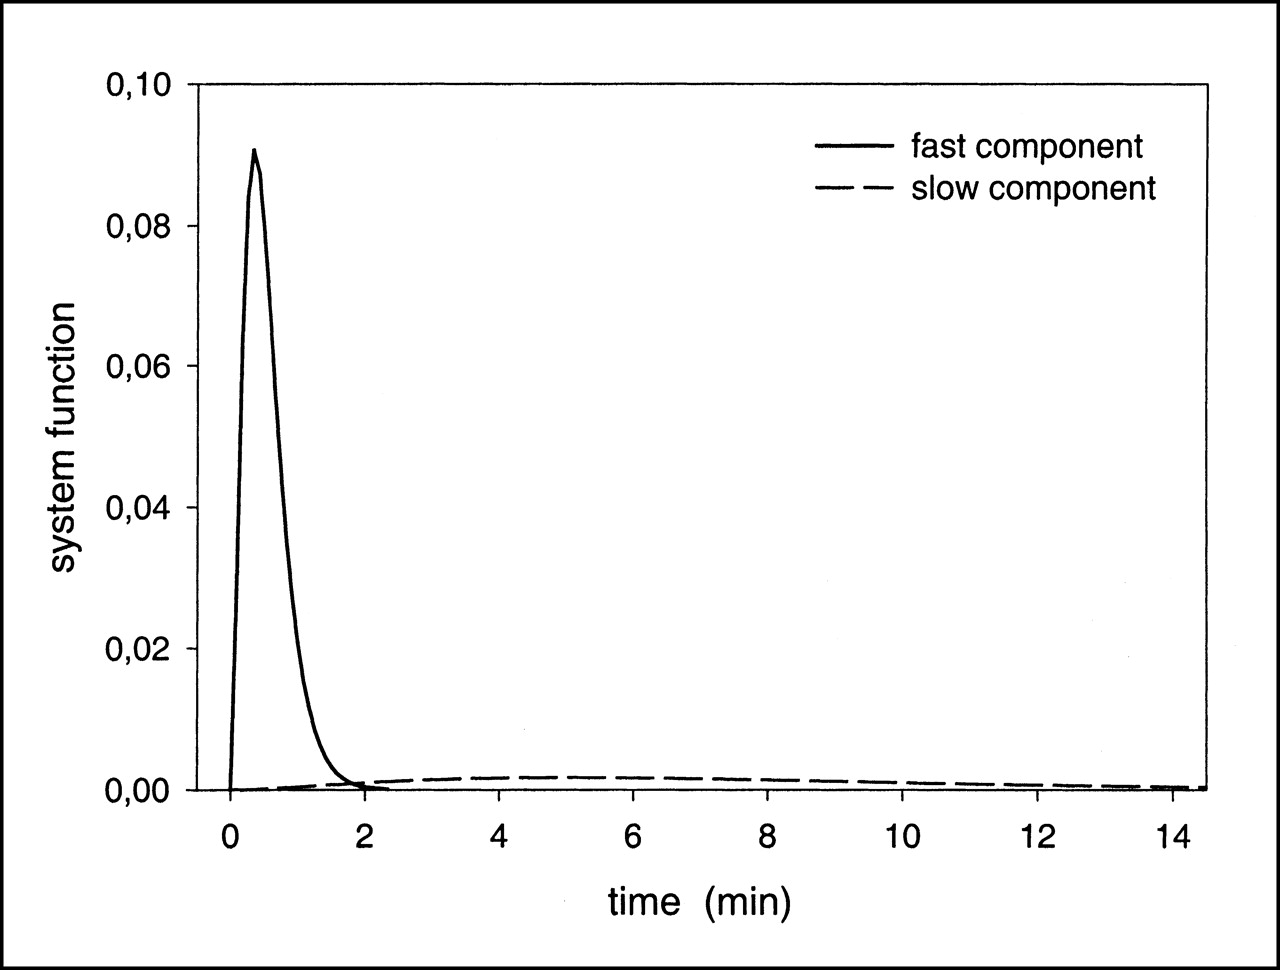
    Fast and slow component of average system function S̄ approximating dispersion of arterial input on its way through gastrointestinal tract to portal vein in 5 foxhounds. Corresponding fit parameters estimated according to Equation 1 are summarized in Table 1.
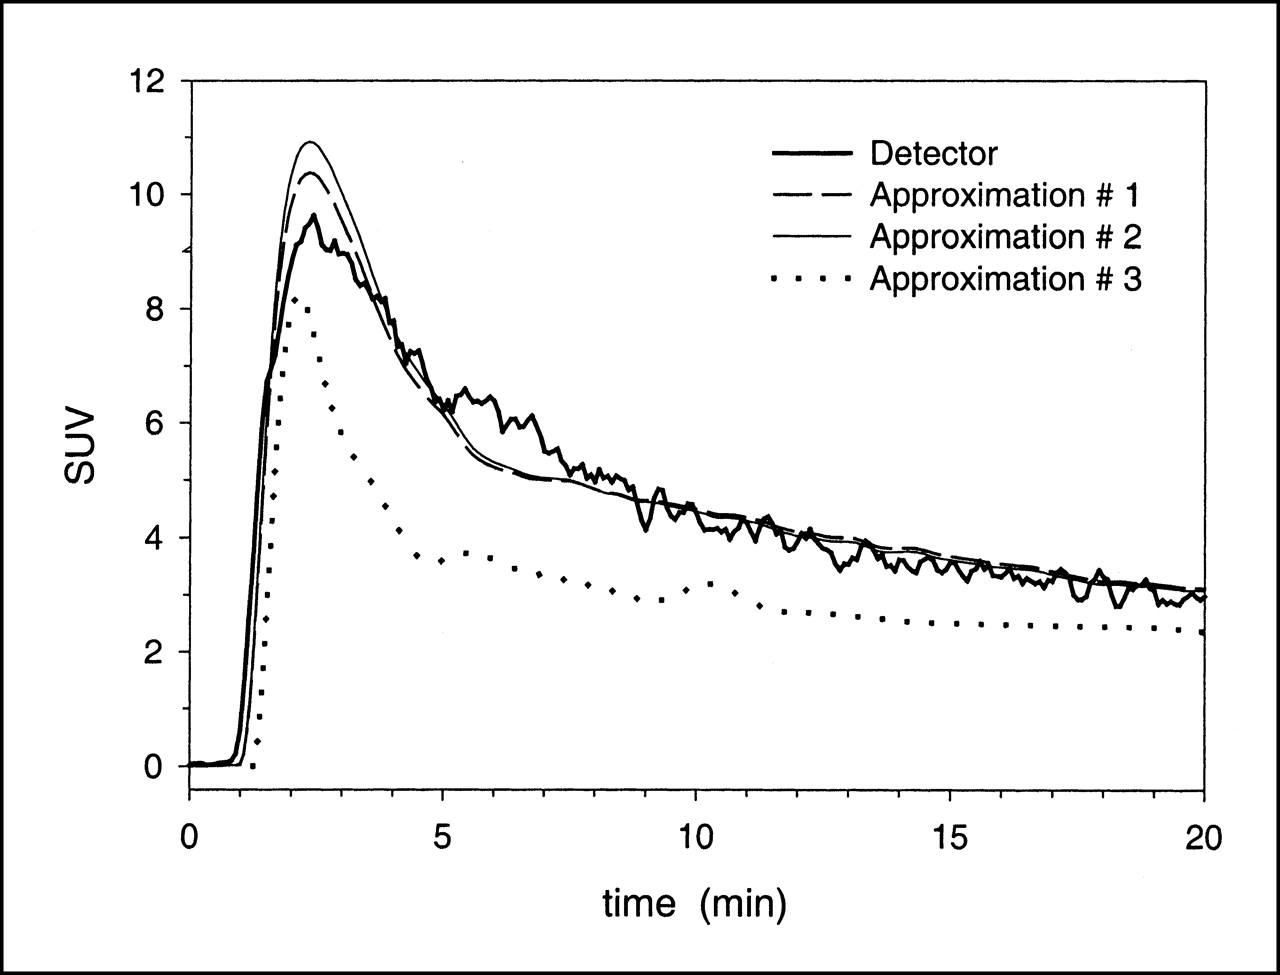
  • FIGURE 4.
    • Download figure
    • Open in new tab
    • Download powerpoint
    FIGURE 4.

    Approximation of venous input function measured directly in portal vein of foxhound 4 (Table 1) by convolution of arterial input measured by external detector with individual system function (#1), arterial input measured by external detector with average system function (#2), and arterial input determined by PET with average system function (#3). Only first 20 min are shown.
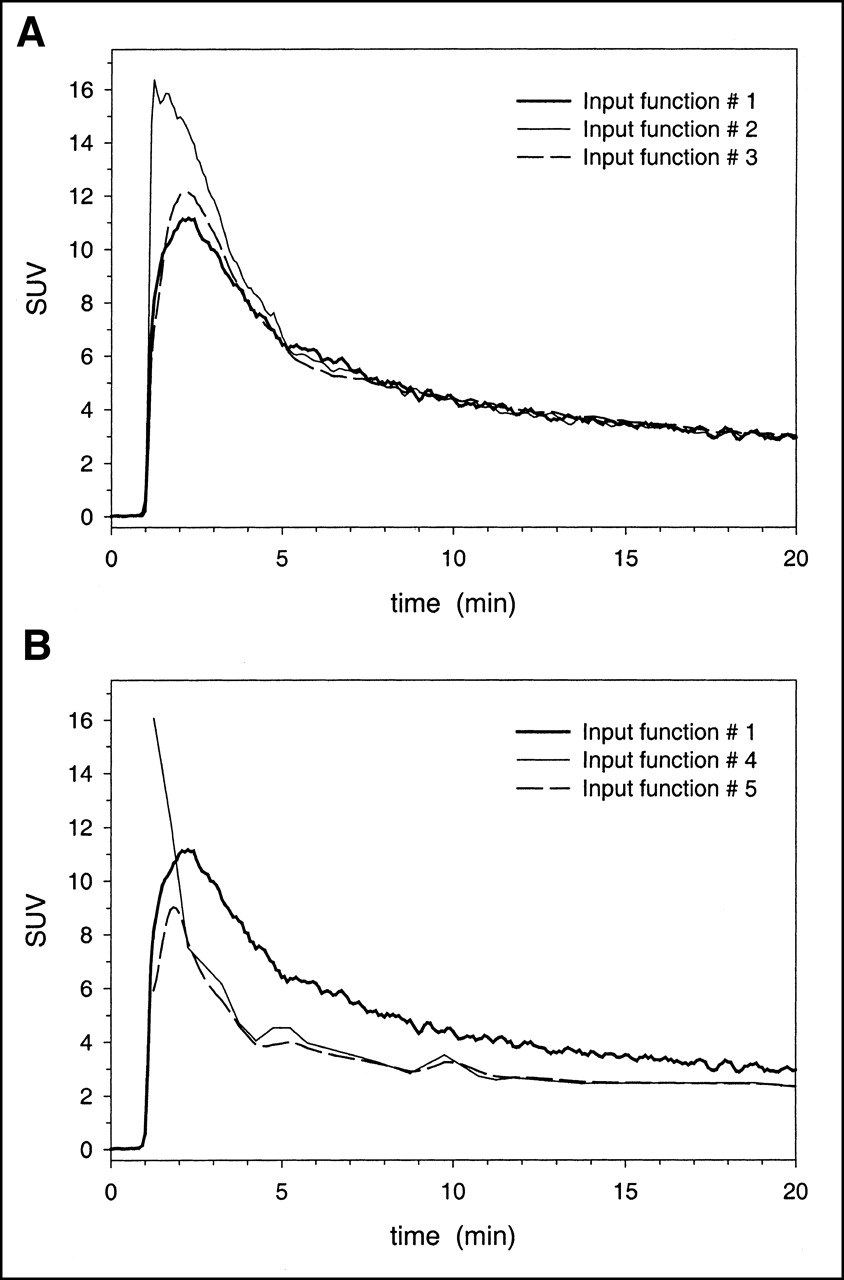
  • FIGURE 5.
    • Download figure
    • Open in new tab
    • Download powerpoint
    FIGURE 5.

    Comparison of 5 hepatic input functions defined by Equations 2–6 for foxhound 4 (Table 1). Input function #1 is weighted sum of arterial and portal venous blood activities measured by 2 independent external detector systems. Other functions approximate hepatic blood supply by means of arterial activity values obtained from external detector system (A) and from dynamically acquired PET scans (B). Input functions #2 and #4 correspond to single-input model in which hepatic blood supply is described solely by arterial input, whereas input functions #3 and #5 pertain to dual-input scenario in which hepatic input is weighted sum of arterial input and portal venous input estimated by convolving measured arterial time–activity course with average system function S̄ (Fig. 4). Only first 20 min are shown.
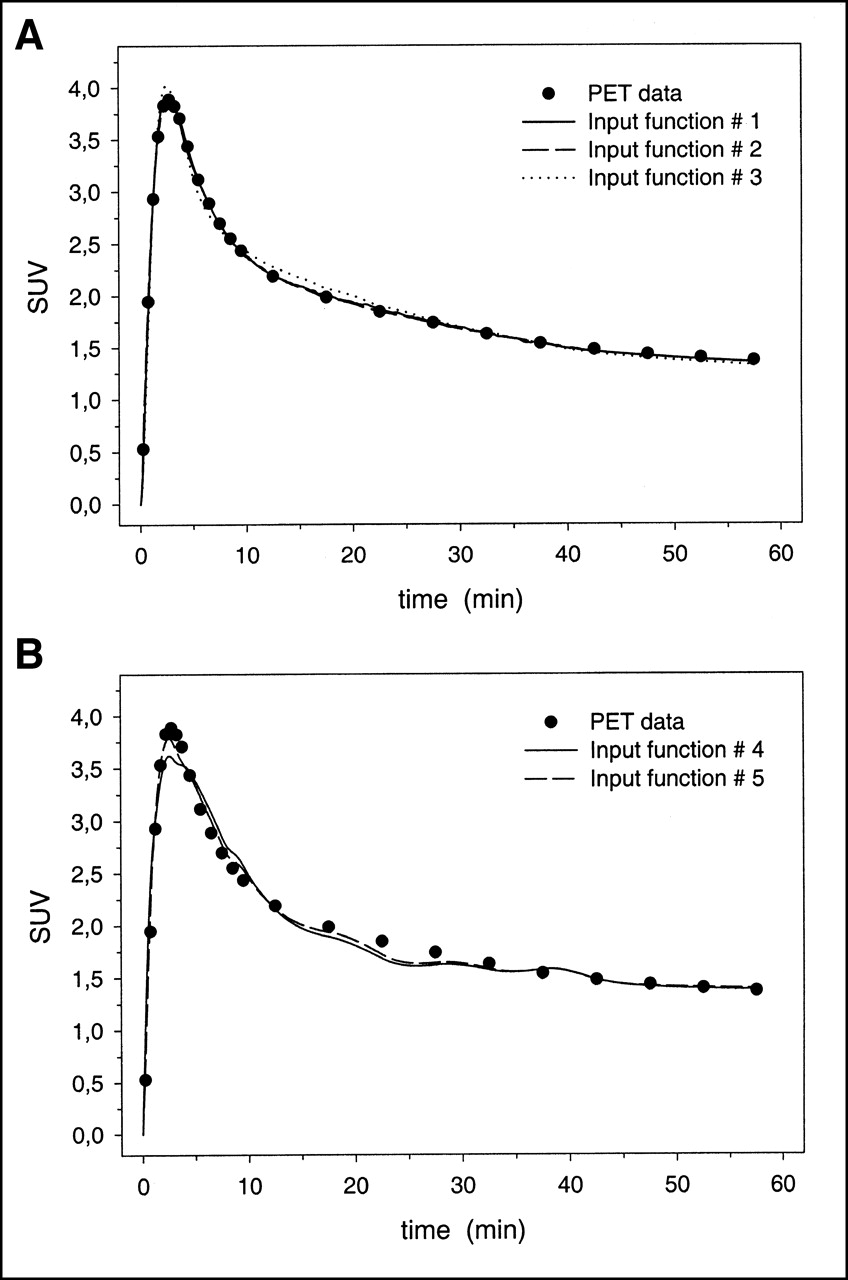
  • FIGURE 6.
    • Download figure
    • Open in new tab
    • Download powerpoint
    FIGURE 6.

    SUVs measured dynamically by PET from normal liver tissue of foxhound 4. Curves show 3-compartment model fits computed for input models #1–#3 estimated from external blood activity measurements (A) and input models #4 and #5 estimated from blood activity measurements with PET (B)

  • FIGURE 7.
    • Download figure
    • Open in new tab
    • Download powerpoint
    FIGURE 7.

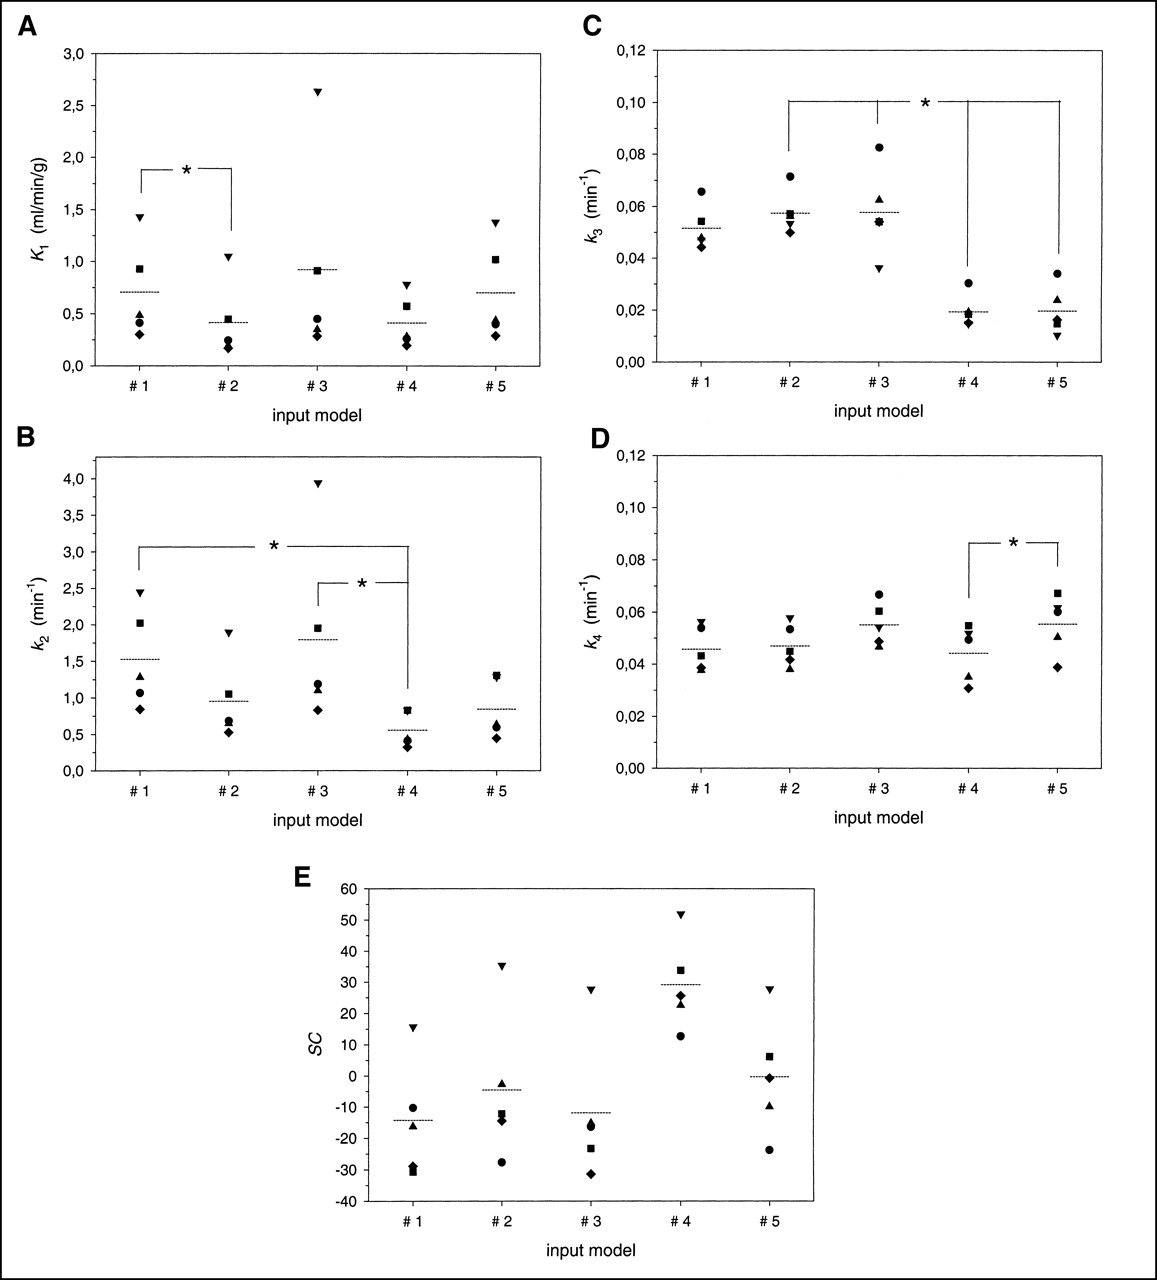
    Effect of 5 different input models defined by Equations 2–6 on pharmacokinetic parameter estimates for 3-compartment model characterizing transport and metabolism of FDG in normal liver. (A) K1. (B) k2. (C) k3. (D) k4. Significant differences (P < 0.05) between pairs of parameter distributions are marked by asterisk. (E) Numeric scores computed in accordance with Schwarz criterion to compare adequacy of model fits to liver data using different input models. Symbols show individual fit values; horizontal lines indicate corresponding mean values.

Tables

  • Figures
    • View popup
    TABLE 1

    Fit Parameters of System Function as Defined in Equation 1 Estimated for 5 Foxhounds

    Dog no.P0P1P2 (min−1)P3P4 (min−1)χind2*χave2*MTTf† (s)
    11.929.196.790.71 . 10−30.3752.388.418.7
    21.4015.610.00.59 . 10−30.3512.3235.913.1
    31.451.804.200.50 . 10−30.3527.746.331.2
    41.743.185.110.70 . 10−30.3562.575.924.0
    51.780.763.280.71 . 10−30.3522.2434.634.6
    Average curve1.743.355.090.60 . 10−30.35176—25.3
    • ↵*  Residual sum of squares between measured and calculated portal venous activity values. χind2 and χave2 characterize approximation of portal venous function by convolution of arterial input function with corresponding individual system function and average system function, respectively.

    • ↵†  Mean transit time of dominant fast component Sf(t) = tP0 . P1 . exp(−P2 . t) of estimated system function.

    • Parameters were estimated by means of nonlinear least-squares fit for each dog from individual arterial and portal venous input functions as well as from averaged time–activity courses. Errors in fit parameters were <1.5%.

PreviousNext
Back to top

In this issue

Journal of Nuclear Medicine: 42 (8)
Journal of Nuclear Medicine
Vol. 42, Issue 8
August 1, 2001
  • Table of Contents
  • Index by author
Print
Download PDF
Article Alerts
Sign In to Email Alerts with your Email Address
Email Article

Thank you for your interest in spreading the word on Journal of Nuclear Medicine.

NOTE: We only request your email address so that the person you are recommending the page to knows that you wanted them to see it, and that it is not junk mail. We do not capture any email address.

Enter multiple addresses on separate lines or separate them with commas.
Quantification of [18F]FDG Uptake in the Normal Liver Using Dynamic PET: Impact and Modeling of the Dual Hepatic Blood Supply
(Your Name) has sent you a message from Journal of Nuclear Medicine
(Your Name) thought you would like to see the Journal of Nuclear Medicine web site.
Citation Tools
Quantification of [18F]FDG Uptake in the Normal Liver Using Dynamic PET: Impact and Modeling of the Dual Hepatic Blood Supply
Gunnar Brix, Sibylle I. Ziegler, Matthias E. Bellemann, Josef Doll, Rudolph Schosser, Robert Lucht, Heiner Krieter, Dietmar Nosske, Uwe Haberkorn
Journal of Nuclear Medicine Aug 2001, 42 (8) 1265-1273;

Citation Manager Formats

  • BibTeX
  • Bookends
  • EasyBib
  • EndNote (tagged)
  • EndNote 8 (xml)
  • Medlars
  • Mendeley
  • Papers
  • RefWorks Tagged
  • Ref Manager
  • RIS
  • Zotero
Share
Quantification of [18F]FDG Uptake in the Normal Liver Using Dynamic PET: Impact and Modeling of the Dual Hepatic Blood Supply
Gunnar Brix, Sibylle I. Ziegler, Matthias E. Bellemann, Josef Doll, Rudolph Schosser, Robert Lucht, Heiner Krieter, Dietmar Nosske, Uwe Haberkorn
Journal of Nuclear Medicine Aug 2001, 42 (8) 1265-1273;
Twitter logo Facebook logo LinkedIn logo Mendeley logo
  • Tweet Widget
  • Facebook Like
  • Google Plus One
Bookmark this article

Jump to section

  • Article
    • Abstract
    • MATERIALS AND METHODS
    • RESULTS
    • DISCUSSION
    • CONCLUSION
    • Acknowledgments
    • Footnotes
    • REFERENCES
  • Figures & Data
  • Info & Metrics
  • PDF

Related Articles

  • No related articles found.
  • PubMed
  • Google Scholar

Cited By...

  • Structural and Practical Identifiability of Dual-input Kinetic Modeling in Dynamic PET of Liver Inflammation
  • Dynamic PET of Human Liver Inflammation: Impact of Kinetic Modeling with Optimization-Derived Dual-Blood Input Function
  • Bringing Physiology into PET of the Liver
  • Is Liver SUV Stable over Time in 18F-FDG PET Imaging?
  • Insulin Stimulates Liver Glucose Uptake in Humans: An 18F-FDG PET Study
  • Quantification of 18F-FDG Uptake in the Liver Using Dynamic PET
  • Google Scholar

More in this TOC Section

  • How Sensitive Is the Upper Gastrointestinal Tract to 90Y Radioembolization? A Histologic and Dosimetric Analysis in a Porcine Model
  • 11C-Methionine PET of Myocardial Inflammation in a Rat Model of Experimental Autoimmune Myocarditis
  • Counting Rate Characteristics and Image Distortion in Preclinical PET Imaging During Radiopharmaceutical Therapy
Show more Basic Science Investigations

Similar Articles

SNMMI

© 2025 SNMMI

Powered by HighWire