


Abstract
[18F](+)-4-fluorobenzyltrozamicol (FBT), which selectively binds to the vesicular acetylcholine transporter in the presynaptic cholinergic neuron, has previously been shown to be a useful ligand for the study of cholinergic terminal density in the basal ganglia with PET. The goal of this study was to assess the test–retest variability of [18F]FBT and PET measurements under baseline conditions in the basal ganglia. Methods: After approval from the Animal Care and Use Committee, 6 rhesus monkeys underwent a series of 2 [18F]FBT PET scans (time between scans, 32–301 d) under isoflurane anesthesia. Each scan was initiated on the bolus injection of the radiotracer and consisted of 26 frames acquired during 180 min. Arterial blood samples were collected over the course of each scan to determine the metabolite-corrected arterial input function. Tissue time–activity curves were obtained from the scan data by drawing regions of interest over the basal ganglia and cerebellum. The distribution volume ratio for the basal ganglia was then determined for each scan by taking the ratio of the basal ganglia (specific binding) to cerebellum (nonspecific binding) distribution volume. Distribution volumes were derived using the Logan graphic analysis technique as well as a standard 3-compartment model. Additionally, the radioactivity concentration ratio was calculated as the ratio of the average [18F]FBT concentration in the basal ganglia to that in the cerebellum during the last half of the study (85–170 min). The constant K1, determined using the standard 3-compartment model, was used as an index of blood flow changes between studies. Results: For all subjects, the test–retest variability was less than 15% for the distribution volume ratio and 12% for the radioactivity concentration ratio. Good agreement was found between the distribution volume ratio calculated using the graphic technique and the standard 3-compartment model. Using K1 as an index, the variability in blood flow seen in both the basal ganglia and the cerebellum was significantly reduced in their ratio. Conclusion: These results show the reproducibility of [18F]FBT and PET measurements in the basal ganglia.
Cholinergic neurons are an important part of many central nervous system functions, including cognition (1–2) and nociception (3). Considerable effort has been expended in developing methods for studying cholinergic neurons in vivo under a variety of disease and functional states (4). In these methods, a radiotracer targeting a specific component of cholinergic neurotransmission, such as acetylcholine synthesis or storage, is used. We have investigated the use of one such radiotracer, [18F](+)-4-fluorobenzyltrozamicol (FBT), which selectively binds to the vesicular acetylcholine transporter in the cholinergic neuron (5). [18F]FBT appears to be a useful ligand for the study of cholinergic terminal density in the basal ganglia with PET (5,6). We propose that [18F]FBT and PET can also be used to study cholinergic mechanisms in the basal ganglia, including short-term activation of cholinergic neurons and long-term changes in cholinergic terminal density. Studies of the [18F]FBT analog (+)-meta-[125I]iodobenzyltrozamicol suggest that both acute changes in cholinergic activity and chronic changes in cholinergic nerve terminals should result in changes in [18F]FBT binding that can be imaged using PET (7–9).
A powerful approach to conducting such studies is a within-subject design that eliminates the added variability introduced by subject-to-subject differences. However, before such studies can be conducted, an assessment must be made of the within-subject variability of [18F]FBT and PET measurements under baseline conditions. In this study, we show the within-subject reproducibility of PET measurements of [18F]FBT in the brain. Specifically, we present the results of scanning 6 rhesus monkeys twice each using [18F]FBT and PET under baseline conditions with an interscan interval of up to 301 d.
MATERIALS AND METHODS
Subject Preparation and Anesthesia
Six adult male rhesus monkeys, Macaca mulatta, were each studied on 2 separate occasions (interscan interval range, 32–301 d) under similar anesthetic conditions using [18F]FBT and PET. Table 1 details subject demographic data and interscan intervals. The animals were transferred from their housing campuses, 1 d before or on the day of the experiment, to a holding room at the location of the PET scanner. Food was allowed ad libitum until 5 pm the evening before the experiments, and water was allowed ad libitum until 7 am on the morning of the experiments. Ninety minutes before the onset of the PET study, the animal was sedated with intramuscular ketamine (10 mg/kg), anesthesia was induced with isoflurane, and the trachea was intubated. Anesthesia was then maintained with 1.2%–2.0% isoflurane over the course of the study. The femoral artery was isolated, and a 20-gauge arterial catheter was inserted and secured to the artery with 3.0 polydioxanone II sutures. A 20-gauge intravenous catheter was also inserted into the saphenous vein of the opposite leg for administration of the radiotracer and fluid replacement. Rectal temperature was continuously monitored with a Monotherm thermometer (Fisher Scientific, Houston, TX) and was maintained with warm-water blankets at 37.8°C ± 0.5°C. Other noninvasive monitoring included pulse oximetry, end-tidal capnometry, inspired oxygen concentration analysis, and noninvasive blood pressure measurement.
Summary of Demographic and [18F]FBT Injection Data
PET and Data Acquisition
PET was performed on an ECAT 951/31 PET scanner (Siemens/CTI, Knoxville, TN) (approximately 6 mm spatial resolution in all 3 axes). This device acquires 31 simultaneous transverse planes over a 10.4-cm axial field of view (3.3-mm slice width). Once the animal was anesthetized and positioned in the scanner, a 15-min transmission scan was acquired to provide attenuation correction for the subsequent emission scan. After the transmission scan, 85–230 MBq [18F]FBT were injected intravenously and a dynamic PET scan was initiated. (Table 1 provides details about the injected dose, and the radiosynthesis method was as previously described (5–6)). Specifically, data were acquired over 26 time frames (5 × 1 min, 5 × 2 min, 5 × 5 min, 8 × 10 min, and 3 × 20 min) to generate a 3-h dynamic image sequence. Data were reconstructed using a Hanning filter with a 0.4 (cycles/pixel) cutoff and corrected for attenuation.
At the beginning of the dynamic scan, arterial blood sampling into preheparinized mini centrifuge tubes was begun. The first 50 samples (1–125 s after the intravenous injection) were taken using an automatic blood sampler (Ole Dich Instruments, Hvidovre, Denmark). Each sample was 0.3 mL, and samples were taken at intervals of 2.5 s. The remaining samples (3, 5, 7.5, 10, 15, 20, 30, 60, 90, 120, and 180 min) were taken manually and were 1.5 mL in volume. The samples were centrifuged, and plasma aliquots of 50–100 mL were counted in a calibrated Cobra II automatic gamma counter (Packard, Downers Grove, IL). Arterial blood samples drawn at 1, 10, 20, 60, and 90 min were similarly processed and used as described previously (6) to determine the fraction of metabolites in the plasma at the respective intervals. We have found that a function of 3 exponentials fits these data well. Therefore, the metabolite results were then fit by the sum of 3 exponentials to estimate the fraction of metabolites in plasma as a function of scanning time. This function was then used to correct the arterial blood curves for the presence of metabolites.
Data Analysis
Regions of interest were drawn over the basal ganglia and cerebellum. Although other cortical regions such as the frontal cortex are of interest, we cannot image specific binding in those regions because of the size of the subject brain and the resolution of our scanner (6). For region-of-interest (ROI) determination, frame 26, containing 31 transaxial planes, was displayed. Frame 26 (acquisition frame 160–180 min after injection) of the 26 dynamically acquired emission frames was selected because it provides good whole-brain anatomic definition and sufficient contrast of the basal ganglia versus the rest of the brain (Fig. 1). ROIs for both basal ganglia and cerebellar regions were determined using the isocontour mode. For the basal ganglia, an isocontour threshold of 95% was set. For the cerebellum, an isocontour threshold that generated a region approximately 1 cm3 in size was used (65%–85% was routinely used in this study). The use of set isocontour levels for ROI determination ensures that the ROIs are easily and reproducibly defined. The narrow range of 95% was used for the basal ganglia because it selects the highest 5% of the pixel activities in the slice, thus minimizing the errors caused by partial-volume effect as well as generating approximately the same size ROI between studies (Fig. 1). Time–activity curves were then generated by the software of the ECAT scanner by placing the isocontour regions determined from frame 26 over the same region in each of the 26 frames. The ROI value is the average of all pixels contained within the ROI for each time frame. In the basal ganglia, the right and left sides were determined separately and then averaged.

Example of radiotracer distribution in specific binding region, basal ganglia (A), and nonspecific binding region, cerebellum (B), in frame 26 (160–180 min after tracer injection) for test and retest study. Regions of interest (ROIs) defined using isocontour method are also shown.
Distribution volumes for the basal ganglia and cerebellum were calculated using the graphic analysis method of Logan et al. (10) and a standard 3-compartment model (11). The ratio of the distribution volume in the basal ganglia to that in the cerebellum, designated the distribution volume ratio (DVR), was used as a measure of specific binding of [18F]FBT in the basal ganglia assuming that the cerebellum, a region essentially devoid of cholinergic terminals (12), is similar to the basal ganglia in its nonspecific binding characteristics. Another measure of [18F]FBT binding, the radioactivity concentration ratio (RAC) (13), was defined as the ratio of the average [18F]FBT concentration in the basal ganglia to that in the cerebellum during the last half of the study (85–170 min) (13,14). The 3-compartment model was also used to estimate K1, the blood flow–dependent transfer constant of tracer from blood to brain for each region.
Statistical Analysis
The reproducibility of the measurements was assessed in 2 ways. In the first, the intraclass correlation was calculated (15) to provide a statistical measure of the agreement between the test and retest data. In the second, the absolute percentage change was calculated as
 and P was determined by a 2-tailed paired t test.
RESULTS
[18F]FBT Injection
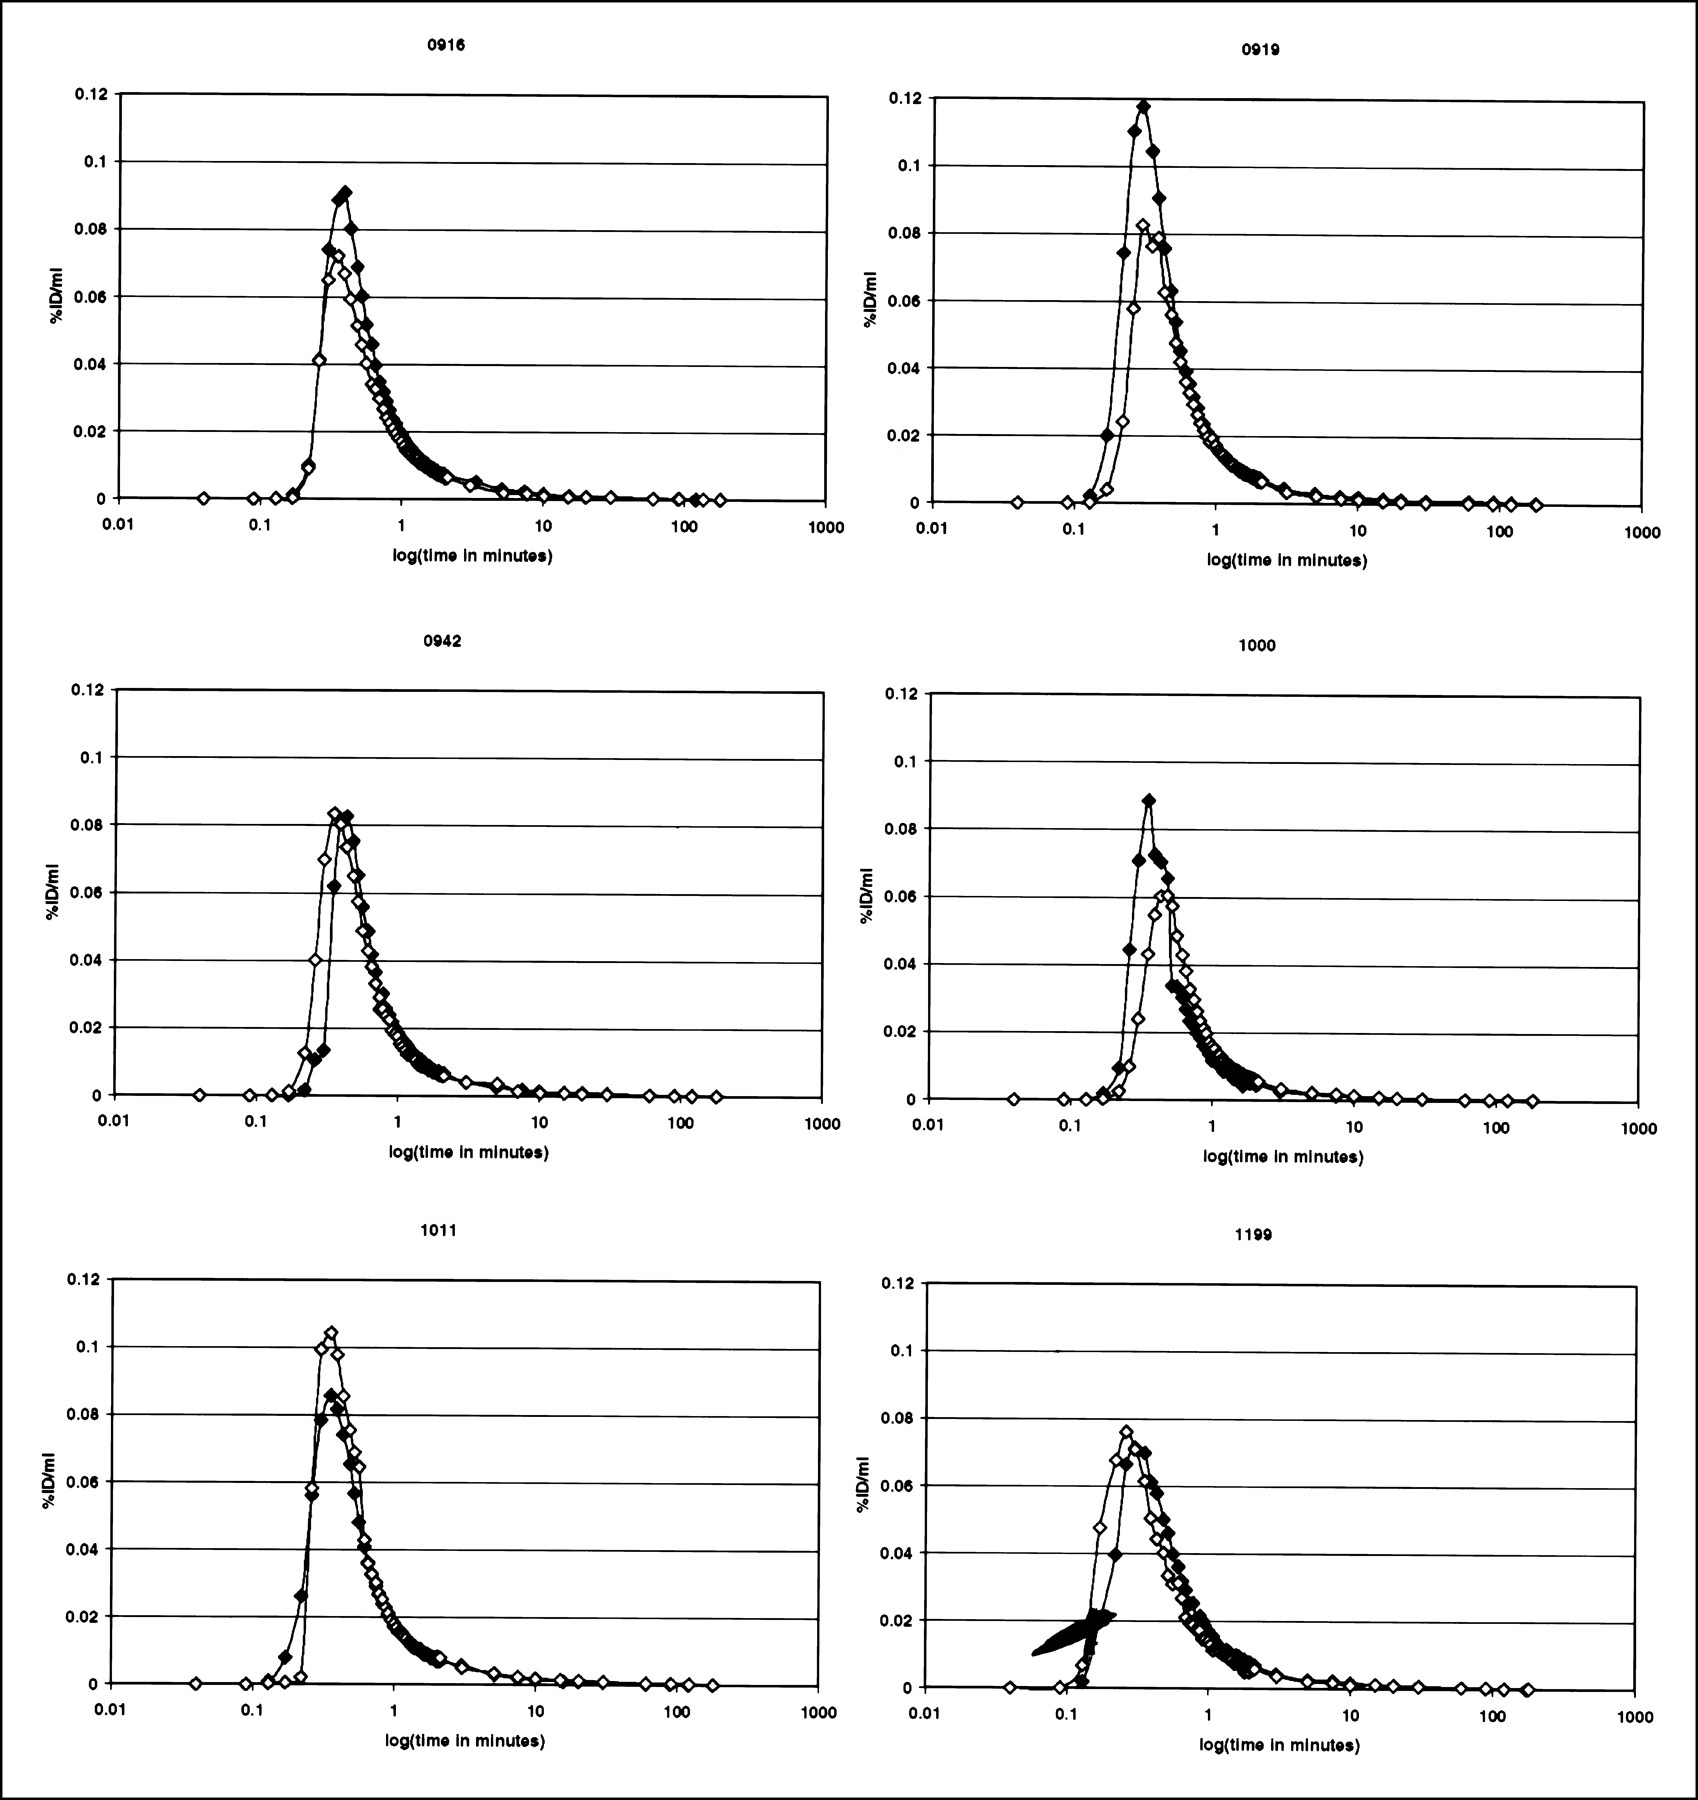
The dose, specific activity, and mass of [18F]FBT injected in each study are shown in Table 1. In all cases, a tracer dose (<6.9 μg) with a high specific activity (>12.1 MBq/nmol) and low mass was given. Also, as is reflected in Table 1, no attempt was made to inject the same amount of [18F]FBT in each study, with an average absolute percentage change of 20% in dose, 46% in specific activity, and 64% in mass. Table 2 details the average percentage (± percentage SD) of unmetabolized [18F]FBT in the blood in the test and retest studies over time. The average amount of unmetabolized [18F]FBT was similar between studies and decreased fairly rapidly over time, representing approximately only 30% of the total activity in the plasma at 90 min. The within-subject variability of the integral of the metabolite-corrected plasma input function of [18F]FBT at 170 min for each study (percentage injected dose [%ID] minutes per milliliter) was less than 20% in all subjects except subject 919 (50%). Individual metabolite-corrected plasma curves of [18F]FBT over time are presented in Figure 2 using the logarithm of time as the x-axis and the %ID/mL as the y-axis. For each subject, the curves become essentially identical after the first minute.

Percentage injected dose per milliliter in plasma (study 1, ♦; study 2, ⋄) as corrected for metabolites over logarithm (log) of scan period in minutes.
Percentage of Unmetabolized [18F]FBT in Arterial Plasma (± Percentage SD)
ROI Results
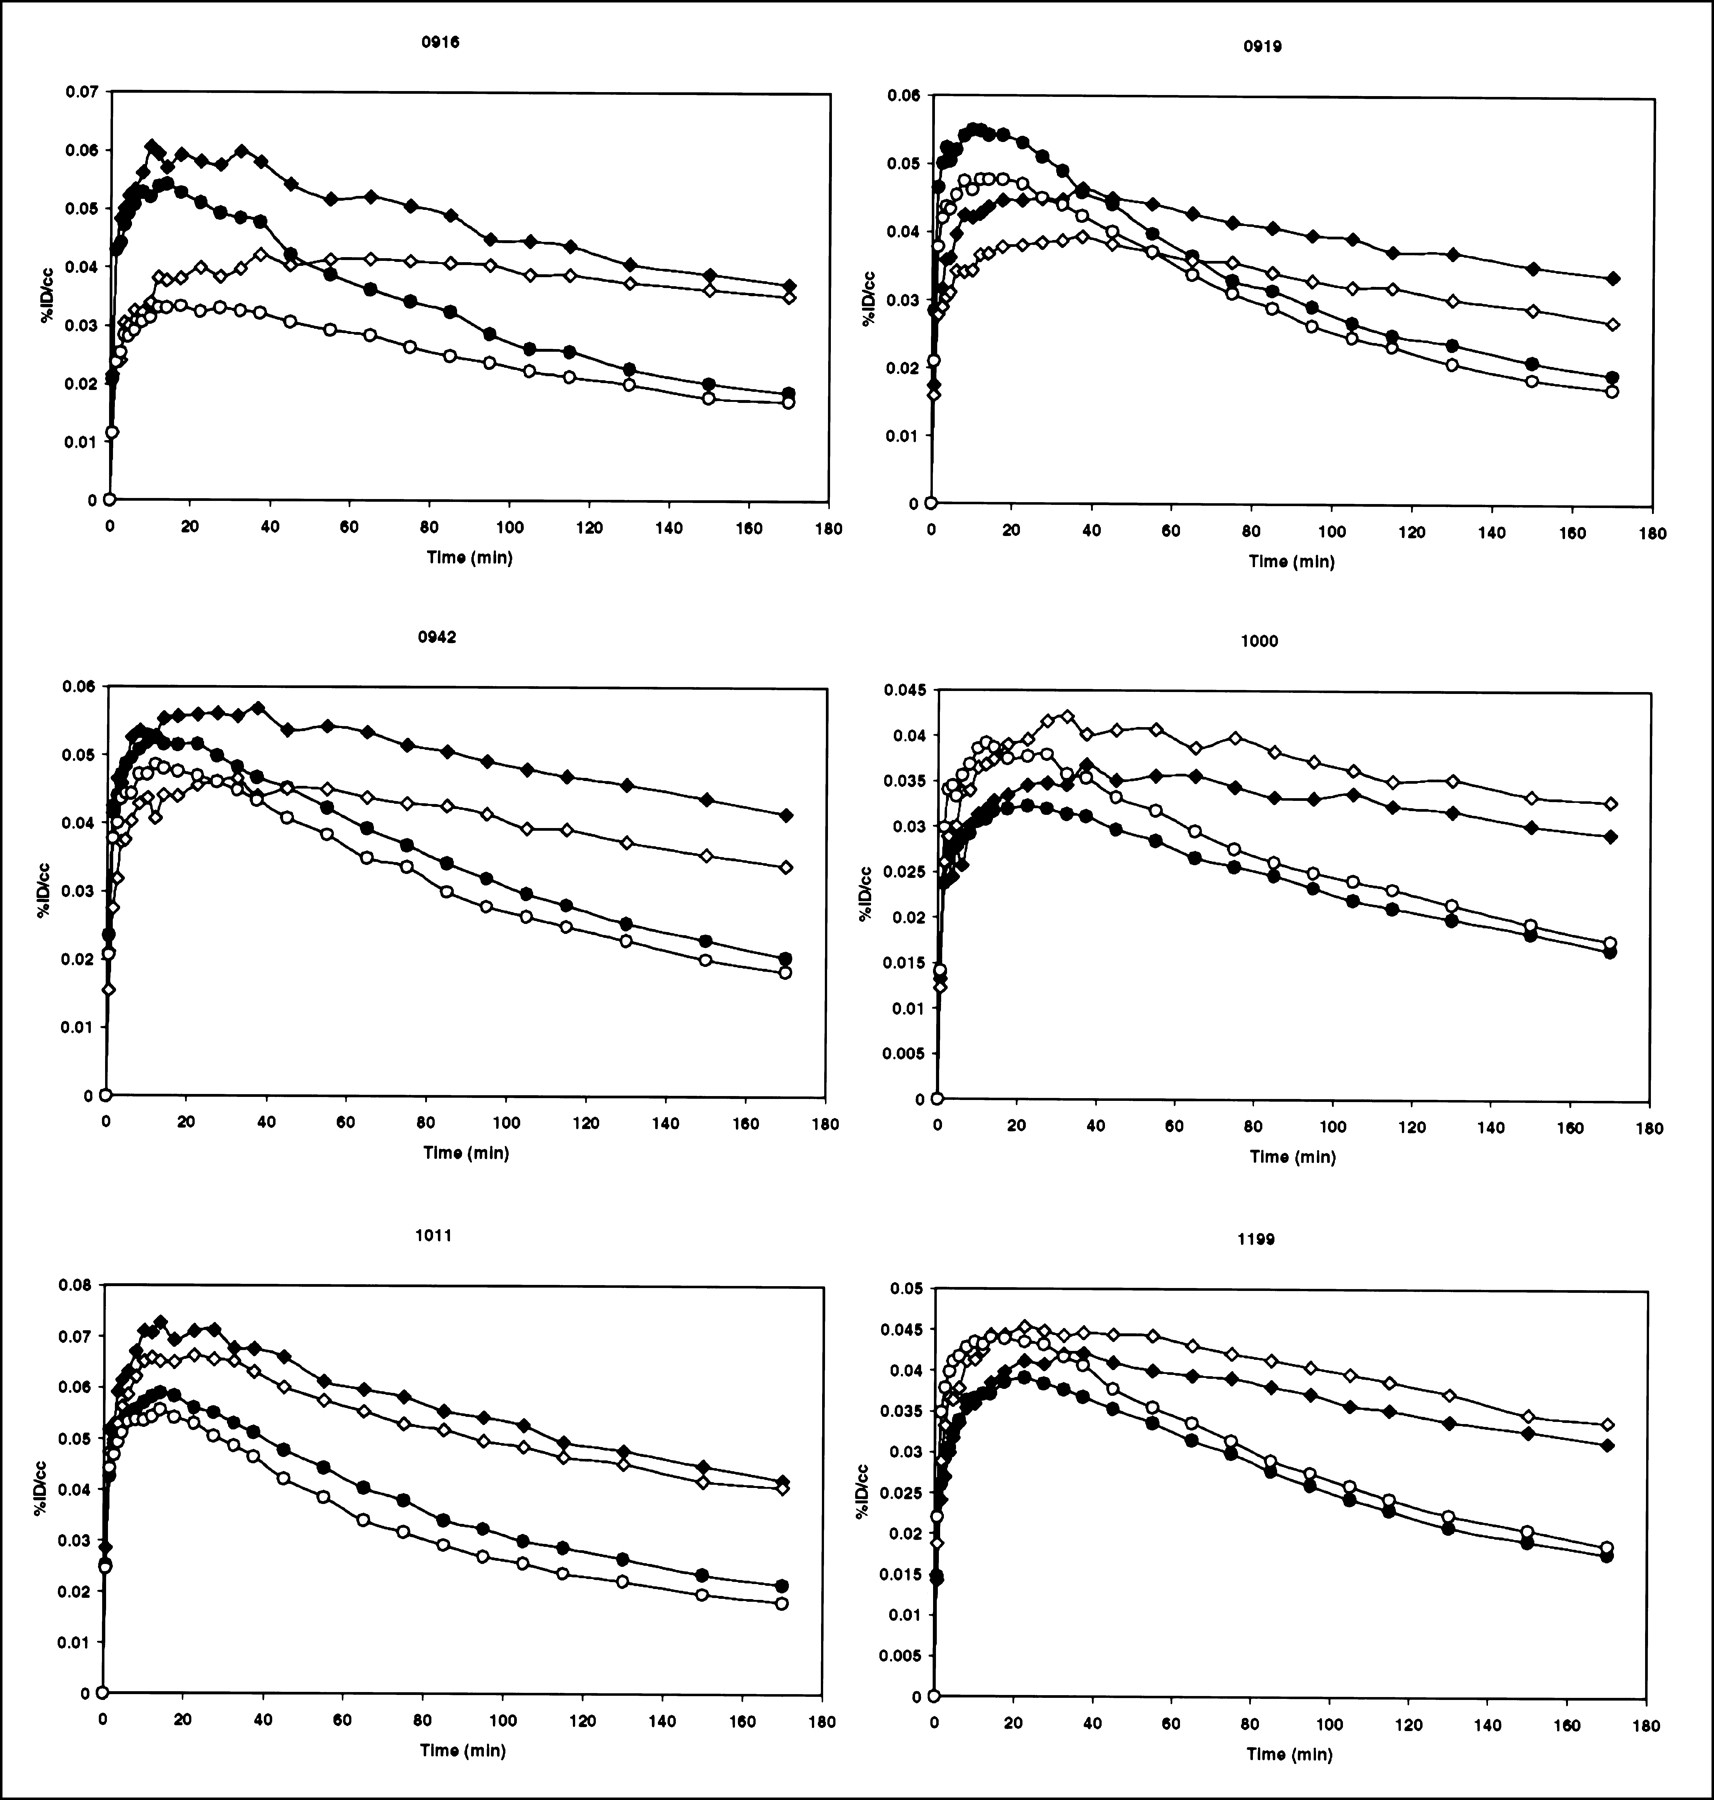
Test and retest time–activity curves for the basal ganglia and cerebellum for each animal are shown in Figure 3, with time in minutes as the x-axis and %ID/cm3 as the y-axis. The time–activity curves indicate reversible binding kinetics for both regions, with the [18F]FBT concentration reaching a peak and then washing out over time. Table 3 presents data from the time–activity curves for the basal ganglia and cerebellum. These data show that the variability in peak uptake (%ID/cm3) in the basal ganglia and cerebellum between the test and retest studies was clearly not significant (P = 0.18 and P = 0.37, respectively) and was less than 20% for all subjects except subject 916. The time to the peak value was from 10 to 37.5 min in the basal ganglia and from 10 to 22.5 min in the cerebellum across subjects (Table 3). Within subjects, the time to the peak in the basal ganglia differed by as much as 17.5 min in subject 916 to as little as no difference in subject 919. Likewise, the time to the peak in the cerebellum differed by as much as 10.5 min in subject 1000 to as little as no difference in subject 1011. Within subjects, the variability in the percentage decrease from peak values at 170 min was less than 15% in the basal ganglia and cerebellum for all subjects except subject 916 (Table 3). For subject 916, the absolute percentage difference was 80% and 29% in the basal ganglia and cerebellum, respectively. Across subjects, the average percentage decrease from peak values at 170 min was 29% ± 8% in the basal ganglia and 60% ± 6% in the cerebellum.

Percentage injected dose per cubic centimeter in basal ganglia (study 1, ♦; study 2, ⋄) and cerebellum (study 1, •; study 2, ○) over scan period in minutes.
Analysis of Time–Activity Curves of [18F]FBT in Basal Ganglia (BG) and Cerebellum (CB)
Table 4 presents the RAC and distribution volume data, determined using Logan graphic analysis, for the test and retest studies. Within subjects, the distribution volumes for the basal ganglia varied by less than 26% for all subjects except subject 919 (61%). Similarly, the distribution volumes for the cerebellum varied within subjects by less than 36% for all subjects except subject 919 (60%). Within subjects, the change in the ratio of the distribution volumes, the DVR, was not significant (P = 0.50) and varied by less than 15% for all subjects, with an intraclass correlation of 0.59. Across subjects, the average absolute percentage change in the DVR was 7%. The absolute percentage change in the RAC was not significant (P = 0.65) and was less than 12% for all studies, with an intraclass correlation of 0.72. Across subjects, the average absolute percentage change in the RAC was 6%.
Basal Ganglia (BG) to Cerebellar (CB) Ratios for [18F]FBT Radioactivity and Distribution Volumes
Table 5 presents the results obtained using compartmental modeling. In Table 5, the DVRs obtained using the Logan graphic analysis method are compared with those obtained using compartmental modeling. The absolute percentage difference between the 2 methods was not significant (P = 0.88) and was less than 13% for all subjects. Table 5 also presents the K1 values obtained using compartmental modeling. Within subjects, in the basal ganglia and cerebellum, K1 varied on average 23% ± 16% in the basal ganglia and 28% ± 15% in the cerebellum. The change in the ratio of the K1 values within subjects, however, was not significant (P = 0.79) and varied by less than 11% for all subjects except subject 919 (20%), with an intraclass correlation of 0.89.
Comparison of DVRs Obtained Using Graphic Analysis and Modeling and K1 Summary
DISCUSSION
An important aspect of PET is that it allows multiple studies to be performed in a single subject over time. This ability avoids a significant source of experimental variability—intersubject differences—by enabling an animal to serve as its own control. However, although between-subject variability can be ignored in a within-subject experimental design, an assessment of the within-subject variability of the technique is still needed.
In this study, the test–retest variability of [18F]FBT with PET was assessed in 6 rhesus monkeys. We previously showed [18F]FBT with PET to be a useful ligand for imaging cholinergic terminal density in the basal ganglia (5,6) and spinal cord (16). We also showed in work with an [18F]FBT analog, (+)-meta-[125I]iodobenzyltrozamicol, that [18F]FBT should be useful for visualizing acute and chronic changes in the cholinergic system (7–9). Thus, the results of this study are important in that they establish the sensitivity of this technique to changes in cholinergic function and thereby provide a further basis for subsequent investigation of cholinergic function using [18F]FBT with PET.
Two different measures of specific binding were taken in this study: the RAC and the DVR. As can be seen in Table 4, the variability of these 2 measures of specific binding in the basal ganglia was less than 14% for the DVR and less than 11% for the RAC over interscan intervals of up to 301 d. This low variability is comparable with variabilities seen in studies with other tracers for the same or shorter interscan intervals (13,14,17,18). The intraclass correlation coefficient was higher for the RAC than for the DVR (0.72 versus 0.59), thus possibly indicating that the RAC is a more reproducible measure of specific binding. However, because the RAC does not incorporate blood data, the measure that is more sensitive to changes in cholinergic function remains to be determined.
The 2 methods of calculating the DVR, the Logan graphic approach and a standard three-compartment model, were also compared. If applicable, the graphic approach simplifies computation of the DVR because a compartmental model need not be specified and the vagaries of nonlinear optimization are avoided. [18F]FBT shows reversible binding kinetics (Fig. 3) and displays regional Logan plots that become linear after some initial period. Thus, as has been shown with other radiotracers (10,19), the graphic approach should provide a DVR estimate that agrees with that obtained using compartmental modeling and a standard nonlinear least squares approach. Table 5 shows that use of the graphic technique is appropriate, because the 2 approaches agreed well, with maximum differences of less than 13% in all subjects.
An important issue in assessing changes in specific binding with any radiotracer is the impact of blood flow on the measurements. In this study, K1, the blood flow–dependent transfer constant of tracer from blood to brain obtained through compartmental modeling, was used as an index of blood flow in a region. Thus, changes in blood flow between studies should be reflected in their K1 estimates. Table 5 shows that the K1 values were quite variable between the test and retest studies for both regions. The absolute percentage change in the ratio of the K1 values for the basal ganglia and cerebellum, however, was less than 11% for all subjects except subject 919 (20%). This finding illustrates the rationale for using the ratio of the distribution volume for a specific binding region to that for a nonspecific binding region. Because the distribution volume for a region is linearly related to K1 (11), the DVR is linearly related to the basal ganglia-to-cerebellum K1 ratio and is relatively insensitive to changes in blood flow. Subject 919 is a good example; even with a 20% change in the K1 ratio of the animal, its DVR varied by less than 2% between studies. Therefore, as has been shown for D2 binding with [11C]raclopride (20), we believe that our results indicate that the DVR provides a stable measure of [18F]FBT specific binding.
A final issue concerns the impact of anesthesia on the specific binding parameters. The mechanism by which anesthetics work in the brain is currently a major topic of research in the anesthesia literature and is unresolved. Thus, the impact of anesthesia on the specific binding parameters is unknown. Because scanning of conscious nonhuman primates is impractical, we try to mitigate the anesthetic effect by maintaining the animal's vital signs within the range of homeostasis as well as minimizing variations in anesthetic levels.
CONCLUSION
In this study, we have shown the reproducibility of [18F]FBT and PET measurements in the basal ganglia. Future work will focus on our ability to measure changes in the cholinergic system in vivo with a variety of experimental paradigms under physiologically stable conditions.
Acknowledgments
This study was funded by National Institutes of Health grant AG 13922.
Footnotes
Received Aug. 17, 1999; revision accepted May 25, 2000.
For correspondence or reprints contact: H. Donald Gage, PhD, Division of Radiologic Sciences, Wake Forest University School of Medicine, Medical Center Blvd., Winston-Salem, NC 27157-1061.


