


Abstract
Parametric imaging of serotonin transporters (SERT) with 11C-labeled 3-amino-4-(2-dimethylaminomethyl-phenylsulfanyl)benzonitrile ([11C]DASB) PET is a useful data analysis tool. The purpose of this study was to evaluate the reproducibility of measurements of SERT binding potential (BP) and relative blood flow (R1) by a 2-parameter multilinear reference tissue parametric imaging method (MRTM2) for human [11C]DASB studies. Methods: Eight healthy subjects (3 men, 5 women; age, 26 ± 9 y) underwent 2 [11C]DASB PET scans separated by 1 h on the same day (dose, 703 ± 111 MBq). Parametric images of BP and R1 were generated by MRTM2 using the cerebellum as a reference region. The k′2 (clearance rate constant from the reference region) required by MRTM2 was estimated by the 3-parameter MRTM. Reproducibility of BP and R1 measurements was evaluated by calculating bias (100 × (retest – test/test), variability (SD of the bias), and reliability (intraclass correlation coefficient = ρ) for several representative regions of interest (ROIs). BP and R1 were estimated for ROI time–activity curves fitted by MRTM2 and were compared with those based on the parametric images. Results: The test–retest (0.066 ± 0.013/0.06 ± 0.011 min−1) MRTM k′2 reproducibility was excellent with small bias (3%) and variability (6%) and high reliability (0.95). Retest BP values were consistently lower than those of test BP values in all regions (a mean negative bias of ∼6%; P < 0.001). The test–retest BP variability was relatively small, ranging from 4% to 13%, with ρ ranging from 0.44 to 0.85. In contrast to BP, test–retest R1 values were similar with negligible bias of ≤0.1%. The test–retest R1 variability was excellent and smaller than that of BP ranging from 3% to 6%, with ρ ranging from 0.58 to 0.95. BP and R1 values estimated by the ROI time–activity curve-fitting method were slightly lower (∼3% and ∼1%, respectively) than those by the parametric imaging method (P < 0.001). However, the test–retest bias and variability of BP and R1 were very similar for both ROI and parametric methods. Conclusion: Our results suggest that [11C]DASB parametric imaging of BP and R1 with the noninvasive MRTM2 method is reproducible and reliable for PET studies of SERT.
- PET
- parametric imaging
- reproducibility
- linearized reference tissue model
- [11C]DASB
- serotonin transporters
- noninvasive quantification
The serotonin transporter (SERT) is located on the cell body and presynaptic terminals of the serotonergic neuron and plays an important role in the regulation of serotonergic neurotransmissions by means of reuptake of released serotonin in the synaptic cleft. Abnormalities of SERT have been described in several neuropsychiatric conditions, such as depression and obsessive–compulsive disorder (1–9). Therefore, in vivo imaging of the SERT has been of interest as a tool to study serotonin function in health and disease. A recently developed highly selective radioligand, 11C-labeled 3-amino-4-(2-dimethylaminomethyl-phenylsulfanyl)benzonitrile ([11C]DASB), has been successfully used for PET imaging of SERT in human brain (10–14). The estimated radiation burden of [11C]DASB is relatively small and would allow multiple PET examinations of the same research subject per year (15).
[11C]DASB tissue data can be described by a 1-tissue (1T) compartment model (10), and SERT binding potential (BP) (16), which correlates well with SERT densities (10,11), can be estimated using the cerebellum, which contains few SERT-binding sites, as reference tissue. Reference tissue methods have been widely used to estimate neuroreceptor BP because these methods eliminate the invasive and often logistically difficult procedure of obtaining arterial input functions corrected for metabolites.
A computationally fast and noise-resistant parameter estimation method, called 2-parameter linearized reference tissue model (MRTM2), allows parametric imaging of BP and relative tracer delivery (R1) from dynamic [11C]DASB PET data (17). In the present study, we evaluated the reproducibility of voxel-based measurements of SERT BP and R1 by MRTM2 in healthy volunteers, as the demonstration of a reproducible PET outcome measure is critical and preliminary to the extension of [11C]DASB PET to clinical populations such as depression and obsessive–compulsive disorders.
MATERIALS AND METHODS
Subjects
The study was conducted under the approval of the Institutional Review Board of the National Institute of Mental Health. Three male and 5 female healthy volunteers (mean age, 26 ± 9 y; age range, 19∼41 y) participated in the study after providing written informed consent. All subjects were free of medical or neuropsychiatric illness on the basis of a screening assessment consisting of history, physical examination, routine blood and urine tests, and electrocardiography.
Radiopharmaceutical Preparation
[11C]DASB was synthesized as previously described (18) by 11C-methyliodide reaction with the corresponding desmethyl precursor. The radiochemical purities of syntheses used for the study were 96.0% ± 2.9%, with corresponding specific activities of 49.6 ± 10.4 GBq/μmol (1.34 ± 0.28 Ci/μmol) at the time of injection. These and subsequent data are expressed as mean ± SD.
PET Data Acquisition
All subjects underwent a [11C]DASB PET scan (test) and a repeated PET scan (retest) separated by 1 h on the same day. Subjects were placed on the scanner bed with his or her head held firmly in place with a thermoplastic mask fixed to the bed to minimize head movement during each scan. After an 8-min transmission scan using a 68Ge rotating pin source, dynamic PET scans were acquired on the Advance tomograph (GE Healthcare) in the 3-dimensional mode for 120 min (33 successive frames consisting of 6 × 0.5, 3 × 1, 2 × 2, and 22 × 5 min frames) after bolus administration of 703 ± 111 MBq of [11C]DASB. The GE Advance acquires 35 simultaneous slices, with 4.25-mm interslice distance with a reconstructed spatial resolution of 6 mm in all directions.
To be used for image coregistration and anatomic reference, all subjects also had T1-weighted MRI (repetition time/echo time = 14/5.4), acquired on a 1.5-T Horizon scanner (GE Healthcare)
MRTM2
The operational equation for the MRTM2 (17) is: Eq. 1where C(T) and C′(T) are the region of interest (ROI) or voxel tissue tracer concentrations, k2 and k′2 are the tracer clearance rate constants from tissue, R1 is the relative tracer delivery (K1/K′1), and the prime sign indicates the reference region. Equation 1 is applicable to the entire time–activity data for [11C]DASB with 1T compartment model kinetics—that is, for T > 0. MRTM2 allows estimation of BP=(R1k′2/k2−1) and R1 using a receptor-free reference region (cerebellum). When given a priori the correct value of k′2, the MRTM2 parameter estimation is nearly identical to that of nonlinear 1T kinetic analysis (1TKA) (19) but MRTM2 parameter estimation can be performed in a fraction of the computational time required for the nonlinear version of MRTM2 (17). The value of k′2 can be estimated by the 3-parameter MRTM using ROI time–activity curves. The operational equation of MRTM is:
 Eq. 2Equation 2 estimates 3 parameters, R1, k′2, and k2, using the reference and target tissue time–activity curves. Because a different value of k′2 is estimated by Equation 2 for each ROI time–activity curve, although there is only 1 reference region and, therefore, only 1 true value for k′2, a 2-parameter version (MRTM2) of Equation 2 is obtained by fixing k′2 to a value obtained with a preliminary analysis using Equation 2.
Parametric Imaging
The original reconstructed PET data were corrected for subject motion by registering each frame to a summed image of all frames in the statistical parametric software, SPM2 (Wellcome Department of Cognitive Neurology, London, U.K.). Our previous computer data simulation analysis showed that parametric images of R1 generated by MRTM2 are accurate even when incorrect values of k′2 are used and the statistical quality of the parametric images is nearly identical to those estimated by 1TKA (20). Although R1 images may not be of primary interest for [11C]DASB, these images reflect relative blood flow and are useful for brain structure identification and image coregistration with MRI. In the present study, we took advantage of this property of R1 images to do parametric imaging in 2 steps. First, preliminary R1 images were generated with a k′2 value estimated by MRTM. Two ROIs for the cerebellum and thalamus were manually defined on the summed motion-corrected dynamic PET images, and k′2 was estimated with these 2 time–activity curves using MRTM and used to generate preliminary R1 images by MRTM2 with the cerebellum as a reference region. All MRTM (Eq. 2) and MRTM2 (Eq. 1) linear least-squares fitting was done with scan data weighted by (1/SD2), where SD of the data was estimated based on the noise-equivalent counts as described previously (21). Parametric images were generated with the pixelwise modeling software PMOD 2.5 (PMOD group) (22), installed on a personal computer workstation (Dell Computer Co., 1.7-GHz Pentium IV/1-GB RAM running Windows 2000, Microsoft Co.).
In the second step, the subject's MR images were coregistered to the preliminary R1 images in SPM2. Then, these 2 image sets were fused using an image fusion tool in PMOD. Several anatomic ROIs were manually defined on these fused images. These ROIs were placed on the motion-corrected dynamic data to obtain ROI time–activity curves from the cerebellum (1,131 ± 188 voxels; voxel size, 6.0 × 6.0 × 4.25 mm), raphe (87 ± 6 voxels), striatum (220 ± 73 voxels), thalamus (228 ± 90 voxels), frontal cortex (386 ± 52 voxels), temporal cortex (1,621 ± 331 voxels), and occipital cortex (1,578 ± 286 voxels). To minimize the variability of k′2 estimation by MRTM, a weighted (according to ROI size) mean k′2 value over raphe, thalamus, and striatum with the cerebellum as a reference region was used for parametric imaging of BP and R1 by MRTM2 (17).
For the retest data, preliminary R1 parametric images were generated as for the test data. Then, these preliminary R1 images of the retest study were coregistered to the R1 images of the test study. The alignment matrix generated to align the 2 R1 parametric images was then applied to the individual frames of the second (retest) dynamic PET scan. The MRTM2 parametric images of BP and R1 for the retest PET study were then generated as above except that the same ROIs defined for the test study were applied in the retest study.
After generation of MRTM2 parametric images of BP and R1, we obtained BP and R1 values of the test and retest study for the raphe, thalamus, striatum, frontal cortex, temporal cortex, and occipital cortex with the same ROIs defined for the test study. Finally, BP and R1 values were also estimated from the ROI time–activity curve data fitted by MRTM2, in contrast to voxelwise fitting in the parametric imaging.
Reproducibility Analysis
For parametric image–based BP and R1 measurements as well as those ROI time–activity curve–based measurements, the test–retest reproducibility was evaluated by calculating bias, variability, and reliability (intraclass correlation coefficient (ICC). The test–retest bias was calculated as the difference between the 2 measurements, expressed as a percentage of the value of the first measurement (100 × (retest − test/test)). The test–retest variability was calculated as the SD of the bias. The test–retest reliability of the 2 SERT binding parameter measurements was the ICC calculated according to the following equation (23): Eq. 3where MSBS and MSWS are the mean sum of squares between and within subjects, respectively, and k is the number of within-subject measurements, being 2 in the present study. This coefficient is an estimate of the reliability of the 2 sets of measurements and varies from 0 (no reliability) to 1 (total reliability). Comparison between MRTM2 parametric imaging method and ROI time–activity curve methods was made with Wilcoxon matched pairs test. Statistical significance was defined as P < 0.05. All statistical analyses were performed in STATISTICA (StatSoft, Inc.).
For voxel-by-voxel comparison between the test and retest studies, BP and R1 parametric images were spatially normalized to MNI T1 MR template provided by SPM2 using a coregistered T1 MR image of each subject. Subsequently, these images were smoothed with an isotropic gaussian filter to a final resolution of 12-mm full width at half maximum. Voxelwise comparison of BP and R1 between the test and retest studies was performed using SPM2, assuming a cutoff level of P < 0.05 (height threshold) and an extent threshold of 100 voxels.
RESULTS
The test–retest k′2 values estimated by MRTM are summarized in Table 1. There was no significant difference in mean k′2 values between test and retest. The test–retest k′2 bias (3%) and variability (6%) were both small, and the reliability (0.95) was excellent. [11C]DASB SERT BP was high in the raphe and hypothalamus, moderate in the thalamus and striatum, low in the cingulate gyrus, and absent in the cerebellum. Figure 1 shows test–retest parametric images of BP and R1 of a representative subject and illustrates excellent reproducibility of regional distribution of BP and R1 in the raphe, thalamus, and cingulate gyri.

Test (left column) and retest (right column) parametric images of BP (top row) and R1 (bottom row) of a representative subject. Th = thalamus; Ra = raphe; Hyp = hypothalamus; Cg = cingulate gyrus.
Summary of Test and Retest  Estimation
The test–retest results of regional BP and R1 estimated by MRTM2 parametric imaging method are summarized in Tables 2 and 3, respectively. Retest BP values were consistently lower than those of test values in all regions (a mean negative bias of ∼6%; P < 0.001). The test–retest BP variability was relatively small, ranging from 4% to 13%. High specific binding regions, including raphe, thalamus, and striatum, showed lower variability (∼5%) than low specific binding regions, including frontal, temporal, and occipital cortex (∼11%). The test–retest BP reliability (ICC, ρ) was moderate to high, ranging from 0.44 to 0.85 (Table 2).
Test–Retest Bias, Variability, and Reliability of BP Estimated by MRTM2 Parametric Imaging Method
Test–Retest Bias, Variability, and Reliability of R1 Estimated by MRTM2 Parametric Imaging Method
In contrast to BP, R1 values of all ROIs were not significantly different between test and retest (P = 0.843). The mean test–retest R1 bias across all ROIs was trivial (<0.1%). The test–retest R1 variability (∼5%) was excellent and ranged from 3% to 6%. The test–retest R1 reliability ranged from 0.58 to 0.95 and was slightly higher than that of BP (Table 3). Thus, the MRTM2 parametric imaging method showed excellent test–retest reproducibility of BP and R1, although there was a small negative bias for BP measurements and R1 reproducibility was overall slightly better than that of BP.
SPM comparison of BP and R1 images obtained by the test and retest studies using a height threshold of uncorrected P = 0.05 and an extent threshold of 100 voxels showed a decrease of BP values in the retest study in the hypothalamus, thalamus, striatum, raphe, left midtemporal gyrus, and anterior cingulated gyrus but no significant differences for R1 values (Fig. 2).
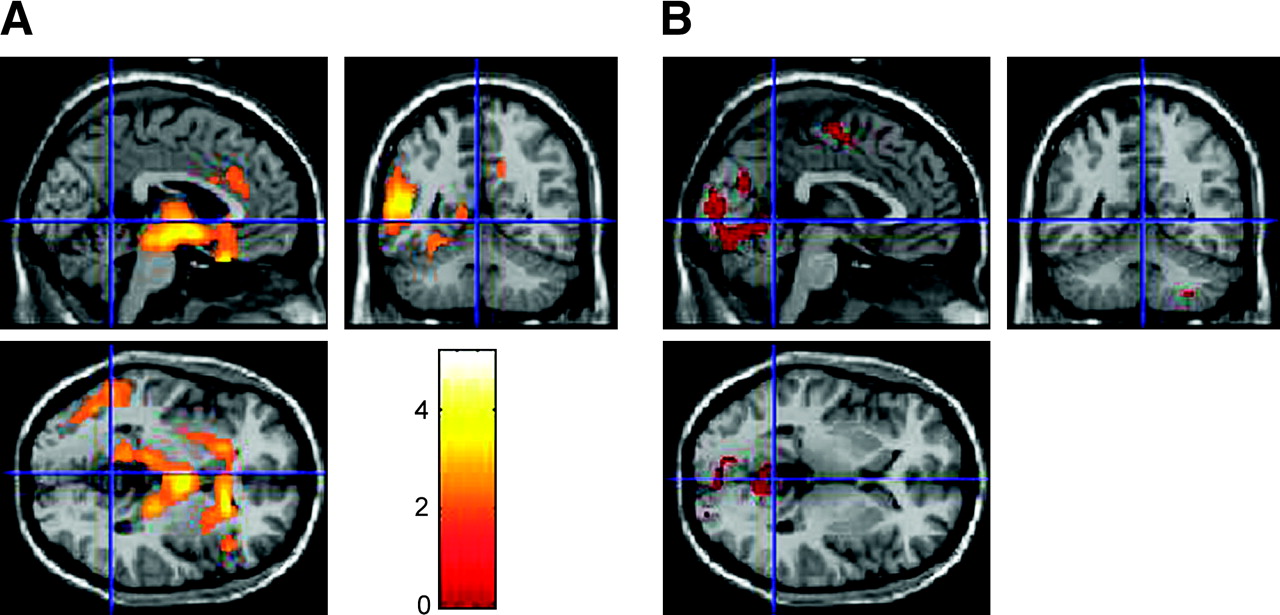
MRI superimposed with t-statistic maps obtained from SPM comparing test and retest studies using height threshold of uncorrected P = 0.05 and extent threshold of 100 voxels. (A) t-statistic maps comparing BP values of test and retest (test > retest). (B) t-statistic maps comparing R1 values of test and retest (test < retest).
The test–retest results of BP and R1 estimated by the ROI time–activity curve-fitting method by MRTM2 are summarized Tables 4 and 5, respectively. BP and R1 values estimated by the ROI time–activity curve-fitting method by MRTM2 were slightly lower (∼3% and ∼1%, respectively) than those estimated by the MRTM2 parametric imaging method (P < 0.001). However, the test–retest bias and variability of BP and R1 were similar for the 2 methods.
Test–Retest Bias, Variability, and Reliability of BP Estimated by ROI Time–Activity Curve-Fitting Method
Test–Retest Bias, Variability, and Reliability of R1 Estimated by ROI Time–Activity Curve-Fitting Method
DISCUSSION
We evaluated the test–retest reproducibility of [11C]DASB PET measurements of SERT BP and R1 in healthy volunteers using a computationally fast and noise-resistant parameter estimation method, MRTM2. The MRTM2 parametric imaging method showed excellent test–retest reproducibility of BP and R1 measurements, with variability ranging from 3% to 13%, but with a small negative bias (6%) for BP measurements. This demonstration of a reproducible PET outcome measure is critical and preliminary to the extension of [11C]DASB PET to clinical populations, such as depression and obsessive–compulsive disorders.
The MRTM2 parameter estimation requires a priori MRTM k′2 estimation using ROI time–activity curves. The test–retest reproducibility of MRTM k′2 estimation was excellent, where we used ROI size-weighted mean k′2 values over raphe, thalamus, and striatum with the cerebellum as a reference region. The k′2 variability of 6% in the present study was the same as that of our previous computer data simulation analysis (17).
In the present study, the test–retest variability of BP (ranging from 4% to 13%) and R1 (ranging from 3% to 6%) measurements by the MRTM2 parametric imaging method was excellent and generally consistent with the results of our previous simulation analysis with 5%–10% noise (17). Previously the variability of raphe BP estimation was significantly higher than that of the striatum, probably because of the shorter scanning duration used in the prior study (90 vs. 120 min). However, with the current 120-min scanning, the variability of raphe BP (7%) was only marginally higher than that of striatum (5%). With the short half-life of 11C (20.4 min), however, scanning up to 120 min results in higher statistical noise in the latter part of the data. To improve parameter estimations, therefore, in the current study we applied weighted least-squares estimations to account for noise-level differences in C(T) (24). The scan duration is an important factor to consider when evaluating a prospective new PET radioligand for human study. The scan duration needs to be long enough to obtain stable estimates of receptor-related parameters but short enough both to meet subject compliance and to avoid excessive distortion of the time–activity data by incremental noise (10,25). For [11C]DASB, lengthening of the scan duration from 90 to 120 min appears instrumental to improve parameter estimation at the voxel level for regions with high BP, such as the raphe, although Ginovart et al. (10) showed that a 90-min study is probably adequate for ROI-based [11C]DASB analyses.
In the current study, the retest BP was lower by 6% across all regions but R1 did not differ between test and retest. Most reproducibility studies of neuroreceptor imaging show no significant systematic differences in BP between test and retest scans. However, in contrast to our current study, in the studies reporting no systematic parameter estimation bias, test and retest scans were performed on separate days (26–28). We do not know the cause of the consistently lower BP values on retest compared with test scans, but it may have been the effect of residual carrier from the first scan, diurnal variation, or even the stress from the scanning procedure. As a worse-case scenario, the occupancy of SERT by residual carrier from the first injection can be estimated from the occupancy at time of peak uptake in the thalamus during the test scan. At the time of peak specific binding uptake in the thalamus (∼80 min after injection), the average specific binding concentration of tracer in thalamus was 0.8 ± 0.3 nmol/L. The density of SERT (maximum number of binding sites [Bmax]) in human thalamus has been estimated to be 12−24 nmol/L (29,30). Thus, at the time of maximal brain uptake, [11C]DASB is estimated to occupy 3%–6% of all SERT. In addition, by the time of the retest scan, about half of the carrier would have washed out of the brain. Thus, residual carrier would have caused only a minimal component of the 6% negative bias. Other possible causes include a diurnal variation in SERT levels (since the test scan was always in the morning and the retest in the afternoon) (31,32) or possibly the effect of stress of participating in the first scan. Acute stress activates a series of physiologic systems as part of the adaptive response that is characterized by elevation of circulating cortisol and modulation of serotonergic neuronal activity (33,34). Tafet et al. reported that the elevated cortisol induced by stress increases serotonin uptake owing to promotion of synthesis of the SERT (35). However, we do not know the relationship between the regional change of serotonergic neuron and the quality of acute stress. Further investigation with [11C]DASB PET may be interesting in this regard.
The ICC is a measure of the correlation between the values obtained with 2 methods within the same subject (23). It has been used as an index of the reliability of test–retest measurements (26,36–39). The ICC combines information on the systemic difference between methods (test and retest) and that of the random measurement variation. As apparent from Equation 3, given the same test–retest variability (MSWS), the ICC of a measure with a large intersubject variability (MSBS) will be higher than that of a measure with a small intersubject variability. For example, the ICC for raphe was only moderate (0.5) in the raphe, despite the small test–retest variability of 5%. This ICC value of only 0.5 is caused by the small intersubject BP variability (coefficient of variation = 100 × SD/mean) of 8% for raphe as opposed to the large intersubject BP variability of 28% for occipital cortex, for example, where the ICC was 0.8 and the test–retest variability was 13% (Table 2).
Frankle et al. reported, in an abstract, the test–retest variability and ICC of BP measured with [11C]DASB using ROI but not parametric images (39). These authors obtained an arterial input function and used a constrained 2-tissue compartment model with nonlinear fitting. The test–retest variability of BP (10% for central regions and 25% for neocortical regions) was higher, but the test–retest reliability of BP (ICC, 0.94∼0.97) was better than that of our present study. The mean injected dose of radiopharmaceutical (518 MBq) was lower than ours (703 MBq). In addition to differences in analytic method, different ROI sizes may have caused differences in the variability and reliability. In any case, parametric analysis has several advantages over the ROI approach, including the use of SPM to identify alterations in receptor binding in all areas of the brain in 2 groups of subjects.
In the present study, BP and R1 values estimated by the ROI time–activity curve-fitting method were slightly lower than those by the parametric imaging method. Nevertheless, both methods showed equally excellent reproducibility of BP and R1 measurements. Here, the difference between the 2 methods relates to the difference in data noise at the time of fitting. In parametric imaging, MRTM2 fitting is done at a voxel noise level, whereas in ROI time–activity curve estimation, MRTM2 fitting is done at a ROI noise level. Therefore, individual voxel BP or R1 estimations will have a larger variability than that of ROI BP or R1 estimations. However, the results of the present study show that BP or R1 estimations by MRTM2 parametric imaging for a ROI obtained by averaging voxel BP or R1 values within the ROI have the same robustness as those obtained by MRTM2 fitting of the ROI time–activity curve.
Finally, we did not perform invasive 1TKA BP and R1 estimations in the present study. In our prior publication, MRTM2 BP and R1 estimations were very close to those of 1TKA that required metabolite-corrected arterial input functions (17). However, MRTM2 estimations were not identical to those of 1TKA, with opposing effects. First, MRTM2 requires a priori k′2 estimation by MRTM. The inaccuracy of k′2 estimation, therefore, can increase the variability of MRTM2 estimations. Second, 1TKA estimation requires metabolite-corrected arterial plasma data. Therefore, any error in blood data could increase the variability of 1TKA estimations. Thus, the only way to evaluate which method—noninvasive MRTM2 or invasive 1TKA—is more reproducible would have been to include the 1TKA method in the present study design.
CONCLUSION
Our results suggest that [11C]DASB parametric imaging of BP and R1 by noninvasive MRTM2 and without arterial sampling is a reproducible and reliable method for PET of SERT.
Acknowledgments
We gratefully acknowledge the NIH Clinical Center radiochemistry staff (directed by Michael Channing, PhD) and imaging staff (directed by Peter Herscovitch, MD) for the successful completion of this study.
References
- Received for publication May 29, 2005.
- Accepted for publication November 2, 2005.


Jump to section
Related Articles
Cited By...
- Test-Retest Reliability of the SERT Imaging Agent 11C-HOMADAM in Healthy Humans
- In Vivo Evaluation of 11C-DASB for Quantitative SERT Imaging in Rats and Mice
- PET Imaging of High-Affinity {alpha}4{beta}2 Nicotinic Acetylcholine Receptors in Humans with 18F-AZAN, a Radioligand with Optimal Brain Kinetics
- The 5-HT1A receptor and 5-HT transporter in temporal lobe epilepsy
- 11C-Dihydrotetrabenazine PET of the Pancreas in Subjects with Long-Standing Type 1 Diabetes and in Healthy Controls
- Test Retest Reproducibility of 18F-MPPF PET in Healthy Humans: A Reliability Study
- Imaging the serotonin transporter during major depressive disorder and antidepressant treatment: 2005 CCNP Young Investigator Award Paper
- Effects of early life stress on [11C]DASB positron emission tomography imaging of serotonin transporters in adolescent peer- and mother-reared rhesus monkeys.