


Abstract
18F-fluoromisonidazole PET, a noninvasive means of identifying hypoxia in tumors, has been widely applied but with mixed results, raising concerns about its accuracy. The objective of this study was to determine whether kinetic analysis of dynamic 18F-fluoromisonidazole data provides better discrimination of tumor hypoxia than methods based on a simple tissue-to-plasma ratio. Methods: Eleven Dunning R3327-AT prostate tumor-bearing nude rats were immobilized in custom-fabricated whole-body molds, injected intravenously with 18F-fluoromisonidazole, and imaged dynamically for 105 min. They were then transferred to a robotic system for image-guided measurement of intratumoral partial pressure of oxygen (Po2). The dynamic 18F-fluoromisonidazole uptake data were fitted with 2 variants of a 2-compartment, 3-rate-constant model, one constrained to have K1 equal to k2 and the other unconstrained. Parametric images of the rate constants were generated. The Po2 measurements were compared with spatially registered maps of kinetic rate constants and tumor-to-plasma ratios. Results: The constrained pharmacokinetic model variant was shown to provide fits similar to that of the unconstrained model and did not introduce significant bias in the results. The trapping rate constant, k3, of the constrained model provided a better discrimination of low Po2 than the tissue-to-plasma ratio or the k3 of the unconstrained model. Conclusion: The use of kinetic modeling on a voxelwise basis can identify tumor hypoxia with improved accuracy over simple tumor-to-plasma ratios. An effective means of controlling noise in the trapping rate constant, k3, without introducing significant bias, is to constrain K1 equal to k2 during the fitting process.
The presence of hypoxia in tumors is associated with radio- and chemotherapy resistance, enhanced angiogenesis and metastatic potential, and, in general, poor clinical outcome (1–4). However, direct measurement of tumor oxygenation using oxygen microelectrodes is subject to several limitations (5,6). Direct measurement is restricted to easily accessible lesions, and the limit on the number of measurements that can practically be made generally results in undersampling of the tumor. Moreover, such measurements cannot distinguish between necrotic and viable but hypoxic intratumoral regions. A noninvasive imaging method of identifying tumor hypoxia has therefore been a long-sought goal.
Of the various nuclear, MRI, and optical methods that have been devised to image tumor hypoxia, one of the most extensively evaluated clinically is 18F-fluoromisonidazole PET. 18F-fluoromisonidazole is a 2-nitroimidazole compound, subject to bioreduction by intracellular nitroreductases. In the presence of sufficient intracellular O2, the nitroimidazole is back-oxidized to the parent compound, which readily diffuses from the cell. Otherwise, further irreversible reductions occur and the reactive metabolites covalently bind to intracellular macromolecules, leading, in the case of 18F-fluoromisonidazole, to accumulation of the 18F radiolabel within the hypoxic tissue (7,8).
In humans, 18F-fluoromisonidazole is metabolized slowly and clears from the body with a half-time of approximately 6 h. It is freely and homogeneously distributed, achieving tissue-to-plasma (T:P) ratios of about unity in most normal tissues. Koh et al. (7) proposed that an 18F-fluoromisonidazole T:P ratio greater than 1.4 at 2 or more hours after injection is indicative of viable hypoxic tissue. Also, several in vitro studies show a near-binary pattern of 18F-fluoromisonidazole uptake for O2 levels above or below a defined threshold (9), supporting the use of a simple ratio for clinical imaging. However, a recent study examining voxelized tumor-to-muscle ratios (similar to T:P) failed to show a correlation with spatially registered Eppendorf partial pressure of oxygen (Po2) measurements (10).
One possible explanation for this negative finding is that T:P ratios for 18F-fluoromisonidazole change over time in a perfusion-dependent manner. Low blood perfusion reduces the rate of 18F-fluoromisonidazole supply, and thus uptake in such regions may achieve a 1.4 T:P threshold only at later times, if at all. In fact, neither the time after injection nor the threshold ratio recommended by Koh et al. was defined with reference to hypoxic tissue. Instead, these were based on normal-tissue equilibration rates and the level of noise in the images, such that normoxic voxels would be reliably below the defined threshold.
An alternative approach is to use pharmacokinetic modeling to estimate a parameter more directly dependent on oxygen levels. Several models describing the uptake of 18F-fluoromisonidazole have been proposed (11–14), requiring between 4 and 7 free parameter values to be determined during the data-fitting process. Three of these models (12–14) have been used to generate parametric images, but no one has yet validated the pertinent oxygen-dependent parameter against direct Po2 probe measurements.
Our goal in this work was to determine whether pharmacokinetic modeling of 18F-fluoromisonidazole uptake can provide an oxygen-dependent rate constant that is better than T:P ratio at demarcating hypoxic and nonhypoxic regions within tumors. The studies were conducted on nude rats bearing subcutaneous tumors. Robotically controlled Po2 probe measurements were taken at points spatially registered to 18F-fluoromisonidazole dynamic PET image data. In a subset of tumor-bearing animals, the hypoxia marker pimonidazole was coadministered with 18F-fluoromisonidazole and the perfusion marker Hoechst 33342 administered shortly before sacrifice. Subsequently, autoradiographic (18F-fluoromisonidazole) and fluorescence (pimonidazole, Hoechst 33342) images of tumor tissue sections were acquired and compared.
MATERIALS AND METHODS
Animal Subjects
All animal experiments and procedures were approved by the Memorial Sloan-Kettering Cancer Center Institutional Animal Care and Use Committee in compliance with National Institute of Health regulations on the research use of rodents.
Eleven male nude rats (average weight, ∼300 g) were injected subcutaneously in the left hind limb with approximately 106 Dunning R3327-AT prostate tumor cells. Imaging was performed between 2 and 3 wk after tumor inoculation. Substantial hypoxic tumor volumes were found in tumors larger than 2,000 mm3, calculated as
Animals were anesthetized using a mixture of isoflurane (5% induction, 1.5% maintenance) and air for the entire duration of the study and were euthanized at its completion in accordance with the guidelines of the Institutional Animal Care and Use Committee. Throughout the study, animals were kept immobilized in a prone position in a custom-fabricated, animal-specific foam mold (Soule Medical) within a hemicylindric acrylic couch (15). Tumors from 4 rats were excised after sacrifice for further analysis.
Small-Animal PET
18F-fluoromisonidazole (specific activity, 370 MBq/μg) was prepared according to the method of Grierson et al. (16) by the Cyclotron and Radiochemistry Service at Memorial Sloan-Kettering Cancer Center. Animals were positioned in a small-animal scanner (microPET Focus 120; Concorde Microsystems) with tumors centered in the field of view.
Before the 18F-fluoromisonidazole injection, a 2-min static PET image was acquired of the rat on the couch together with a removable registration plate (Fig. 1A) containing 4 wells each loaded with 10 μL of an approximately 370 kBq/mL (10 μCi/mL) solution of 18F. This image was used to spatially register the subsequently acquired PET images with the robotically guided Po2 probe measurements as described elsewhere (17–19).

(A) Anesthetized rat immobilized in custom-fabricated foam mold, positioned on robot platform. Registration plate is centered over rat tumor. (B) Top image is rat tumor with OxyLite probe sampling Po2 along predefined track. Bottom image is target region for sampling Po2 as defined on 5-min static PET image.
The animals were then injected via the tail vein with approximately 55 MBq (∼1.5 mCi) of 18F-fluoromisonidazole and imaged dynamically over 105 min, beginning at the time of injection. Dynamic images were subsequently reconstructed offline using maximum a posteriori estimation into a 128 × 128 × 95 matrix (voxel dimensions, 0.87 × 0.87 × 0.79 mm) and time-binned into 2 × 6, 4 × 12, 1 × 60, 9 × 120, 10 × 180, and 11 × 300 s frames.
Immediately after the dynamic acquisition, a 5-min static PET scan was acquired and reconstructed. This scan was used for image guidance of the Po2 probe measurements.
PET–to–Robot Coordinate Registration
On completion of imaging, the couch with the anesthetized immobilized animal in place was transferred to the image-guided robotic system. The initial and final static PET scans (for registration and target definition, respectively) were loaded into the robot application software (3D Slicer; www.slicer.org, Engineering Research Center for Computer Integrated Surgical Systems and Technology, Johns Hopkins University). This registration process and its accuracy are described in detail elsewhere (17–19).
Po2 Measurements
Sets of trajectories (vertical tracks) were defined on the late static PET image (Fig. 1B). The robot then moved the Po2 probe (OxyLite 4000; Oxford Optronix) to a location directly above each trajectory. A needle was used to puncture the skin and fascia covering the tumor. The probe was then advanced through an indwelling cannula (used to improve mechanical stability) until contact was made. Subsequent probe penetration of the tissue was performed under robot control. Measurements of Po2 were performed at 0.5-mm intervals along each probe trajectory (initial advance of 0.8 mm followed by 0.3-mm retraction to relieve pressure at the probe tip). This process was repeated for each defined trajectory. After the last Po2 measurement, animals were euthanized in place by isoflurane overdose (∼3 h after injection).
Tissue Processing for Microscopic Analysis
At the time of 18F-fluoromisonidazole administration, 4 animals were coinjected with the hypoxic cell marker pimonidazole hydrochloride ([1-[(2-hydroxy-3-piperidinyl)propyl]-2-nitroimidazole hydrochloride; 20 mg/mL in normal saline; 80 mg/kg; Chemicon International). These same animals were also injected with the fluorescent dye Hoechst 33342 (5 mg/mL in normal saline; 15 mg/kg; Sigma-Aldrich) via the tail vein 1 min before sacrifice. Immediately after sacrifice, a set of fiduciary angiocatheters was inserted into the tumor perpendicular to the coronal imaging plane. The tumor was then excised, frozen on dry ice, embedded in optimal cutting medium (OCT 4583; Sakura Finetek) and mounted on the planchet of a Microm HM500 cryostat microtome (Microm International GmbH) such that the plane of tissue sections was cut parallel to the PET coronal imaging plane. The angiocatheter needles were then completely retracted, leaving only the plastic sleeve in place. Multiple sets of contiguous 10-μm-thick tissue sections were acquired at 0.5-mm intervals within the tumor block using the microtome digital readout to track perpendicular distance.
Autoradiography and Fluorescence Images
Digital autoradiograms of 18F-fluoromisonidazole were obtained by placing a tumor section from each contiguous set against a Fujifilm BAS-MS2325 imaging plate (Fuji Photo Film Co.) in a light-tight cassette. Plates were exposed overnight and read by a Fujifilm BAS-1800II bioimaging analyzer (Fuji Photo Film Co.), generating digital images with pixel dimensions of 50 × 50 μm.
Images of the distributions of pimonidazole and Hoechst 33342 were obtained after completion of 18F-fluoromisonidazole digital autoradiogram exposures. To eliminate possible misregistration, we used the same tumor sections as were used for digital autoradiography. Sections were fixed in a 4% paraformaldehyde solution for 12 min, followed by incubation in Superblock/PBS (Thermo Scientific) for 30 min at room temperature. Immunofluorescence staining for pimonidazole was performed as described previously (20).
Images of tumor sections were acquired at 100× magnification using a fluorescence microscope (Nikon Diaphot 300) equipped with a computer-controlled, motorized stage and digital camera for image capture (Photometrics Coolsnap EZ). Pimonidazole and Hoechst 33342 were imaged using green and blue filters, respectively. Composite images of whole tumor sections were generated by stitching together individual microscopic images using Image-Pro software (Image-Pro Plus, version 7.0; MediaCybernetics).
Pharmacokinetic Analysis
Input Function Determination
Amira 5.2.2 (Mercury Computer Systems) was used for initial dynamic small-animal PET image visualization and processing. Image-derived input functions were obtained from a volume of interest (VOI) placed over the proximal end of the ventral caudal artery (identified from a summed image of the first 24 s of the study) for each individual rat. Image-derived input functions were corrected for partial-volume effects (21). A recovery coefficient (RC) of 0.302 was estimated by convolving the known small-animal PET point spread function (full width at half maximum of 1.8 mm) with a published mean artery diameter of 0.7 mm (22,23). This RC was used to obtain the corrected activity concentration for each rat, derived according to:
The image-derived partial-volume–corrected input function was then fit to a heuristically derived sum of a series of functions, each consisting of the product of a power and an exponential function (Eq. 2). In this equation, Cb(t) is the activity concentration in the blood as a function of time, t. The remaining terms represent fitting parameters without particular interpretation. The number of functions summed together when performing the fit was selected according to the Bayesian information criterion.
Voxelized Tumor Kinetic Parameters
Whole-tumor VOIs were delineated from a summed image of the last 20 min of the dynamic PET data. Each frame of the dynamic data was smoothed using a 1.2-mm 3-dimensional gaussian. Kinetic parameters, K1 (mL min−1 g−1, equivalent to min−1 assuming unit density tissue), k2 (min−1), and k3 (min−1) were estimated for each voxel within the tumor VOI by fitting an irreversible 2-tissue-compartment model using the Voxulus software package (Phillips Research Europe). Two variants of this model were examined. In one variant, k2 was constrained to be equal to K1 (assuming unit density tissue), leaving just 2 free parameters (K1, k3) to be determined during the fit. In the other variant, the 3 rate constants were unconstrained. These 2 variants will henceforth be referred to simply as the constrained and unconstrained models, respectively.
The Voxulus software was previously validated by Wang et al. (14). The model used here differs slightly from that used by Wang et al. in that the current model does not include a contribution from the vasculature, as our unpublished studies on these tumors show this space to be negligible and leaving it in would likely have reduced the robustness of the other parameter values because of covariance among the parameters.
The irreversible 2-tissue-compartment model is described by the following equations:
The fitting procedure involved first segmenting the tumor into 4 clusters determined by a k-means clustering. For each of these mean profiles, the kinetic rate constants were estimated using a Levenberg–Marquardt least-squares optimization. These values, in turn, were used as the initial parameter values in a second round of model fitting, this time applied to individual voxel time profiles. The resultant rate constants for each voxel were then arranged so as to form a set of parametric images, K1, k2, and k3, for each tumor. The steady-state uptake rate constant Ki = K1k3/(k2 + k3) and T:P ratio parametric images were also calculated. Bayesian information criterion values were calculated for each voxel when fit by each of the 2 models.
Comparison of Parametric Images and Po2 Probe Measurements
Parametric image voxels along the Po2 probe trajectories were identified and their numeric values recorded. Because of the difference in distance between Po2 probe measurements (0.5 mm) and the PET voxel size (0.79 mm), the Po2 data were resampled at the voxel interval. This was done by averaging neighboring Po2 measures along the track, weighted by the small-animal PET point-spread function. Corresponding pairs of image voxel and resampled Po2 values were tabulated.
A receiver-operating-characteristic analysis was applied to these data using the Youden index (24) to compare the relative utility of the various parameters (k3, Ki, T:P ratio) in distinguishing hypoxic from nonhypoxic tissues, taking measured Po2 as the reference standard. Data points for which the Po2 was below a given cut point and the parametric variable (e.g., k3) above a given cut point were defined as true-positives, or TPs (i.e., positive by both measures). Conversely, points above the Po2 cut point and below the parameter cut point were defined as true-negatives, or TNs. Similarly, false-positives (FPs) and false-negatives (FNs) were defined as, respectively, both below or both above the respective cut points. The Youden index, J, may be defined as the maximal difference between TP and FP rates encountered along the receiver-operating-characteristic curve. Thus, for any given Po2 cut point, the Youden index selects a corresponding “optimal” parameter cut point. We plotted the Youden index as a function of Po2 cut point. The location of the maxima in this curve corresponds to candidate Po2 cut points where discrimination of hypoxic and nonhypoxic voxels is maximized. When comparing the relative utility of the parameters (k3, Ki, T:P ratio), we made use of the SE in the Youden index, calculated as:
RESULTS
Fits of the unconstrained and constrained models had similar rate constant estimates, and their respective Bayesian information criterion values showed no clear model preference, as illustrated by a representative voxel fit in Figure 2. Also depicted in Figure 2 is the associated partial-volume–corrected input function and fit for this same animal. K1 and k2 values calculated by the unconstrained model were highly correlated (r2, ∼0.6), with a slope close to unity (0.9). Thus, constraining K1 equal to k2 would not be expected to introduce significant bias. The main apparent difference between the models was reduced noise in the parametric images for the constrained case, presumably a consequence of the reduced covariance.
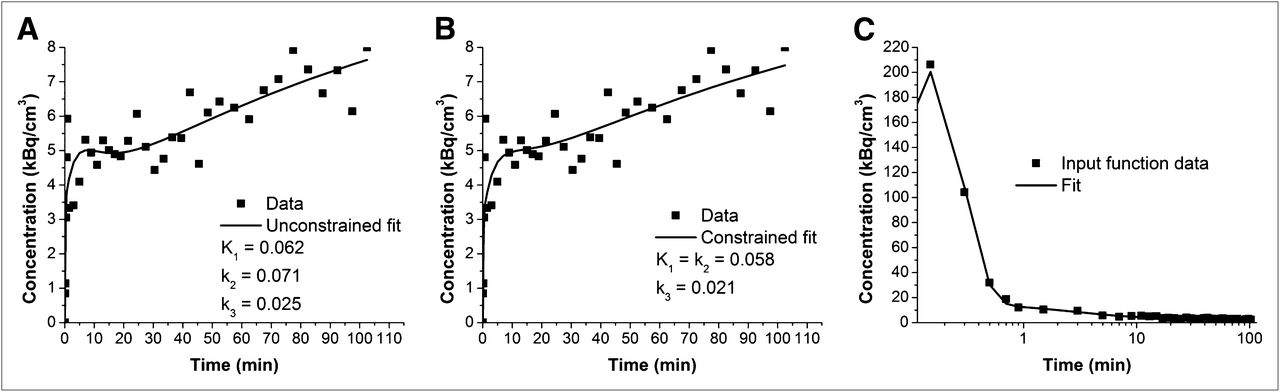
Plots of data and fitted curve from single voxel of individual rat and corresponding partial-volume–corrected input function and fit from this same animal. (A) Data and fitted curve obtained using unconstrained model. (B) Data and fitted curve obtained using constrained model. (C) Partial-volume–corrected blood data and fit plotted on log linear scale such that peak of input function can be seen.
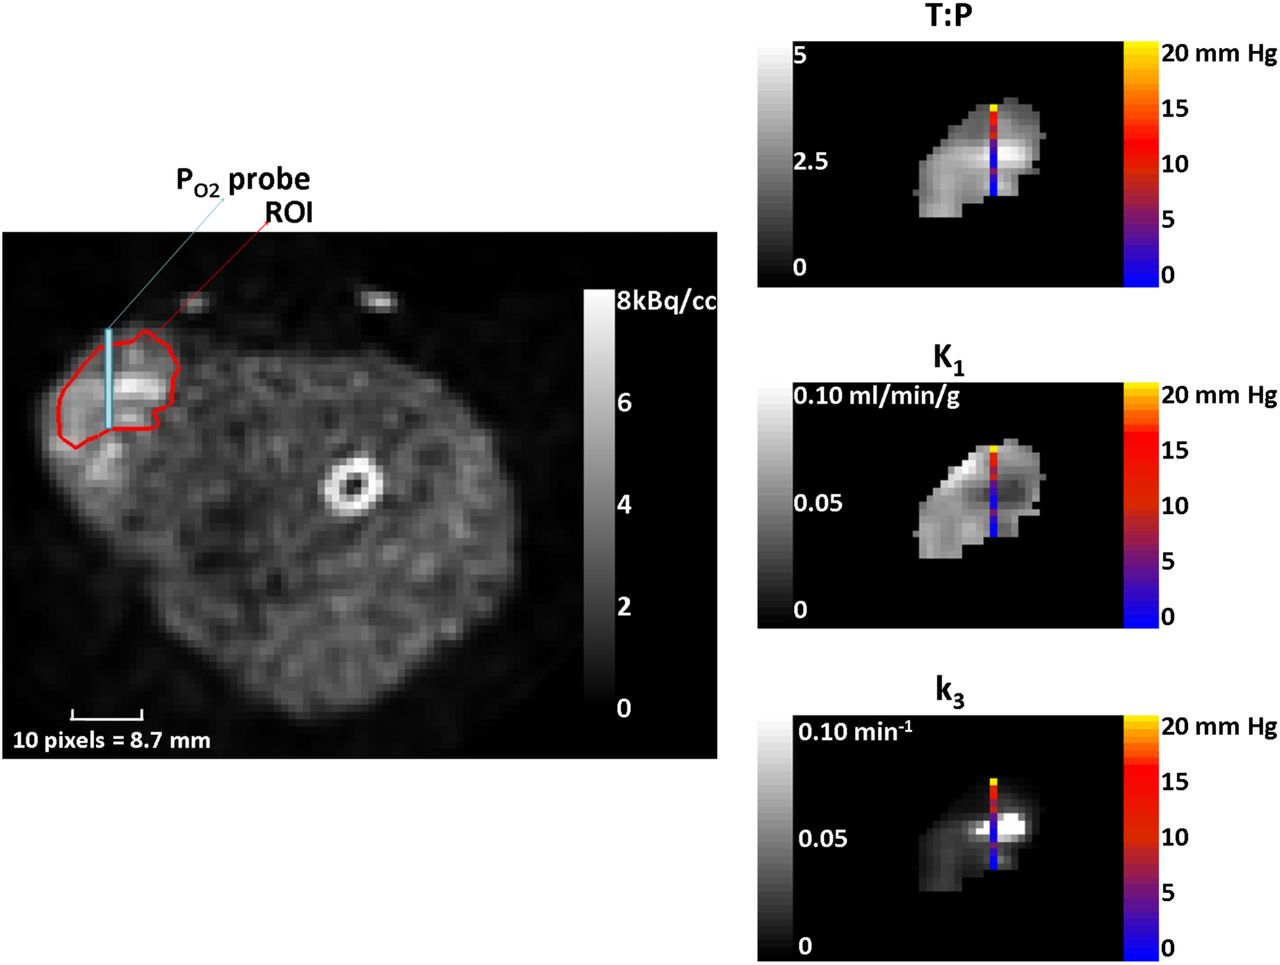
A transaxial image, from a single animal, summed over the last 40 min of image data is shown with overlays of the tumor ROI and a Po2 probe trajectory in Figure 3. Also shown are the associated parametric images (T:P ratio, K1, and k3) in gray scale along with color overlays describing the measured Po2 levels. Of note in these images is the general negative spatial correlation between the K1 and k3 maps and the broad correspondence between low Po2 and high k3/low K1.

On left is image averaged over last 40 min, with ROI used to segment data for kinetic analysis overlaid in red and Po2 probe trajectory overlaid in blue. Images on right are voxelwise kinetic maps for same slice and ROI shown on left. Overlaid onto each of these maps are corresponding Po2 concentration measurements made at each of those corresponding voxel locations.
We also observed visually good spatial correlation between pimonidazole immunofluorescence and the 18F digital autoradiography (though the degree varied among tumors) and an apparent inverse spatial relationship between pimonidazole and Hoechst 33342 fluorescence (Fig. 4). These results are in broad concordance with the relationships seen between parametric images of Figure 3.

Registered histology images from single slice of rat tumor from each of 4 rats from which histology was obtained. Top row (blue-stained sections) shows histologic images of Hoescht 33342. Middle row (green-stained sections) shows histologic images of pimonidazole. Bottom row shows digital autoradiographs (DAR) of 18F-fluoromisonidazole.
Figure 5 shows the results of the receiver-operating-characteristic analyses in terms of the Youden indices plotted against the Po2 cut point for the 3 potential hypoxia-discriminating parameters k3, Ki, and T:P ratio, where larger Youden index values indicate better discrimination. While interpreting the results of this analysis, the reader should note that random noise added to a given discriminating parameter will tend to decrease its Youden index values. Thus, the relatively noise-free T:P ratio outperforms the unconstrained model’s Ki, which in turn outperforms the still noisier k3 parameter (Fig. 5A). However, for the parameters determined by the constrained model this order is reversed such that now k3 outperforms Ki and both do better than T:P ratio (Fig. 5B) and better than their unconstrained counterparts. Therefore, even though noisier than either Ki or T:P ratio, the constrained model k3 outperforms them in demarcating hypoxic from nonhypoxic tissue.

Plots of Youden index vs. Po2 threshold: unconstrained model (A) and constrained model (B).
It is also clear from these plots that there is no obviously optimal Po2 cut point that maximizes the discrimination between hypoxic and nonhypoxic tissue, although local maxima appear at about 0.3 mm Hg and 3.4 mm Hg. The lack of a clear peak, we believe, is due to the high noise (±0.7 mm Hg) in the Po2 measurements at these low levels (25). The local maximum at 3.4 mm Hg corresponds to the Po2 value providing half-maximal radiobiologic hypoxic protection (26) and is consistent with various in vitro measurements of 2-nitroimidazole binding (9). Therefore, for purposes of illustrative and statistical comparison, we selected 3.4 mm Hg as a discriminatory cut point defining tissue hypoxia. A statistical comparison of the Youden index values at this Po2 threshold shows that k3 of the constrained model outperforms T:P ratio (P = 0.138) and is significantly better than both k3 and Ki of the unconstrained model (P < 0.001 and P = 0.011, respectively) but not significantly better than constrained Ki.
Figure 6 shows scatterplots of k3 versus K1 and of each potential image-derived hypoxia-discriminating parameter (k3, Ki, T:P ratio) versus Po2 for data pooled from all 11 tumors. All these plots show negative relationships. The negative correlation between k3 and K1 provides some measure of general support for the observations of Figures 3 and 4 of an inverse relationship between hypoxia and perfusion. The parameter cut points (thresholds) shown as red lines in Figures 6B–6D are the values chosen by the Youden indices for a Po2 cut point of 3.4 mm Hg defining tissue hypoxia. Also shown in Figure 6D is the T:P threshold of 1.4 (blue) recommended by Koh et al. (7) for discriminating tissue hypoxia.
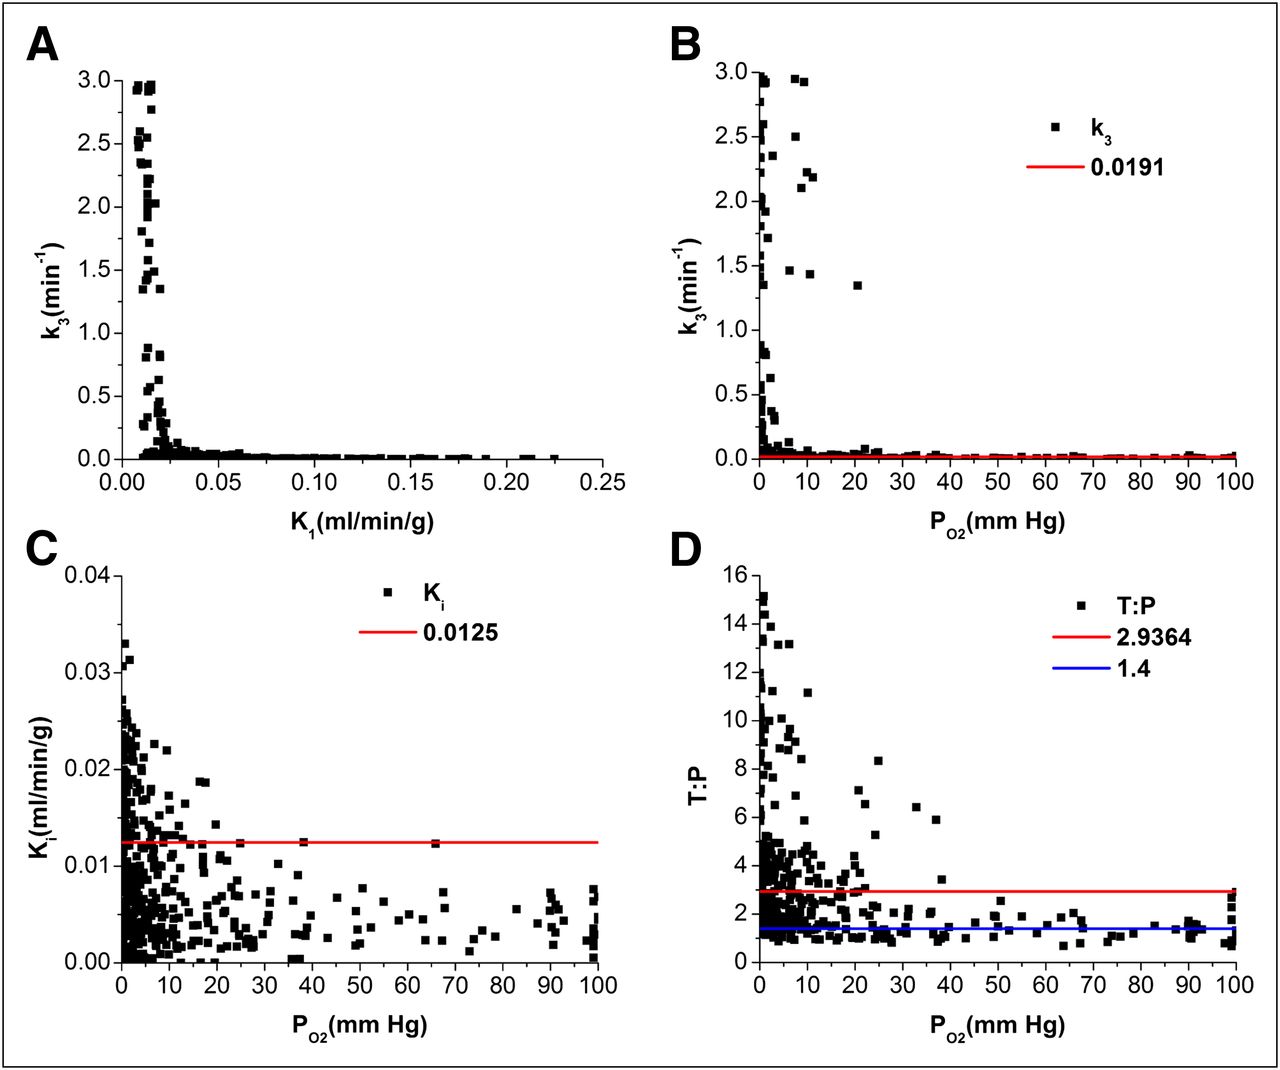
Scatterplots of kinetic parameters estimated from constrained model (K1 = k2) vs. corresponding Po2 measure. Red lines define optimal cut points selected by Youden indices. (A) k3 vs. K1. (B) k3 vs. Po2. (C) K1 vs. Po2. (D) T:P ratio vs. Po2; blue line shows standard 1.4 threshold commonly applied in assessment of hypoxia.
DISCUSSION
In this work, we directly compared the Po2 levels measured with an accepted reference standard device (OxyLite probe) against voxelwise measures of 18F-fluoromisonidazole uptake. Although similar correlative studies have been undertaken by others (10,27), to our knowledge ours is the first comparison using pharmacokinetic model–derived metrics. This is an important advance over previous work because the pharmacokinetic model allowed us to tease out a parameter, k3, that is directly dependent on the oxygen level, effectively removing the flow- and transport-related confounds present in other uptake metrics (e.g., T:P ratio, Ki, and standardized uptake value).
The results of the analysis suggest that the k3 parameter provides the best discrimination of tissue hypoxia in terms of producing the greatest Youden index from receiver-operating-characteristic analysis. However, this was true only when the kinetic model was constrained by setting K1 = k2, effectively removing a degree of freedom from the data-fitting process. In biologic terms, this constraint is equivalent to assuming that the transmembrane transport of 18F-fluoromisonidazole is a passive diffusion process and that, in the absence of bioreductive metabolism, the steady-state intracellular and extracellular concentrations would be equal. This assumption is consistent with the typical observation of T:P ratios for 18F-fluoromisonidazole of approximately 1 in most normal tissues, seen both clinically and in our animal studies.
Although our analyses suggest that k3 is the optimal discriminator of tissue hypoxia (when noise in its measure is sufficiently limited), the correspondence was far from perfect. Specifically, there were low k3 values in tissue voxels for which correspondingly low Po2 measurements were made. One possible explanation is that k3 can be high only in viable hypoxic tissue and not in regions of necrosis (28). This explanation is plausible, as bioreduction of the parent 18F-fluoromisonidazole molecule requires a certain level of biochemical functionality (nitroreductase activity) more likely to be found in intact cells and is consistent with the enhanced concentration of pimonidazole adducts typically seen in perinecrotic regions of tumor tissue sections but not in regions of frank necrosis. Another possible explanation for imperfect correspondence between k3 and Po2 is spatial misregistration of probe- and image-based values due to deformation of the probe trajectory (29). The OxyLite probe is a thin (200-μm diameter), flexible optic fiber and may deviate from the plotted trajectory given an alternative “path of least resistance.”
The results of this study, exemplified by both Figure 3 and Figure 6, show that the k3 parametric image can provide a sharp, almost binary, representation of tumor hypoxia. This representation is consistent with the typically rapid increase in 18F-fluoromisonidazole binding rate over a limited Po2 range seen with cells in culture. In contrast, other metrics such as Ki or T:P ratio show a more subtle gradation, partly related to the confounding influences of tracer delivery or transport.
In a commonly used approach, a T:P ratio above 1.4 later than 2 h after injection is taken to indicate hypoxia, and in several studies this criterion was used to conclude that some hypoxic tumors were rendered normoxic after radiotherapy (30–33). However, meaningful correlations with tumor progression or other measures of outcome have not been forthcoming. This, combined with a lack of correspondence between 18F-fluoromisonidazole uptake and direct measures of Po2, has cast some doubt on the utility of 18F-fluoromisonidazole as a hypoxia marker (10,34–36). Previous studies by our group have shown that interventions that affect vascular functionality can lead to a dissociation between tumor hypoxia and 18F-fluoromisonidazole net uptake (37), indicative of a 2-fold problem associated with using a static net uptake metric. First, the slow rate of 18F-fluoromisonidazole blood clearance and its high distribution volume leads to a high background level of 18F-fluoromisonidazole in normoxic tissues. Second, reduced or compromised perfusion in hypoxic regions can result in 18F-fluoromisonidazole uptakes that are not significantly above (and may in fact be below) normoxic tissue levels. Consistent with this view is the suggestion that it would be better to measure 18F-fluoromisonidazole uptake at longer times after injection (4 or more hours) (38). Such longer times would allow greater diffusion into poorly perfused regions, greater time for irreversible binding, and greater clearance from normoxic tissue leading to improved hypoxic contrast. Conversely, waiting an additional 18F half-life would mean reduced counts and greater noise in the images, thus increasing the threshold required to define a significant difference above background.
The alternative approach of kinetic modeling of 18F-fluoromisonidazole uptake, first suggested by Thorwarth (13), provides a means of distinguishing regions where 18F-fluoromisonidazole is accumulating (hypoxia) from those where it is destined to clear (normoxia). The results of the current study provide preliminary proof of the concept that this can improve the correspondence between hypoxia image and Po2 level.
As is the case with all pharmacokinetic compartmental modeling, it is important to not mix together tissues having differing kinetics when applying the model. In the case of 18F-fluoromisonidazole, mixing tissues having similar perfusion and transport properties but differing in k3 would result in an averaged k3 value. Although it is perhaps reasonable to assume perfusion and transport are roughly homogeneous within a voxel-sized region, this is almost certainly not the case for many whole-tumor regions. Therefore, it is important that pharmacokinetic modeling be applied on a voxelwise basis or, at minimum, that subregions be defined on the basis of similarity in the shape of tissue uptake curves.
CONCLUSION
Voxelwise estimates of k3 are better at identifying low tissue oxygen levels than are other measures of 18F-fluoromisonidazole uptake. An effective means of controlling noise in k3, without introducing significant bias, is to constrain K1 to be equal to k2 during the fitting process.
DISCLOSURE STATEMENT
The costs of publication of this article were defrayed in part by the payment of page charges. Therefore, and solely to indicate this fact, this article is hereby marked “advertisement” in accordance with 18 USC section 1734.
Acknowledgments
We gratefully acknowledge the contributions of Valerie Longo and the technical services provided by the Memorial Sloan-Kettering Cancer Center Small-Animal Imaging Core Facility. This work was supported in part by NIH grant P01 CA115675 on Hypoxia Imaging, NIH Small-Animal Imaging Research Program (SAIRP) grant R24 CA83084, and NIH Center grant P30 CA08748. Philips Medical provided $10,000 for the cost of the radiotracer. No other potential conflict of interest relevant to this article was reported.
Footnotes
Published online Aug. 29, 2012.
- © 2012 by the Society of Nuclear Medicine and Molecular Imaging, Inc.
REFERENCES
- Received for publication January 24, 2012.
- Accepted for publication May 31, 2012.


Jump to section
Related Articles
Cited By...
- 18F-Fluoromisonidazole Kinetic Modeling for Characterization of Tumor Perfusion and Hypoxia in Response to Antiangiogenic Therapy
- 64Cu-ATSM Reflects pO2 Levels in Human Head and Neck Cancer Xenografts but Not in Colorectal Cancer Xenografts: Comparison with 64CuCl2
- 18F-Fluoromisonidazole Quantification of Hypoxia in Human Cancer Patients Using Image-Derived Blood Surrogate Tissue Reference Regions