


Abstract
Radiotracer kinetic modeling in small animals with PET allows absolute quantification of physiologic and biochemical processes in vivo. It requires blood and tissue tracer concentrations as a function of time. Manual sampling, the reference method for blood tracer concentration measurements, requires fairly large amounts of blood besides being technically difficult and time-consuming. An automated microvolumetric β blood counter (μBC) was designed to circumvent these limitations by measuring the blood activity in real time with PET scanning. Methods: The μBC uses direct β-particle detection to reduce its footprint and is entirely remote controlled for sampling protocol selection and real-time monitoring of measured parameters. Sensitivity has been determined for the most popular PET radioisotopes (18F, 13N, 11C, 64Cu). Dispersion within the sampling catheter has been modeled to enable automatic correction. Blood curves obtained with the μBC were compared with manual samples and PET-derived data. The μBC was used to estimate the myocardial blood flow (MBF) of mice injected with 13N-ammonia and to compare the myocardial metabolic rate of glucose (MMRG) of rats injected with 18F-FDG for arterial and venous cannulation sites. Results: The sensitivity limit ranges from 3 to 104 Bq/μL, depending on the isotope and the catheter used, and was found to be adequate for most small-animal studies. Automatic dispersion correction appears to be a good approximation of dispersion-free reference curves. Blood curves sampled with the μBC are well correlated with curves obtained from manual samples and PET images. With correction for dispersion, the MBF of anesthetized mice at rest was found to be 4.84 ± 0.5 mL/g/min, which is comparable to values found in the literature for rats. MMRG values derived from the venous blood tracer concentration are underestimated by 60% as compared with those derived from arterial blood. Conclusion: The μBC is a compact automated counter allowing real-time measurement of blood radioactivity for pharmacokinetic studies in animals as small as mice. Reliable and reproducible, the device makes it possible to increase the throughput of pharmacokinetic studies with reduced blood sample handling and staff exposure, contributing to speed up new drug development and evaluation.
Nowadays, experimental studies in animals have become an essential part of research for new drug development and therapy assessment. Rats and mice are researchers' favorite animal models because their genome, which is very similar to the human one, has been entirely decoded and can be used for genetic manipulations (1). The mouse counted for >90% of the mammals used in research over the world in 2000 (2). Concurrently, most clinical imaging modalities have been adapted to the size of rats and mice, and the spatial resolution and sensitivity of dedicated PET scanners are now suitable to investigate biochemical and physiologic processes in vivo in rodents, including various metabolisms, receptor binding, tumor size and grade, or gene expression (2).
To extract quantitative biologic information from PET studies, the tissue and blood tracer concentration must be measured as a function of time (3,4). Whereas the absolute tracer concentration in tissue can be derived from PET images, several different methods must be used to obtain the blood time–activity curves (5). When a suitable blood pool can be identified within the field of view of the scanner, it can be derived from the sequence of high-resolution PET images (6,7). Otherwise, an external means must be used to measure the blood time–activity curve. Manual sampling, considered as the gold standard, is rather challenging in small animals because of the very small amounts of blood available and the required recovery time for repeated studies (2 wk for 1.6 mL in rats, 0.2 mL in mice) (8). Mini-PET systems over the wrist have been proposed for human studies, but the size and resolution of these devices is not adapted to small animals (9). More suitable external monitors for rodents were developed to address the problem (10–13), but none of these devices provides an integrated solution for real-time measurement of blood radiotracer concentration that is fully adapted to rats and mice.
In the present study, we describe a new online counting system for real-time blood time–activity curve measurement. On the basis of the direct detection of β-particles, its detection volume and overall footprint were expressly tailored for small-animal pharmacokinetic studies. Fully integrated with complete signal-processing electronics and software for real-time control, calibration, and dispersion correction, the device is also very sensitive to low radioactivity concentrations. The device was used for the measurement of myocardial blood flow (MBF) in mice and for the assessment of myocardial metabolic rate of glucose (MMRG) in rats with venous and arterial sampling sites.
MATERIALS AND METHODS
System Overview
The proposed microvolumetric blood counter (μBC) is based on the direct detection of positrons and consists of 2 separated hardware units and control software (14). It can be used as stand-alone or hooked to the LabPET small-animal PET scanner (Gamma Medica-Ideas Inc.) (Fig. 1A).

(A) μBC hooked to LabPET scanner, together with injection pump on left. (B) Detection unit shows shielding and rail systems.
The detection unit includes the β-detector made of 2 p-i-n photodiodes having a 3 × 30 mm2 active area with signal-processing electronics. A thin tungsten shielding (<1.3 cm thick) divided in 2 interlocking parts with internal copper lining is provided to avoid electromagnetic interference (EMI) pickup and protect the photodiodes from radioactivity in the animal and injection syringe (Fig. 1B). To avoid stress, the lid where the catheter from the animal is placed remains motionless, whereas the base can be moved on a rail to close the assembly (Fig. 1B). Two inner linings are available to accommodate PE50 (0.58-mm inner diameter [ID], 0.965-mm outer diameter [OD]) and PE10 (0.28-mm ID, 0.61-mm OD) catheters (Intramedic polyethylene tubing; Becton Dickinson), generally used with rats and mice, respectively.
The main unit includes a pumping system and the control electronics for the pump, the detector unit, and the communication with a personal computer or the LabPET. The syringe pump (Microliter Flow M.P.C.; Harvard Apparatus) can accommodate speeds from 3 × 10⁻³ μL/h (for a 1-μL syringe) to 1.5 mL/min (for a 3-mL syringe).
The user-friendly control software, running under Windows (Microsoft), Linux, or MacOS (Apple) environments, was developed to set up experiment parameters, display the blood time–activity curve in real time, and process recorded data (Fig. 2). During an experiment, the user can choose to display the measured blood activity curve in nCi/μL, Bq/μL, or cps/μL (cps = counts per second). When the μBC is hooked to the LabPET scanner, the counter control software is integrated to the scanner's user interface. Communication between the computer and the μBC is made through any RS232 serial port or USB (universal serial bus) adapter. For a more complete technical description of the μBC, refer to (14,15).

Control software, showing the acquisition (top) and configuration (bottom) tabs.
Data Corrections
To be used as the input function in pharmacokinetic models, the data recorded by the μBC must be corrected for detector efficiency, radionuclide decay time, radioactivity dispersion inside the catheter, system dead time, and propagation delay between the cannulation point and the detector. Only detector efficiency and radioactivity dispersion issues will be addressed in this article, as other corrections and the physical performance evaluation of the device have been reported previously (14,15).
Sensitivity.
Due to attenuation within blood, catheter wall, and photodiode dead layer, only a small fraction of the β-particles actually reaches the detector and is measured by the μBC. The true count rate CT(t) in becquerels, reflecting the amount of radioactivity in the measured sample, can be computed from the measured count rate Cm(t) in cps by: Eq. 1where K is the sensitivity calibration factor in cps/Bq. Because detection sensitivity is a function of the radioisotope Eβmax and discriminator threshold Dl, K must be evaluated for each radionuclide and computed for each experimental setup.
A set of experiments was conducted to determine the relationship between K and Dl. A 4-cm-long sample of a 5.5-MBq/mL solution of 18F-FDG was injected in a small piece of PE50 catheter and centered into the μBC. The count rate was recorded as a function of Dl and the sensitivity K computed. The resulting curve could be fitted by a simple linear relationship between a minimum threshold level, Dlmin, set just above the electronic noise and a maximum threshold level, Dlmax, set to keep μBC sensitivity high enough for animal studies: Eq. 2where Dl is expressed as a fraction of the maximum signal amplitude corresponding to Eβmax, K0 (cps/Bq) is the projected detector sensitivity for the discriminator level set to 0, and s is the slope. It was implemented in the control software as an 8-point curve defined between Dlmin and Dlmax with Kopt = K(Dlmin). This protocol was repeated to obtain the optimum absolute sensitivity, Kopt (cps/Bq), with the 4 most commonly used PET isotopes in our center (18F, 13N, 11C, and 64Cu) for PE50 and PE10 catheters. As the typical background count rate is negligible in most animal studies (14), these experiments were performed assuming a default background count rate arbitrarily set to 5 cps.
The minimum detectable activity was then computed following 2 mathematic models. The first one, based on the Curie equation (16), determines the activity A1min (Bq/μL) that is statistically significant ±5% over the background count rate: Eq. 3where n (cps) is the background noise and V is the detection volume (7.926 μL for PE50 and 1.847 μL for PE10). The second model is less stringent but also common in radiation detection science. The minimum activity A2min (Bq/μL) is expressed as a count rate that is 3 times higher than the statistical noise:
 Eq. 4
Eq. 4
The maximum activity that can be detected by the μBC was also computed as follows: Eq. 5where Nmax = 65,535 cps is the maximum count rate permitted by the μBC 16-bit counter.
Dispersion.
Dispersion effects need to be considered when radioactivity is moving inside catheters. Indeed, a fast sharp radioactivity edge, as encountered with bolus injections, can be highly smoothed as it travels inside the catheter and because of its transit time in the μBC, resulting in severe distortions of estimated metabolic parameters (17).
The dispersion constant τdisp (s) was measured as the response to step-down functions for different pumping speed and distance between the withdrawing point and the detector. Experiments were performed at room temperature. A zero dead volume junction, considered as the withdrawing point, was made by inserting 2 needles at 1 end of a 50-cm-long PE50 or PE10 catheter. Each needle was connected to a small piece of catheter and to a 3-mL syringe mounted on a computer-controlled syringe pump. The long piece of catheter was then inserted in the detector and ended in a waste container. Both syringes were filled with a nonradioactive solution, and 18F-FDG was added in one of the syringes. Software was developed to operate both pumps for creating radioactivity edges. Measured edges were normalized to 1 and fitted to a simple monoexponential (18) using the software Prism 4 (GraphPad Software) to obtain τdisp (s): Eq. 6where Span + Plateau is the starting point and Plateau is the ending point of the exponential.
A first set of experiments was conducted with rat heparinized whole blood (3-mL samples in a 4-mL Vacutainer (Becton Dickinson) loaded with 7.2 mg K2EDTA [EDTA is ethylenediaminetetraacetic acid]) and 3.7 MBq/mL 18F-FDG for 3 different pumping speeds v (16, 62, and 250 μL/min) and 2 distances d (10 and 20 cm), for both PE10 and PE50. A second set of experiments was performed using a 400-g/L sucrose solution and 4.3 MBq/mL 18F-FDG to obtain enough points to model the dispersion as a function of v and d. The sucrose concentration was selected to obtain a viscosity of 3.5 mPa·s (19), equivalent to blood viscosity (1.5–9 mPa·s depending on the hematocrit concentration (20)). Dispersion was measured with the μBC for 4 distances d (10, 20, 30, and 40 cm) at 6 different speeds v for PE50 (16, 31, 62, 125, 250, 500 μL/min) and 5 speeds for PE10 (16, 31, 62, 125, 250 μL/min). To ensure reproducibility, measurements were repeated 3 times in each configuration.
Using these parameters, the true animal blood time–activity curve  can be computed by deconvolving the dispersion function from the measured blood time–activity curve g(t) using Laplace Transforms (21):
 Eq. 7
Eq. 7
The dispersion constant τdisp can then be parameterized as follows: Eq. 8where KD is an exponential growth rate constant, function of the distance d, and YmaxD is the asymptotic value fitted from the starting point SpanV + PlateauV and decreasing exponentially with a rate constant KV to PlateauV as a function of speed v.
Animal Preparation
Animal experiments were performed in accordance with the recommendations of the in-house Ethics Committee for Animal Experiments and the Canadian Council on Animal Care. The animals were anesthetized with isoflurane (2.5% + 1.5 L/min O2) and cannulated with 50-cm-long catheters (PE50 for rats and PE10 for mice), filled with heparinized saline (0.9%, 50 U/mL). For arterial cannulations, a 3-way stopcock was added just before the withdrawing syringe to prevent blood from flowing up to the syringe (Fig. 3A). During animal preparation, the PET acquisition protocol was set up, and information about the experiment (animal data, injection and blood withdrawing protocols, etc.) was entered in the μBC control software. Up to 6 time intervals with different user-defined withdrawing speeds can be set up, and the software automatically calculates the total amount of blood withdrawn, flagging any excess of 20% of the animal blood volume (∼3.2 mL for rats and 0.4 mL for mice) (8). Withdrawing speeds down to 8 μL/min have been used without blood clotting with PE10. At this speed, acquisitions up to 400 min for rats and 50 min for mice are possible.

(A) Schematic view of μBC practical use in small-animal studies. PE50 catheter and flush are commonly used for rats; PE10 catheter without flush is typical of mouse studies. (B) Typical μBC setup for use with Sherbrooke PET scanner shows detector unit placed near the animal on the bed and main pumping unit on left, together with an injection pump and a gas anesthesia system.
After being instrumented, the animals were transported to the avalanche photodiode–based Sherbrooke PET scanner (22), and the heart was placed in the center of the camera field of view. The cannula was then inserted inside the detector unit placed next to the animal on the scanner bed, the withdrawing syringe was installed on the μBC main unit (Fig. 3B), and the counter discrimination threshold was automatically adjusted by the software. Both the PET and counter data acquisitions were then started in synchronization, and the radiotracer administration was initiated 30 s later in the tail vein. Rats were injected with 0.5 mL of radioactive solution at a rate of 2 mL/min. A 0.35-mL saline flush was started at the end of the injection at a rate of 2 mL/min. Mice were injected with a 0.1 mL radioactive solution at a rate of 1 mL/min but no flush was made to minimize the injected volume. The μBC control software took care of the different withdrawing speeds previously set in the protocol as the heart was imaged by the camera. PET images were reconstructed using the maximum-likelihood expectation maximization (MLEM) algorithm with 15 iterations (23).
PET Measurements
An initial animal study was performed to validate the blood time–activity curve measured by the μBC against manual blood samples. A 241-g male Sprague–Dawley rat was cannulated in the femoral and carotid artery. The animal was injected with 37 MBq 18F-FDG. Blood was withdrawn from the femoral cannula at a rate of 0.5 mL/min (3.2 cm/s; transit time in the detector = 1 s) for 3 min and at 50 μL/min (0.3 cm/s; transit time = 9.5 s) for 27 min (total blood volume = 2.85 mL). The detection unit was placed 20 cm away from the cannula. Samples (∼120 μL) were manually taken from the carotid cannula every minute for the first 5 min and then every 5 min until the end of the acquisition and stored in preweighted tubes. At the end of the acquisition, sampling tubes were weighted again and counted in a high-sensitivity γ-well counter (Cobra II Auto-gamma; Canberra-Packard) to accurately determine samples' radioactivity concentration.
A second set of experiments was performed to investigate the measurement of MMRG in rats using the μBC for arterial and venous blood counting. As arterial plasma radioactivity concentration is required for MMRG evaluation (3), no numeric values will be given in this study. Six female Sprague–Dawley rats, 257 ± 8 g, were cannulated in the femoral artery (n = 3) or in the jugular vein (n = 3) and injected with 34 ± 0.8 MBq 18F-FDG. For both groups, blood was withdrawn at 300 μL/min (1.9 cm/s; transit time = 1.6 s) for 4 min and at 20 μL/min (0.1 cm/s; transit time = 24 s) for 26 min (total blood volume = 1.72 mL). The detection unit was placed 29 ± 0.5 cm away from the cannula.
A third set of measurements was performed to illustrate the use of the μBC for MBF evaluation in mice. Three female BALB/c mice, 20 ± 2 g, were cannulated in the carotid artery and injected with 59 ± 16 MBq 13N-NH3. Blood was withdrawn at 30 μL/min (0.8 cm/s; transit time = 3.6 s) for the entire 10-min acquisition (total blood volume = 300 μL). The detection unit was placed 29 ± 0.5 cm away from the cannula. The blood curves were corrected for dispersion by Equation 7 using the dispersion constants measured with the sucrose solution.
Kinetic Modeling
For kinetic modeling in the rat, the blood curve measured by the μBC was first corrected for radioactive decay and propagation delay in the catheter and smoothed to reduce statistical noise (gaussian filter, SD 2, span 5). No corrections for plasma and metabolites were made. PET tissue curves were also corrected for radioactive decay, but not for spillover, partial-volume effect, scatter, and attenuation. As PET data were in units of cps/pixel, a calibration was made by comparing PET blood data measured from a region of interest (ROI) on the left ventricle and the μBC blood time–activity curve in the peak region. The calibration factor was then applied to the tissue time–activity curve used in the kinetic model. For the mouse study, the scanner resolution (2.1 × 2.1 × 3.1 mm3 or 14 μL) was not good enough to distinguish the left ventricle from the myocardium. A single ROI enclosing both structures was thus drawn and used as the tissue curve in the kinetic model.
MMRG values evaluated with 18F-FDG were computed using least-square nonlinear regression with a 3-compartment and 5-parameter (K1, k2, k3, k4, and blood volume) kinetic model (3). MBF values evaluated with 13N-NH3 were computed following the same method with a 3-compartment and 4-parameter (K1, k2, k3, and blood volume) kinetic model (4).
RESULTS
Data Corrections
Sensitivity.
The calibration curve obtained with 18F is illustrated in Figure 4A and appears to fit very well to the linear relationship between Dlmin and Dlmax. Sensitivity parameters Kopt, A1min, A2min, and Amax computed using Equations 2–5 are summarized in Table 1 for different isotopes and both catheter types. These sensitivities appear to be suitable for most pharmacokinetic PET studies in small animals.
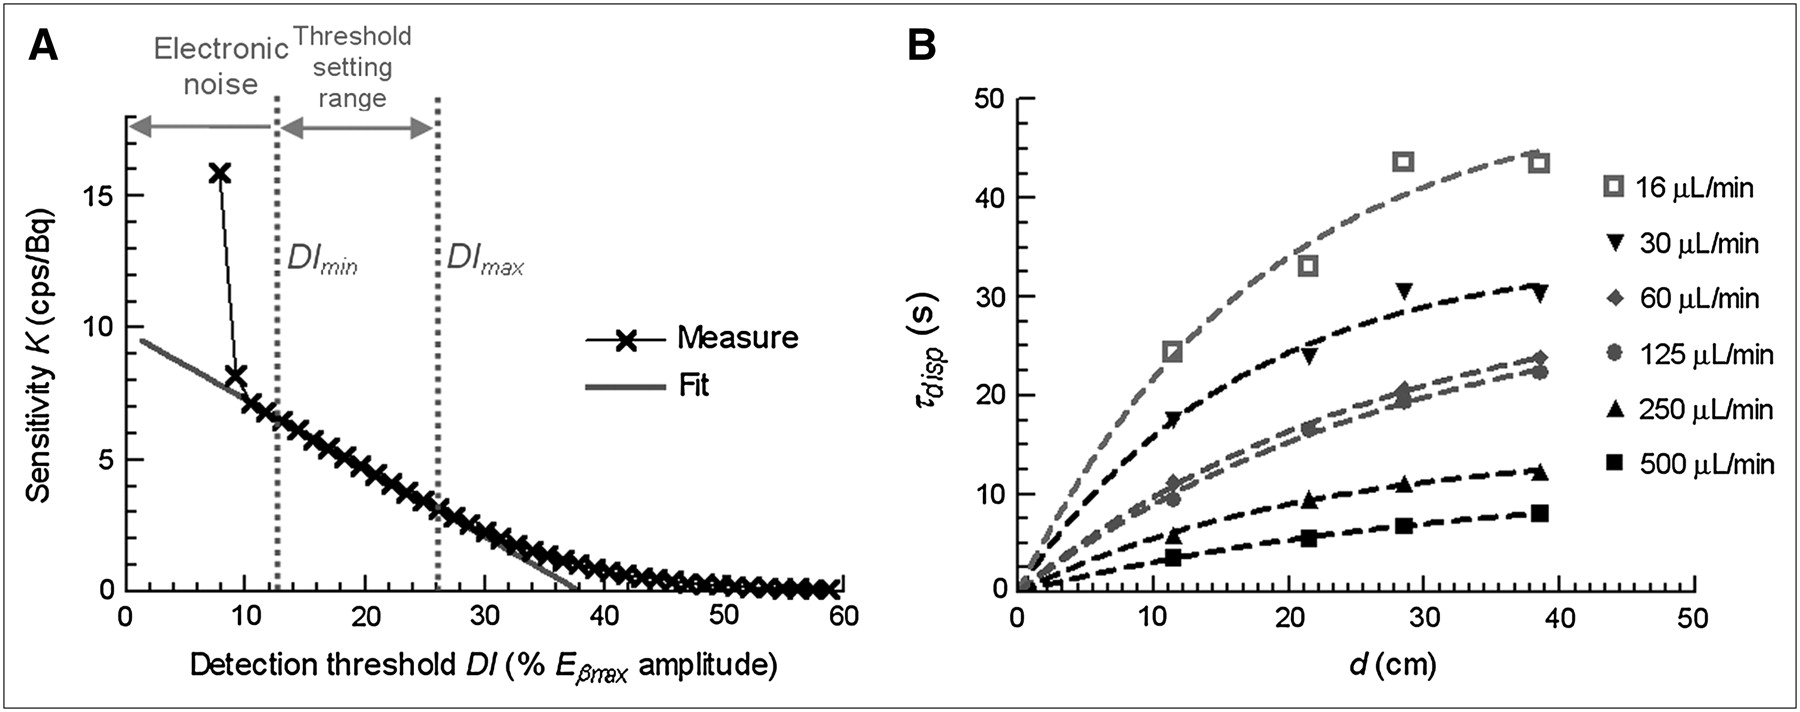
Data corrections. (A) Relationship between μBC detection efficiency K and detection threshold Dl. (B) Variation of dispersion time constant τdisp with distance d between animal and withdrawing point for PE50 catheter. Measured data (symbols) were fitted with monoexponential model (dashed lines).
Optimum Absolute Sensitivities and Detection Limits Measured for 4 Common PET Radiotracers with PE50 and PE10 Catheters (Optimum Threshold, No Background Noise)
Dispersion.
All dispersion constants measured with PE50 using blood and sucrose solutions are reported in Table 2. For PE10, the dispersion constant measured with the sucrose solution ranges from 2.5 ± 1.0 s (d = 10 cm, v = 250 μL/min) to 15.1 ± 1.0 s (d = 40 cm, v = 16 μL/min), whereas it ranges from 1.4 s (d = 10 cm, v = 250 μL/min) to 6.8 s (d = 20 cm, v = 16 μL/min) with blood.
Dispersion Time Constant τdisp (s) as Function of Withdrawing Speed and Animal-to-Detector Distance with PE50 Catheter
The dispersion constant obtained with blood is in good agreement, within statistical variations, with the sucrose measurements for d = 10 cm. For 20 cm, blood dispersion appears statistically lower than the sucrose dispersion at 250 and 62 μL/min and higher at 16 μL/min. As only one measurement is available with blood, these differences can be attributed to experimental uncertainties. Nevertheless, the sucrose solution data provide a suitable model for blood dispersion measurements.
Figure 4B gives a graphical representation of the sucrose data of Table 2 for PE50 and illustrates the exponential relationships of Equation 8. KD was computed for each withdrawing speed and appears quite steady for each catheter type but differs for v ≥ 62 μL/min and for v < 62 μL/min. Table 3 summarizes the parameters to be used in Equation 8 for both catheters, including KD for each speed range. Using Equation 8 and Table 3, one can calculate the dispersion constant to be used in Equation 7 for any experimental protocol with the μBC.
Parameters To Be Used in Equation 8 To Determine Dispersion Constant τdisp as Function of Withdrawing Speed v and Animal-to-Detector Distance d
PET Measurements
Blood time–activity curves obtained from manual samples and from μBC for the same animal are presented in Figure 5A. Both curves show a very good correlation, but the μBC one was much easier and faster to obtain. The μBC blood time–activity curves for rats in each group of the MMRG study are shown in Figure 5B. In the peak region, arterial sampling shows a much higher activity than venous sampling, indicating that a large fraction of the 18F-FDG is absorbed in the first pass through systemic capillaries. After 200 s, the venous curve rises slightly above the arterial one, indicating some diffusion of the tracer from the tissue back to capillaries. Such patterns are typical of rapidly extracted tracers (3,24) and provide a nice demonstration of the ability of the μBC to measure accurate blood time–activity curves. The mean MMRG value computed for rats cannulated in the jugular vein was found to be underestimated by >60% in comparison with the mean MMRG value computed for rats cannulated in the femoral artery. This simple experiment stresses the importance of the blood withdrawal site for accurate measurement of the tissue metabolic rate of glucose.

Blood time–activity curves corrected for radioactive decay and propagation delay obtained after bolus injection of 15 s started at 30 s, followed by 10-s flush: (A) Obtained manually and with μBC. (B) Obtained with μBC for arterial (light) and venous (dark) sampling (curves were smoothed with a gaussian filter (variance 2, span 5) to decrease statistical error.
Figure 6A shows 13N-NH3 blood time–activity curves, without and with dispersion correction, obtained in a mouse using the μBC and compared with the time–activity curve derived from a ROI drawn on the PET images.
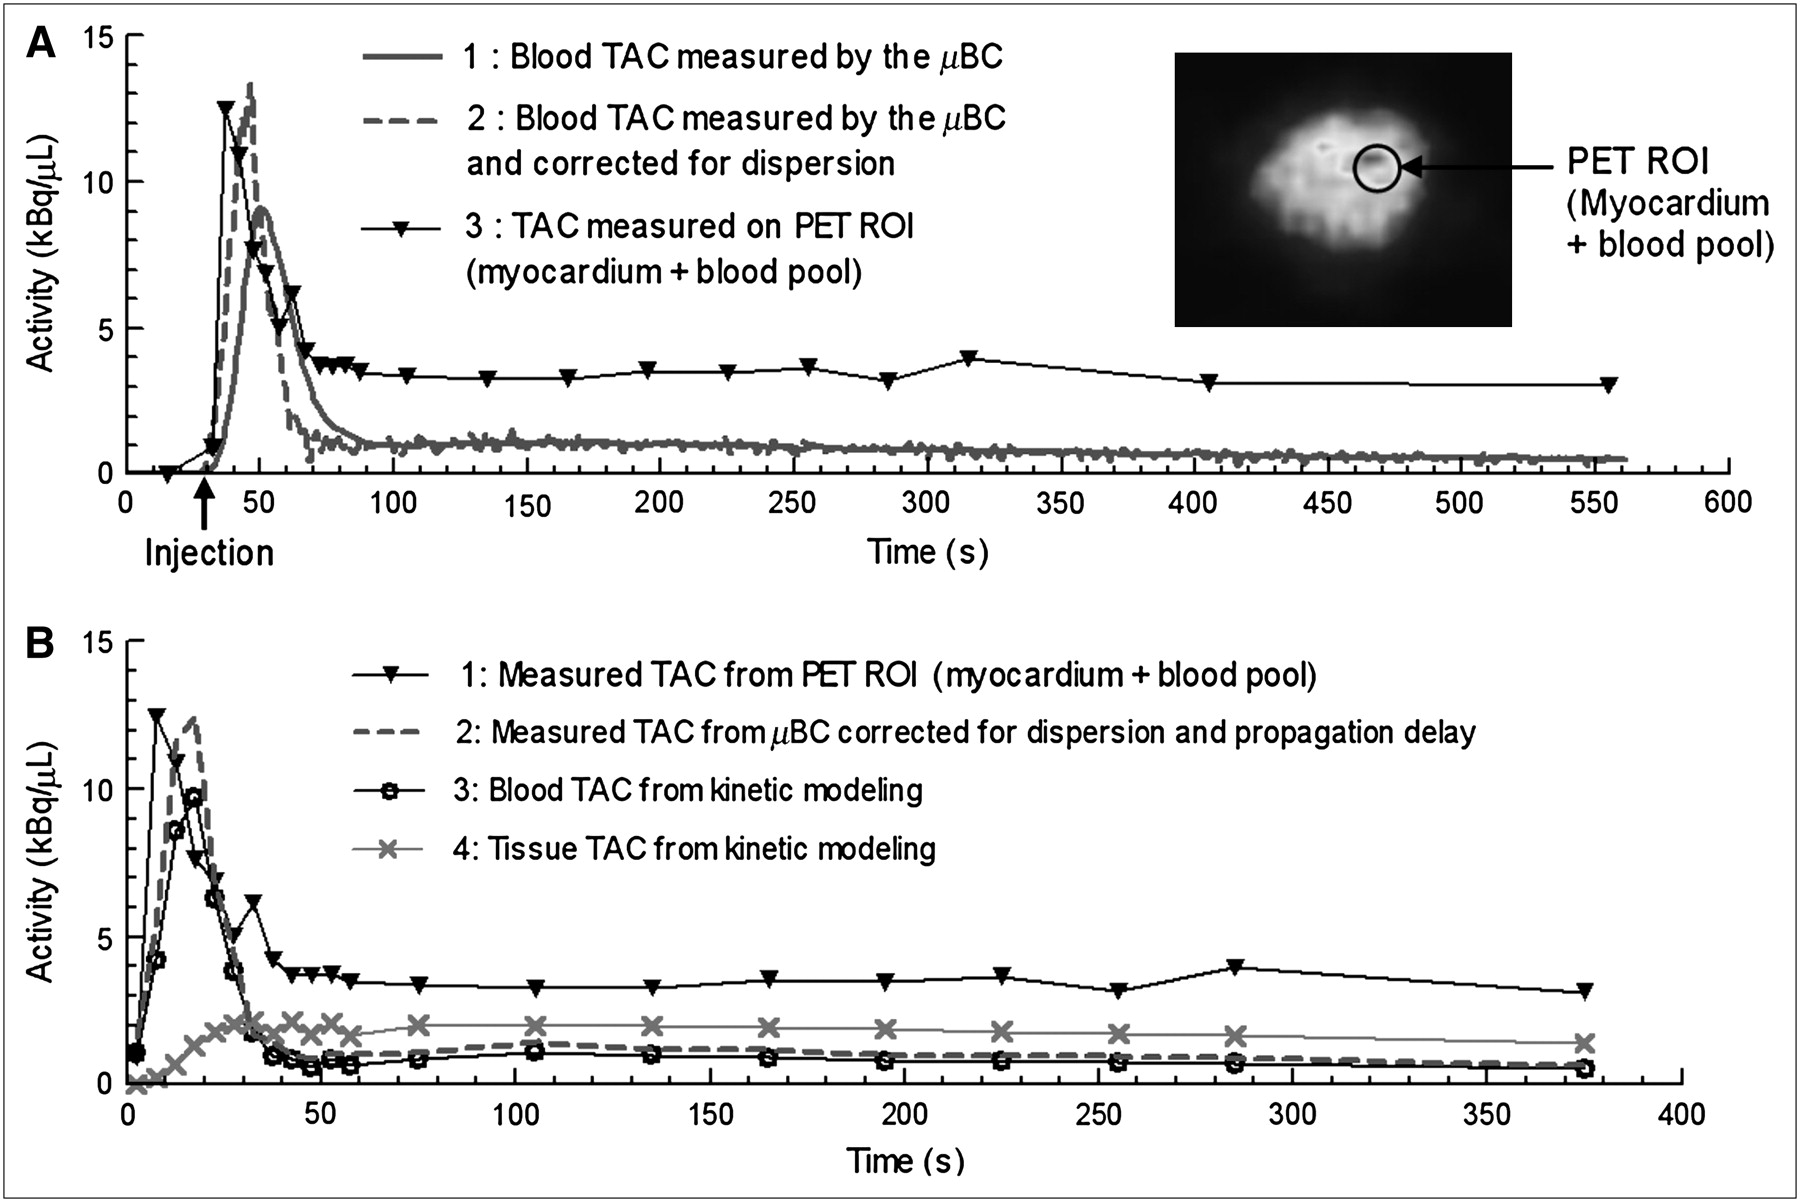
Decay corrected time–activity (TAC) curves obtained after injection of 41 MBq 13N-NH3 in 18.5-g BALB/c mouse. Bolus injection of 6 s was started at 30 s. (A) Blood time–activity curves from μBC and from PET ROI. μBC curve 1 is corrected for propagation delay and smoothed to decrease statistical error (gaussian filter, variance 2, span 5). μBC curve 2 illustrates dispersion correction applied on curve 1. PET curve 3 was calculated from ROI enclosing myocardium and left ventricle. (B) Measured blood and tissue time–activity curves with blood and tissue tracer uptake extracted by kinetic modeling.
MBF computed without dispersion correction gave 1.12 ± 0.17 mL/g/min. With dispersion correction, the MBF increased to 4.84 ± 0.8 mL/g/min. As a comparison, a mean of 4.56 mL/g/min was evaluated in rats with a similar experimental protocol in (25), and values from 2.5 to 4.9 mL/g/min were measured in (26). This study highlights the importance of the dispersion correction for MBF measurements in mice with an external online blood counting system.
DISCUSSION
Invasiveness of online counting systems, such as the μBC, is often mentioned as a drawback, and some noninvasive blood time–activity curve measurement techniques are being developed to overcome this difficulty (5). However, these methods can hardly be applied with small animals. Similarly, accurate blood time–activity curve measurement from PET images is not always possible because of partial-volume or spillover contamination from adjacent organs in the blood pool. Furthermore, the initial investigation of new radiotracers requires direct and accurate determination of plasma and metabolite concentration of the tracer as a function of time (27). The proposed flow-through whole-blood counter allows an automated blood sampler to be inserted on the same withdrawing line (11).
Like PET scanners, most external online counting systems are based on annihilation photon detection (11,28). Although this detection principle is very reliable, it requires complex electronics and bulky detectors that necessitate cumbersome shielding. The direct detection of β-particles in photodiodes greatly simplifies the electronics and reduces the footprint next to the animal. Furthermore, as both positrons and electrons can be detected by photodiodes, the overall detection efficiency of some positron emitters—such as 64Cu, for instance—can be significantly improved by measuring β−- as well as β+-decays. Though not tested in this study, the ability to detect β−-decaying radiotracers stands out as an advantage of the proposed device as compared with annihilation detection devices. Lastly, the μBC automated calibration process overcomes one of the significant drawbacks of most direct β-detection devices: the need for a different calibration factor for every isotope. This feature alone makes the μBC much easier to use than photon detection devices that require frequent calibrations.
Data Corrections
Sensitivity.
The linear relationship between sensitivity and detection threshold in its setting range greatly simplifies the calibration process of the μBC. In addition to 18F and PE50, this feature was also confirmed for the 3 other PET isotopes tested in this study (13N, 11C, 64Cu) with both PE50 and PE10 catheters. The whole calibration procedure was fully integrated to the μBC control software and takes only a few minutes. Calibration must be done for every new radioisotope before an experiment and should be repeated periodically (e.g., every month) for known radionuclides to ensure stability. However, the μBC was used at the Sherbrooke Molecular Imaging Centre for several months, and no significant variation of sensitivity was observed. A longer-term study is needed to determine the suitable time interval for periodic calibrations.
The activities measured in the 3 animal experiments presented in this work are well within the sensitivity range of the μBC. The typical blood peak activities of 0.5–2 kBq/μL 18F-FDG for rats and 7–12 kBq/μL 13NH3 for mice are 1 order of magnitude lower than the μBC maximum count rates of 116 kBq/μL 18F-FDG with PE50 and 104 kBq/μL 13NH3 with PE10, respectively. As well, minimum expected activities in animals, in the range of 200–500 Bq/μL 18F-FDG for rats and 400–500 Bq/μL 13NH3 for mice, are 1 order of magnitude higher than the μBC minimum detection threshold of 12 Bq/μL (A2min) or 23 Bq/μL (A1min) 18F-FDG for PE50 and 11 Bq/μL (A2min) or 21 Bq/μL (A1min) 13NH3 for mice.
On the basis of the measured sensitivities for 4 common positron-emitting radionuclides, it is expected that the μBC will detect any isotope emitting β+– or β−–particles with Eβmax > 500 keV and emission probability > 50%. A nonexhaustive list of radioisotopes used in nuclear medicine satisfying these requirements includes 11C, 13N, 18F, 64Cu, 15O, 68Ga, 82Rb, 124I, and 32P. Therefore, the μBC could potentially find applications in areas of biomedical research other than PET.
Dispersion.
According to Votaw and Shulman (17), a dispersion time constant of 10 s leads to 33% error in the measured cerebral blood flow with H215O, whereas a 1.3-s dispersion constant leads to only 0.3% error. Dispersion in the μBC should then be corrected for most animal studies, except for protocols leading to dispersion constants below a few seconds. According to Table 2, such low dispersions are achieved with the PE50 catheter at v > 250 μL/min and d < 20 cm. Similarly, experiments with the PE10 catheter should not require dispersion correction with v > 125 μL/min or d < 10 cm.
For animal studies, dispersion constants computed with Equation 8 and parameters from Table 3 can be considered as good approximations rather than absolute values, as measurements were performed with a sucrose solution at room temperature rather than whole blood at body temperature. Furthermore, occasional clotting and formation of air bubbles increased the SD on these measurements, especially with PE10 tubing because of its smaller internal diameter.
Even though manual sampling is usually considered as a reference method avoiding dispersion, it can hardly be used to confirm the accuracy of the dispersion constants or the adopted correction method. In practice, as illustrated in Figure 5A, it is hard to obtain a sufficient number of sampling points in the peak region to draw any firm conclusions from the comparison with the μBC curve. Blood curves obtained from PET image ROIs are also considered as a good reference with no dispersion. In the mouse study presented in this work, the PET time–activity curve had a time resolution of 5 s in the peak region, which was considered sufficient for use as a reference (Fig. 6). Nevertheless, a few issues need to be highlighted about the comparison between the μBC and the PET time–activity curve. First, even with the 5-s sampling time period of the PET curve, the rising edge of the peak region only comprises one sample, which could lead to an underestimation of the MBF. Second, the time shift of the μBC dispersion-corrected peak activity as compared with the PET curve could be attributed to 3 phenomena: the dispersion occurring between the target organ and the blood sampling site in the animal, an underestimation of the dispersion constant, and uncertainty in the mathematic modeling. The consequence is an underestimation of the blood peak activity in the kinetic model (Fig. 6B) and an underestimation of the MBF.
Some underestimation of the dispersion constant used to correct the mice blood curve may result from the use of a sucrose solution at room temperature rather than whole blood at body temperature. As well, differences of solubility between FDG, used for the evaluation of τdisp, and NH3, used for this animal study, could affect dispersion. Further refinement of the experimental protocol or mathematic modeling for evaluation of the dispersion constants could provide more accurate results. Votaw and Shulman (17) proposed a double-exponential model that seems to give better results than the monoexponential model used in this study for the evaluation of the cerebral oxygen metabolic rate with 15O-O2.
Even though further enhancements would be useful for some more demanding protocols, the dispersion was fully modeled and an automatic correction has been implemented in the control software, which together with all other corrections greatly simplifies pharmacokinetic studies.
PET Measurements
As manual sampling and μBC data were calibrated separately, the very good agreement between the 2 curves confirms the accuracy of the μBC automatic calibration process, even though only one point is available in the peak region of the manual sampling curve. Because better time resolution would be very hard to achieve with the manual sampling technique in small animals, no further attempt was made to achieve a better comparison of the 2 techniques in the peak region.
The discrepancy observed between MMRG measurements based on venous and arterial blood sampling has important bearings on the design of molecular imaging protocols. Arterial is more invasive than venous cannulation, making it more difficult to repeat follow-up studies on the same animal, unless advanced cannulation techniques such as a permanent carotid catheter is used (29).
Our data show that the μBC sensitivity is good enough to reveal subtle physiologic processes such as the difference in arterial versus venous radiotracer concentration or the second pass through the body after bolus administration of the radiotracer (Fig. 5B).
The MBF study in a mouse highlighted the fact that it is not always easy to extract the input function from an ROI placed on the blood pool in the PET image. Without the external measurement provided by the μBC, it would not have been possible to evaluate MBF from the single ROI drawn over the whole heart, encompassing both the myocardium and the ventricular blood pool. A scanner with much better spatial resolution, sensitivity, and cardiac gating (30) is otherwise required to be able to draw 2 distinct ROIs with manageable spillover and partial-volume effects. Because of the lack of published data for mouse MBF in the literature, the values obtained in the present study were compared with rat MBF. Comparable results were obtained in spite of the fact that the generally higher metabolism in mice would have suggested a higher MBF as compared with rats.
CONCLUSION
A handy microvolumetric blood counter enabling reliable and reproducible measurement of blood time–activity curves in small animals was developed. The shielded β-detector unit is very compact and can be used in close proximity to small animals with negligible contamination from background radiation. The counter sensitivity and detection limit range from 3.5% and 104 Bq/μL with 64Cu and PE10 catheter up to 30% and as low as 3 Bq/μL with 13N and PE50 catheter. Such sensitivities were found to be adequate for most pharmacokinetic studies in small animals. Dispersion was fully modeled and an automatic correction was implemented in the μBC software. Acceptable estimates of the input function were obtained in comparison with dispersion-free references, such as manual sampling or PET ROI. Selected animal studies demonstrated the accuracy of μBC measurements when dispersion is not an issue and highlighted the importance of dispersion correction for MBF evaluation using 13N-ammonia. Other studies showed the relevance of arterial sampling for MMRG measurements as well as the importance of the μBC external measurement for MBF evaluation in mice.
The μBC is fully automated and remote controlled by software through a flexible user-friendly interface. As a stand-alone device, the counter can be operated in conjunction with injection and flush pumps. In PET studies, the counter can be fully integrated to the Sherbrooke or LabPET scanners for managing radiotracer administration and recording blood data together with dynamic PET images. The μBC is intended to be used with rodents but could be used as well with larger animals, such as dogs or pigs, and would even be suitable for humans (although this has not been investigated). Because of its unique features, the μBC should contribute to reduce staff exposure and increase throughput of pharmacokinetic studies in biomedical and pharmaceutical research.
Acknowledgments
The authors thank Réjean Fontaine and Daniel Rouleau for advice on electronic design, Etienne Croteau for help on kinetic modeling, and Catherine Pepin for proof reading and suggestions. This work was part of the first author's Master's thesis. This work was supported by Canadian Institutes of Health Research (CIHR) grant MOP-15348.
Footnotes
-
COPYRIGHT © 2007 by the Society of Nuclear Medicine, Inc.
References
- Received for publication November 15, 2006.
- Accepted for publication April 17, 2007.


Jump to section
Related Articles
Cited By...
- Real-Time Microfluidic Blood-Counting System for PET and SPECT Preclinical Pharmacokinetic Studies
- Image-Derived Input Function from the Vena Cava for 18F-FDG PET Studies in Rats and Mice
- Repeatable Noninvasive Measurement of Mouse Myocardial Glucose Uptake with 18F-FDG: Evaluation of Tracer Kinetics in a Type 1 Diabetes Model
- Quantification of Brain Glucose Metabolism by 18F-FDG PET with Real-Time Arterial and Image-Derived Input Function in Mice
- Spillover and Partial-Volume Correction for Image-Derived Input Functions for Small-Animal 18F-FDG PET Studies