


Abstract
A noninvasive and repeatable method for assessing mouse myocardial glucose uptake with 18F-FDG PET and Patlak kinetic analysis was systematically assessed using the vena cava image–derived blood input function (IDIF). Methods: Contrast CT and computer modeling was used to determine the vena cava recovery coefficient. Vena cava IDIF (n = 7) was compared with the left ventricular cavity IDIF, with blood and liver activity measured ex vivo at 60 min. The test–retest repeatability (n = 9) of Patlak influx constant Ki at 10–40 min was assessed quantitatively using Bland–Altman analysis. Myocardial glucose uptake rates (rMGU) using the vena cava IDIF were calculated at baseline (n = 8), after induction of type 1 diabetes (streptozotocin [50 mg/kg] intraperitoneally, 5 d), and after acute insulin stimulation (0.08 mU/kg of body weight intraperitoneally). These changes were analyzed with a standardized uptake value calculation at 20 and 40 min after injection to correlate to the Patlak time interval. Results: The proximal mouse vena cava diameter was 2.54 ± 0.30 mm. The estimated recovery coefficient, calculated using nonlinear image reconstruction, decreased from 0.76 initially (time 0 to peak activity) to 0.61 for the duration of the scan. There was a 17% difference in the image-derived vena cava blood activity at 60 min, compared with the ex vivo blood activity measured in the γ-counter. The coefficient of variability for Patlak Ki values between mice was found to be 23% with the proposed method, compared with 51% when using the left ventricular cavity IDIF (P < 0.05). No significant bias in Ki was found between repeated scans with a coefficient of repeatability of 0.16 mL/min/g. Calculated rMGU values were reduced by 60% in type 1 diabetic mice from baseline scans (P < 0.03, ANOVA), with a subsequent increase of 40% to a level not significantly different from baseline after acute insulin treatment. These results were confirmed with a standardized uptake value measured at 20 and 40 min. Conclusion: The mouse vena cava IDIF provides repeatable assessment of the blood time–activity curve for Patlak kinetic modeling of rMGU. An expected significant reduction in myocardial glucose uptake was demonstrated in a type 1 diabetic mouse model, with significant recovery after acute insulin treatment, using a mouse vena cava IDIF approach.
Myocardial metabolism has become an increasingly important target for treatment of cardiovascular diseases, with relatively little information known on the alterations of metabolism in cardiomyopathies (1–3). Transgenic, knockout, pharmacologic, and surgical mouse models are used extensively to study cardiac metabolism. Although mouse models present many positive features—such as the ease in producing customized transgenic or knockout lines and a lower expense in housing fees—the small size of the mouse can present challenging issues.
18F-FDG is a glucose analog commonly used in PET to assess cardiac glucose uptake and cell viability (4). 18F-FDG enters the cell via glucose transporters (K1 and k2 rate constants) and is phosphorylated by hexokinase to 18F-FDG-6-phosphate (k3 rate constant). The chemical structure of 18F-FDG-6-phosphate traps the radiolabeled product within the cell. The 18F-FDG uptake rate constant, Ki = (K1 × k3)/(k2 + k3), can be estimated using Patlak graphical kinetic analysis, assuming there is negligible tracer washout (k4 = 0) (5). 18F-FDG has been modeled extensively with Patlak analysis in humans (6,7) and rats (8–12). Studies in mice have evaluated the effects of diet (13), anesthetic (14), mode of injection, and blood glucose levels (15) on 18F-FDG uptake. However, the inaccuracy of the left ventricular (LV) cavity blood image–derived input function (IDIF) (16–18) remains one of the most difficult impediments to obtaining reliable kinetic measurements in mice. The inaccuracy of the LV cavity IDIF is a particular phenomenon in mice PET imaging because of the relatively small cavity size on the order of the spatial resolution of the current small-animal PET systems (∼1.2 mm, Inveon DPET; Siemens). Ferl et al. (17) were able to predict a blood input function using modeling by taking 2 arterial samples at approximately 10 and 60 min. Other groups have used serial blood sampling to determine the blood input function (13,16,19). Although manual blood sampling can provide accuracy, it incorporates invasive procedures, reducing serial imaging capabilities. A hybrid image-derived input function has been proposed using the initial peak of the LV cavity IDIF, with the remainder of the curve derived from the liver time–activity curve normalized to a 60-min arterial blood sample (20). Although this methodology reported reliable estimates of Ki using a 2-tissue-compartment model, sampling of arterial blood at 60 min is still required. Locke et al. (18) recently reported an accurate IDIF with sampling of the LV cavity in mice. However, the accuracy was dependent on using gated iterative reconstruction (12-subset 2-dimensional ordered-subset expectation maximization [OSEM], 2 iterations, 18 maximum a posteriori [MAP] iterations). Although gated OSEM MAP reconstructions allow accuracy at later time frames (21), because of a reduction in spillover from the myocardium, the authors acknowledge that each reconstruction takes approximately 34 h to complete (18). This methodology presents time-issue constraints in high-output cardiac research centers. Additionally, gated reconstruction relies on accurate electrocardiogram gating that can be compromised in animal models with inherent (22) or induced arrhythmogenesis such as after myocardial ischemic injury. In this study, we describe a novel method that provides a repeatable and accurate cardiac 18F-FDG Ki value using a corrected vena cava IDIF. This approach requires no invasive arterial blood sampling with nongated dynamic iterative reconstruction algorithms. This methodology was tested for repeatability and evaluated in a type 1 diabetic mouse model expected to exhibit decreased 18F-FDG cardiac uptake due to hyperglycemia.
MATERIALS AND METHODS
Animals
All animal experiments described herein were conducted according to the guidelines of the University of Ottawa Animal Care Committee and the Canadian Council on Animal Care for the use and care of laboratory animals. All animals were maintained on a 12-h light–dark cycle with chow and water ad libitum. All animals used in this study were male FVB mice (25–34 g) purchased from Charles River Canada. Three groups of mice were used to determine the accuracy of the vena cava IDIF, test–retest repeatability, and ability to measure changes in a type 1 diabetes model. Type 1 diabetes was induced in male FVB mice by streptozotocin, dissolved in a 0.05 M sodium–citrate solution, injected at 50 mg/kg intraperitoneally once daily for 5 d (23). Mice were fasted 4–6 h before streptozotocin injection to increase conversion. At 10 d after streptozotocin injection, fasting blood glucose levels (2–3 h fast) were measured as described in the “Blood Markers” section. Mice with levels higher than 15 mmol/L were categorized as having type 1 diabetes.
Reconstructed Image Resolution
Measurement of the partial-volume effect in the vena cava will depend on the size of the vessel and scanner resolution. We therefore conducted experiments to determine the recovery coefficient (RC) for the mouse vena cava. The size of the vena cava was determined in 3 mice using CT contrast imaging (nanoSPECT/CT; BioScan). Briefly, animals were anesthetized with isoflurane (2% isoflurane, 2 mL/min oxygen) and injected intravenously with 0.2 mL of Exia CT contrast (SKYSCAN). A 30-s topogram was completed immediately after injection to select the field of view (FOV) over the proximal vena cava. A 9-min CT scan was reconstructed (45 kVp, 1,500 ms exposure time, 360 projections) with 0.2-mm transaxial pixel size. The proximal vena cava diameter located above the kidneys and below the myocardium was measured by an average of 3 measurements on each of the coronal, sagittal, and axial planes (IRW software; Siemens). We subsequently determined the recovery coefficient on the Inveon PET scanner for the vena cava using the full width at half maximum (FWHM) of the gaussian point spread function (PSF) scanner resolution with the perturbation technique (24). Briefly, a 22Na point source (diameter, 0.25 mm; 1 kBq) embedded in a 1-cm3 acrylic cube was placed within the PET scanner such that the point source location corresponded to the center of the vena cava on a reconstructed transaxial PET image. A 5-min acquisition was performed and the data binned into 3-dimensional sinograms. The high-count-density point source sinograms were scaled and added to the mouse sinogram data and reconstructed. The point source sinogram scaling ensures that only a small perturbation is introduced (i.e., <1% of the counts in each mouse sinogram bin) so that the convergence properties of the reconstructed image are minimally affected. The perturbed images were reconstructed using the same parameters as the original mouse images, and the difference was computed to obtain the PSF. The reconstructed image FWHM resolution was determined by fitting a gaussian function to the PSF difference image.
Small-Animal PET Imaging
Small-animal PET 18F-FDG imaging was conducted with the Inveon DPET small-animal scanner. A 60-min list-mode acquisition, together with a 10- to 20-s tail vein injection of 18F-FDG (7–82 MBq in 150 μL), was started. List data were sorted into 26 dynamic frames (12 × 10 s, 3 × 60 s, and 11 × 300 s) and reconstructed using 3-dimensional OSEM with 10 iterations, 16 subsets, and a zoom of 2.5 with a 128 × 128 matrix, resulting in 0.35-mm transaxial pixel size. Images were corrected for radioactive decay, random coincidences, and dead-time losses using the vendor software (IAW, version 1.5; Siemens).
The average vena cava activity was determined from a region of interest (ROI) placed in the corresponding region of the PET image and thresholded to 50% of the local maximum vena cava activity (VC50). The ROI was positioned manually above the kidneys and below the myocardial blood pool in the initial time frames, where the injected tracer bolus is clearly visible.
The RC for the measured vena cava activity was estimated by convolving a circular model of the vena cava with measured diameter, together with the 2-dimensional gaussian PSF representing the reconstructed PET image resolution. Likewise, a complementary uniform background activity was convolved with the same PSF to represent spill-in of activity from the liver into the vena cava ROI. An estimate of the true vena cava activity (AVC) can then be obtained using the following relationship: Eq. 1where B is the background activity determined by placing an ROI adjacent to the vena cava. The adjacent background used for this ROI is the liver (Fig. 1A), which typically has homogeneous 18F-FDG activity uptake and is the largest feature proximal to the vena cava.

Representative images of proximal mouse vena cava and background liver region in early time frames of 18F-FDG scan (A), contrast CT of mouse vena cava (B), and mouse 18F-FDG heart at 60 min (C). (D) Time–activity curve displayed in SUVs for 7 mice. Liver, LV cavity, vena cava, and corrected vena cava blood activity curves are displayed over log of time in 60 min. Blood sampling was conducted at 60-min time point.
Myocardial images were analyzed and quantified with Patlak kinetic analysis (Ki) at 10–40 min from the reconstructed images using FlowQuant semiautomated software (University of Ottawa Heart Institute [UOHI]) (25–27). In brief, uptake images of the left ventricle were formed using the last 5 min of scan data. The location, orientation, and size of the left ventricle were automatically determined by fitting ellipses to the myocardium in the transverse, vertical long-axis, and horizontal long-axis planes. Transverse uptake images were reoriented automatically into short-axis sections, generating LV slices from the apex to the base plane. Polar maps of the relative uptake activity (%) were formed from the sampled data. Blood ROIs were automatically placed in the LV cavity. The sampling points were then applied to all time frames to generate myocardial and blood time–activity curves. Patlak kinetic analysis was applied to the myocardial data using either the blood input function from the FlowQuant automated cavity measurement or the estimated vena cava blood input function (Eq. 1) imported into FlowQuant. This was done such that the exact same myocardium orientations and LV sampling were used with both blood input functions.
Regional rMGU was determined for each animal using the following standard equation: Eq. 2where Ki is the Patlak uptake rate constant, BG is the blood glucose concentration (mmol/mL) obtained before 18F-FDG injection, and LC is the lumped constant equal to 0.67, which accounts for differences in the uptake and phosphorylation of 18F-FDG versus glucose.
18F-FDG uptake in the type 1 diabetic group was also quantified using a standardized uptake value (SUV) at 20 and 40 min to independently evaluate myocardial radiotracer uptake. SUV was calculated according to the following standard equation: Eq. 3
Eq. 3
Image-Derived Input Function Accuracy
To determine the accuracy of the calculated IDIF, 7 mice were scanned after intravenous injection of 18F-FDG, with measurements of blood activity at 60 min, compared with a manual blood sample obtained from trunk blood after decapitation after the scan. Liver was also collected as a homogeneous tissue region. 18F-FDG activity of the samples was measured with a Packard Cobra II γ-counter (Perkin Elmer) and expressed as percentage injected dose (activity) per gram of tissue (%ID/g). %ID/g of each sample was multiplied by the injected activity and divided by 100% to obtain the activity per cubic centimeter of tissue (Bq/cm3), assuming a tissue density of 1 g/cm3.
Test–Retest Repeatability
To evaluate the repeatability of Patlak Ki measurements using the calculated IDIF, 9 mice were scanned twice 3 d apart, using the same procedures listed above. Blood glucose levels were sampled immediately before 18F-FDG injection. An additional blood sample was acquired to measure insulin and free fatty acid (FFA) levels. Patlak Ki values were compared with calculated 2-compartment model Ki values and SUV measurements.
Type I Diabetes
Mice (n = 8) were scanned with 18F-FDG at baseline and 2 wk after streptozotocin injection. An additional scan was conducted 3–4 d later with short-acting insulin (0.08 mU/kg of body weight intraperitoneally; Novolin ge [Novo Nordisk]) injected 30 min before the 18F-FDG scan to assess insulin sensitivity (28). Blood glucose levels for all scans were measured immediately before 18F-FDG injection, with an additional blood sample acquired for measuring insulin and FFA levels.
Blood Markers
Blood was obtained from the saphenous vein with a 25-gauge needle by shaving the back of the leg and applying an alcohol wipe and petroleum jelly to help pool the blood. Blood glucose concentration was measured (mmol/L) with a small drop of blood using the Advantage strips (AccuChek; Roche Diagnostics). Plasma insulin concentrations were measured with the Mouse Ultrasensitive Insulin ELISA kit (ALPCO Diagnostics). Results were analyzed using the GraphPad Prism software (GraphPad Software, Inc.) and expressed in ng/mL. The plasma FFAs were measured with the commercially available Free Fatty Acid Quantification Kit (BioVision Inc.), with concentration of each sample expressed as mmol/L.
Statistical Analysis
Curve fitting with FlowQuant software was performed using MATLAB (The MathWorks). All data are expressed as mean ± SD. Data were compared using either an F test for variance, a Z test, a Student t test, or a 1-way ANOVA with multiple comparisons between groups using a Bonferroni post hoc comparison. A P value of less than 0.05 was considered significant.
RESULTS
Vena Cava Measurements
The measured average diameter of the mouse vena cava was 2.54 ± 0.30 mm (Fig. 1B). The image FWHM resolution was estimated as 1.02 ± 0.04 mm in the early frames (from time 0 to the peak vena cava activity), compared with 1.71 ± 0.12 mm in the subsequent time frames. This difference in image resolution is due to the known nonlinear effects of OSEM image reconstruction that are dependent on temporal changes in local count-density and contrast. Using this time-dependent image PSF and the circular vessel dimension from CT, the vena cava RC value of 0.76 ± 0.04 estimated for the early frames was significantly higher than 0.61 ± 0.07 used for later time frames following the peak vena cava activity.
IDIF and Organ Activity Accuracy
The transaxial FOV on the Inveon DPET scanner is 10 cm, and the axial FOV is 12.8 cm, allowing for the whole mouse to be imaged in a single bed position. The left ventricle, when placed in the center of the FOV, has excellent resolution and contrast. The right ventricle is also apparent (Fig. 1C). Table 1 presents the image-derived activities from the liver, vena cava, and LV cavity, compared with the tissue activities measured with the γ-counter. Evident in the liver, where there is relative homogeneity of signal and minimal partial-volume effect due to the large size of the organ, there is a slight bias in measurements (20%) between the PET image and the γ-counter. The blood activity from both the LV cavity and the vena cava had lower population variability, compared with γ-counter measurements of the trunk blood (23% and 20% vs. 29%, respectively; P < 0.01, F8). The LV cavity blood activity measured from the PET images at 60 min was almost 6-fold higher than the measured γ-counter activity, whereas the vena cava PET image activity was only 38% higher. When the vena cava activity was normalized using the image–to–γ-counter activity ratio in the liver (liver ratio), this difference was further reduced to 17%. The full 60-min blood input functions (n = 7 mice) were compared for the LV cavity, uncorrected vena cava, liver (background region), and calculated vena cava activity (Fig. 1D). The early peak of the vena cava input function was higher than the LV cavity curve and demonstrated a slow decline in the later time frames, as expected, whereas the LV cavity curve actually displayed a slight increase, potentially because of activity spilling in from the surrounding myocardium.
Image-Derived Activity, Compared with γ-Counter Activity, at 60 Minutes
Test–Retest Repeatability
Because there were only 3 d between scans, there was no difference in body weight. Blood glucose and insulin values were not significantly different between scans; however, plasma FFA was significantly decreased, approximately 41% (47.9 ± 11.1 vs. 28.0 ± 5.4 mmol/L, P < 0.05, t test).
Figure 2 shows representative polar maps and Patlak analysis curves from 1 mouse. Figures 2A and 2B are test–retest results in mouse 1 using the corrected vena cava blood input function. Patlak polar maps appear similar, with an excellent linear fit observed at the specified interval of 10–40 min. Patlak Ki values had a range of 0.23 to 0.66 mL/min/g between mice, with a mean of 0.50 ± 0.11 mL/min/g representing a 23% population coefficient of variability and good repeatability (Fig. 3A, r2 = 0.57). Figures 2C and 2D show the same mouse test–retest scans using the LV cavity as the blood input function. There is a clear difference in the Patlak polar maps and a relatively poor fit to the data, with Ki values ranging from 0.08 to 0.37 mL/min/g between mice and a coefficient of variability of 51% (mean, 0.15 ± 0.08 mL/min/g).

Patlak polar maps and plots of representative test–retest mouse using vena cava blood input function for scan 1 (A) and scan 2 (B) and using LV cavity blood input function for scan 1 (C) and scan 2 (D).
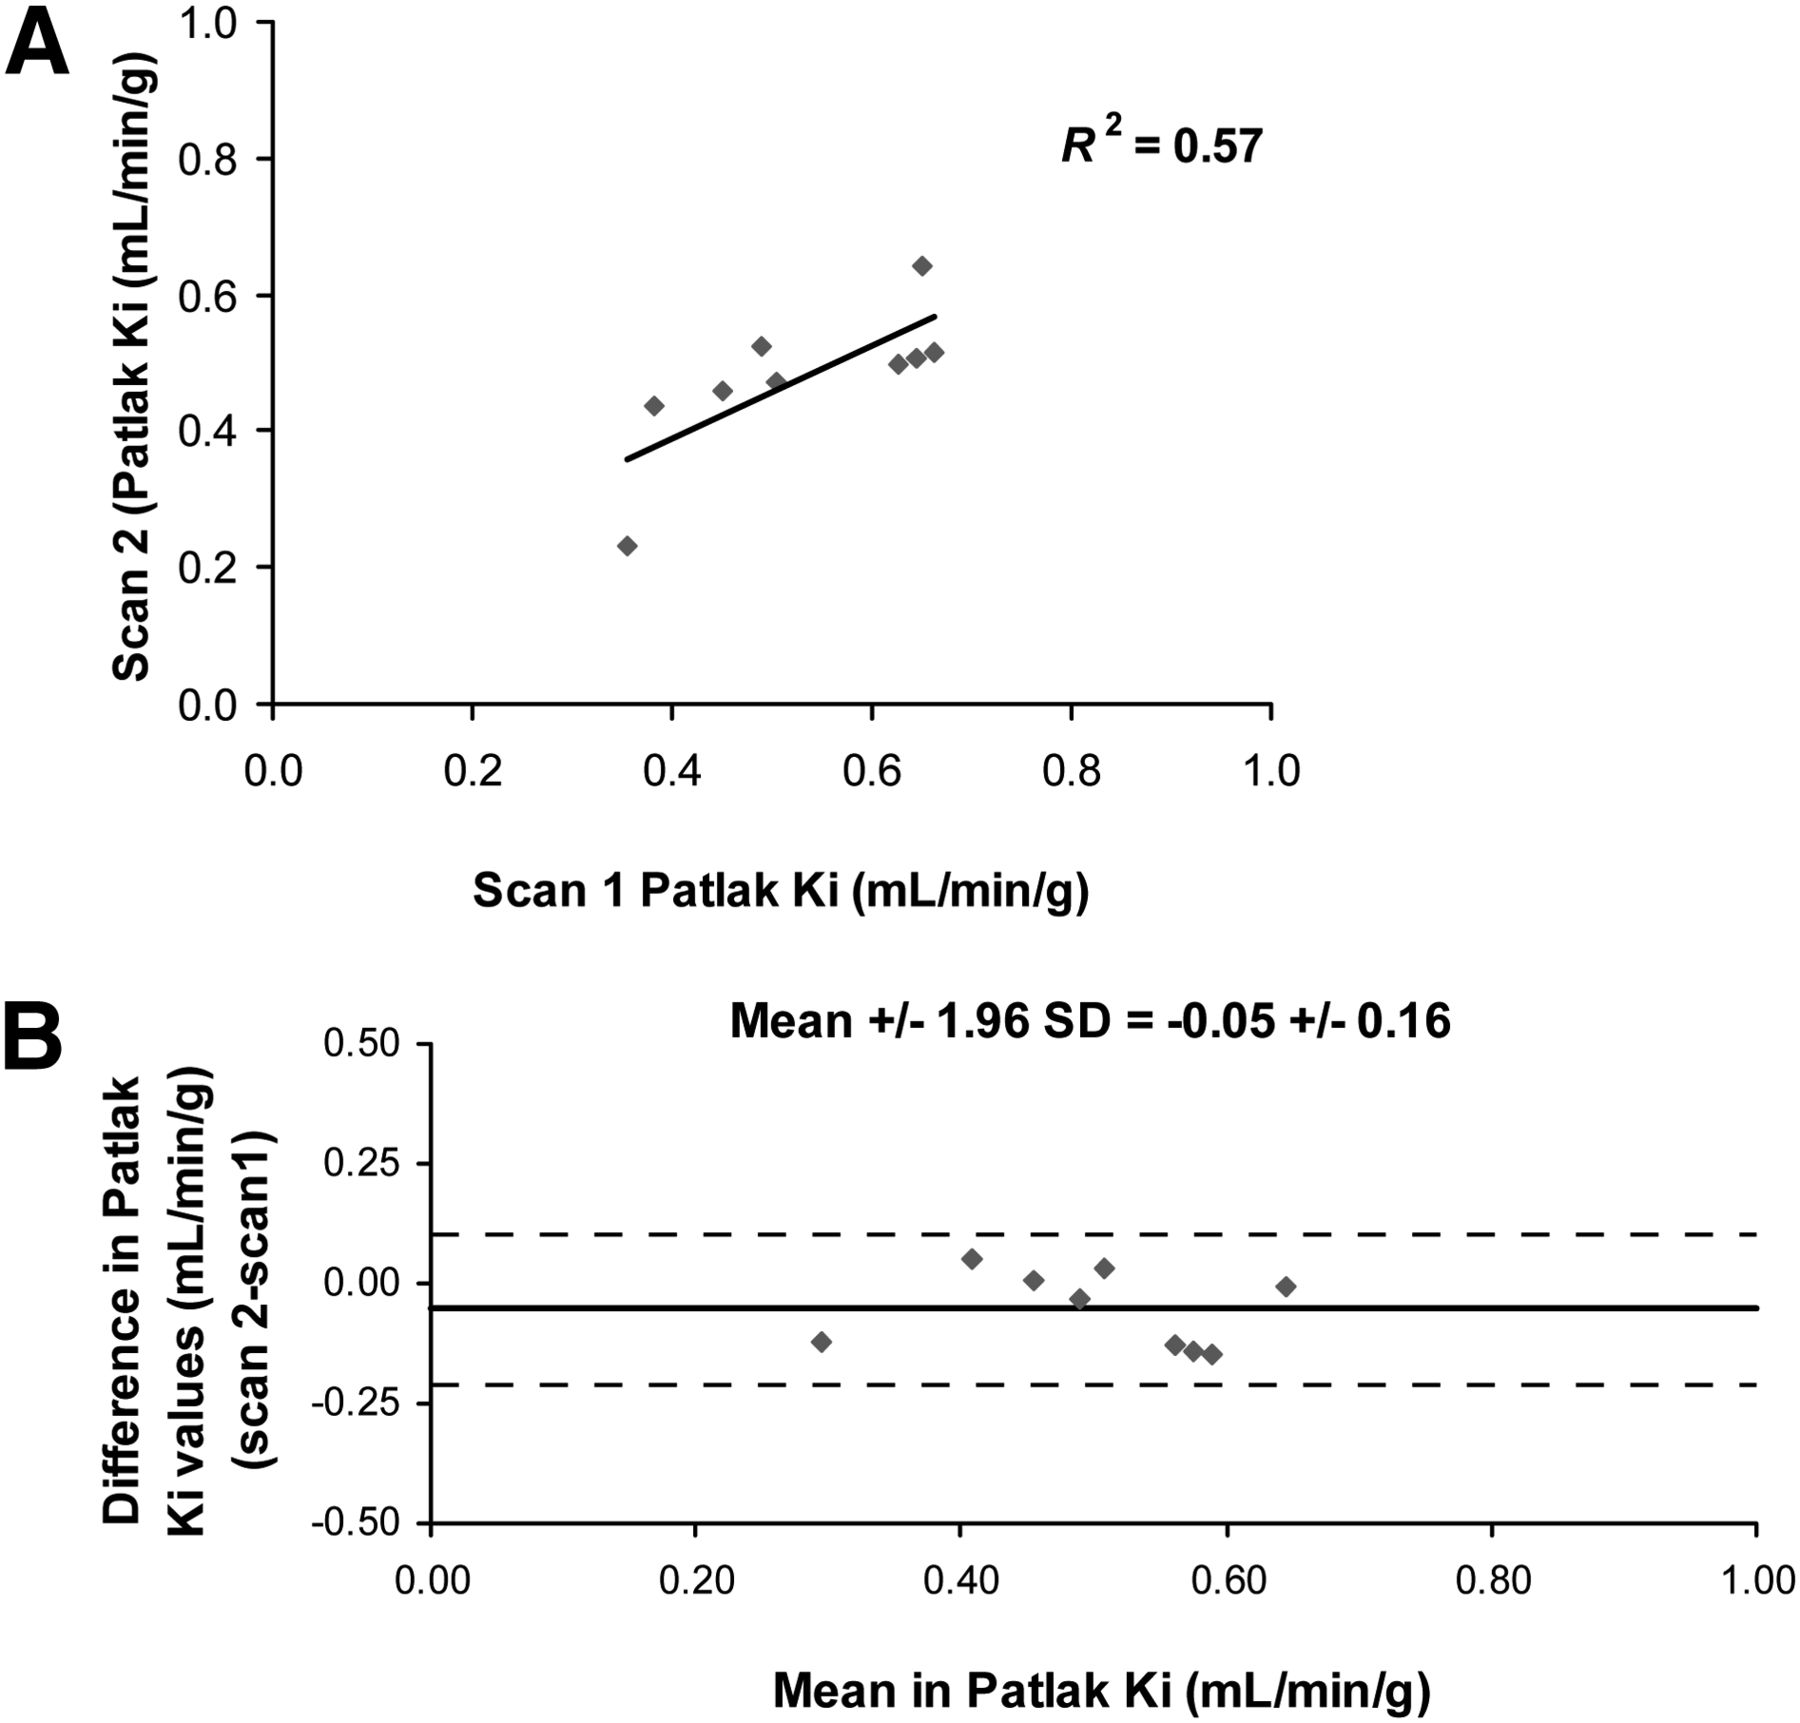
Comparison of test–retest Patlak Ki values using vena cava IDIF (A), with dashed line representing line of identity. Bland–Altman plots of test–retest Patlak K using vena cava IDIF (B).
Bland–Altman plots of the Patlak Ki values from scans 1 and 2 using the corrected vena cava blood input function had no significant bias (P > 0.05, t test) (Fig. 3B) and a coefficient of repeatability of 0.16 mL/min/g (32% of mean). We compared these results to Ki values derived from a 2-comparment 3K model and SUV at 30- to 60-min frames (Table 2). We found that the 2-compartment model had a higher population variability at 31% (compared with 23% with Patlak Ki) and a higher coefficient of repeatability at 39% (compared with 32% with Patlak). SUV analysis provides the lowest values, with 21% population variability and a coefficient of repeatability of 17%.
Comparison of Kinetic Modeling Measurements
Type 1 Diabetes
Body weight and plasma insulin were significantly reduced in the type 1 diabetic state, compared with baseline values (P < 0.05, ANOVA Bonferroni) (Table 3). Plasma FFA levels were increased significantly only during the acute insulin scan. As expected, blood glucose levels were significantly increased in the type 1 diabetic state and reduced to baseline levels after acute insulin stimulation before 18F-FDG injection (Table 3). Representative images display an excellent fit using Patlak analysis with the corrected vena cava blood input at baseline (Fig. 4A), during untreated type 1 diabetes (Fig. 4B), and after acute treatment with insulin (Fig. 4C). rMGU values were significantly reduced by 60% from baseline to type 1 diabetes. After acute insulin treatment, rMGU increased by 40% toward baseline values (Table 4). Interpretation of these changes was confirmed with similar relative changes in SUV at 20 and 40 min (Table 4).
Body Weight and Blood Markers in Type 1 Diabetes Mellitus Mice

Representative Patlak polar maps and plots at baseline (A), after type 1 diabetes induction (B), and after acute insulin stimulation (C).
rMGU and SUVs at Baseline, After Induction of Type 1 Diabetes, and After Acute Insulin Treatment
DISCUSSION
In this study, we developed a methodology for acquiring an accurate and repeatable blood IDIF using the vena cava in mice. Using a fed state with isoflurane as the anesthetic, we found as in previous studies (13–15,17,18) that the myocardium had high tissue-to-background contrast. However, the small size of the mouse LV cavity on the order of the spatial resolution of the small-animal PET scanner, with substantial myocardial activity spillover, resulted in an inaccurate assessment of the blood IDIF. Although an SUV can be used to compare activity concentration in a tissue of interest at 1 particular time point, it has been noted that kinetic modeling is needed to assess even the simplest of changes in metabolic rate constants (13), such as increased 18F-FDG uptake rate with insulin stimulation.
We investigated the proximal portion of the vena cava for measurement of an IDIF. In human studies, venous and arterial concentrations of 18F-FDG are considered to be equal at 30–60 min after injection of tracer (29). In mice, with their high cardiac output rate, we hypothesized that the distribution of tracer from venous to arterial blood occurs at a substantially higher rate. Additionally, the location of the vena cava for 18F-FDG scans removes most high-activity areas from the proximity of the vena cava ROI, reducing activity spillover from adjacent background regions. The adjacent background used for this ROI is the liver, which typically has homogeneous 18F-FDG activity uptake. We were able to derive an RC for the vena cava using measured values of the reconstructed image resolution to estimate the true vena cava activity (Eq. 1). Manual blood sampling was performed at 60 min to confirm the accuracy of the calculated vena cava blood activity. We found a 17% difference between the measured blood activity and the image-derived vena cava activity when using the liver as a standard between the small-animal PET camera and γ-counter. This difference was substantially lower than the blood input function derived from the LV cavity, which was approximately 575% higher than the γ-counter–measured blood activity. To compare with previously published data from Locke et al. (18), we reconstructed our data using their reconstruction parameters without gating. Despite an improvement from our calculated values, the IDIF from the LV cavity was 130% different from measured γ-counter activity. As stated in their paper, gating to reduce activity spillover from the myocardium is essential to determine an accurate LV cavity IDIF (18). However, long reconstruction times (∼34 h per mouse) and dependency on accurate electrocardiogram gating in all animal models render this method difficult to execute.
The vena cava time–activity curves display an earlier, sharper, and higher initial input function than the LV cavity curves. We postulate that this does not adversely affect the accuracy of the Patlak analysis because integral activity is used for the analysis, and the shape of the curve outside the analysis time range (10–40 min) is of no consequence. Later time frames with the vena cava IDIF display a slow decline in activity concentration, consistent with 18F-FDG uptake and retention in tissue, rather than the increase in activity concentration observed with the LV cavity. We presume that the increase in the LV cavity blood input function is due to myocardial spillover. Kreissl et al. (13) noted that the initial time frames when the left ventricle had low myocardial 18F-FDG uptake were appropriate for measurements of the LV cavity blood input function, whereas later frames of the blood IDIF can be derived through computer modeling with 2 blood samples.
The Patlak Ki test–retest population variability was 23% with the vena cava blood input function, reduced from 51% when using the LV cavity blood input function (P < 0.05). The Patlak Ki coefficient of repeatability with the vena cava blood input function was 32%, with no significant bias between scan 1 and scan 2 (P > 0.05). We additionally evaluated Ki for the 2-compartment model and found an increase in both the test–retest population variability and the coefficient of repeatability, which could be explained by the larger number of free parameters in the model.
We validated this methodology in a streptozotocin-induced type 1 diabetic mouse model. Type 1 diabetes is known to exhibit a reduction in insulin-stimulated glucose uptake due to an overall reduction in endogenous insulin. Although the type 1 diabetes model will produce large perturbations in rMGU values, we chose this model because it is a well-established model of hyperglycemia and alterations in myocardial glucose uptake. Induction of type 1 diabetes significantly reduced rMGU by 60%, compared with baseline scans (P < 0.05). We further validated that we could measure an increased glucose uptake with an acute treatment of insulin in the type 1 diabetic mouse. A significant 40% increase in rMGU was observed, returning the measurement close to baseline prediabetic levels (P > 0.05). These changes were supported by SUVs calculated at 20 and 40 min, capturing 2 time frames within the Patlak Ki time interval of 10–40 min.
In clinical studies, patients fast for a minimum of 6 h before scanning, with nondiabetic patients receiving an oral glucose load before 18F-FDG injection and diabetic patients an insulin–euglycemic clamp to ensure that baseline blood glucose levels are not significantly different (30–32). Kreissl et al. (13) found that as in humans, fasting reduced cardiac 18F-FDG uptake rates in mice by approximately 5- to 6-fold. We did not perform our methodology under fasting conditions with an insulin–euglycemic clamp because the objective was to characterize the changes (if any) in the type 1 diabetic model from baseline, and the use of a clamp would normalize diabetic glucose uptake, as has been previously reported in human patients (33). All 18F-FDG imaging protocols were conducted in the fed state.
One of our study’s limitations is the fact that blood sampling for accuracy was performed only at the 60-min time point as opposed to sampling throughout the scan. Although the authors acknowledge this as a limitation, the 60-min time point is representative of when the highest myocardial spillover is present and contaminating the LV cavity blood input curve. This method is also strongly dependent on the RC values, which may change with alterations in the reconstruction parameters, both postreconstruction filters and MAP priors, number of iterations, and sizes of subsets. As such, the results are applicable only to the parameters used in this study. The degree that spillover influences the measured values depends heavily on the distribution of the tracer background uptake. Extending this approach to other tracers or using this in models for which the uptake of 18F-FDG in the liver or blood clearance altered should be approached with caution and may require additional validation.
CONCLUSION
A new methodology for measuring mouse 18F-FDG myocardial glucose uptake was developed using an image-derived blood input function with excellent repeatability. Additionally, this is the first study, to our knowledge, to demonstrate alterations in rMGU measurements of 18F-FDG in a mouse type 1 diabetic model. This methodology allows users to quantify changes in rMGU serially and noninvasively in mouse models with 18F-FDG and further translate this information directly to the clinical setting.
DISCLOSURE
The costs of publication of this article were defrayed in part by the payment of page charges. Therefore, and solely to indicate this fact, this article is hereby marked “advertisement” in accordance with 18 USC section 1734. This study was supported in part by the Heart and Stroke Foundation of Ontario (HSFO) Program Grant on Molecular Function and Imaging (no. PRG6242) and a Heart and Stroke Foundation PhD Scholarship. No other potential conflict of interest relevant to this article was reported.
Acknowledgments
We thank Julia Lockwood for technical assistance with CT imaging and the Animal Care and Veterinary services of the University of Ottawa for their assistance with animal health.
Footnotes
Published online Aug. 12, 2013.
- © 2013 by the Society of Nuclear Medicine and Molecular Imaging, Inc.
REFERENCES
- Received for publication June 15, 2012.
- Accepted for publication March 26, 2013.


Jump to section
Related Articles
Cited By...
- Antibody-Based PET Imaging of Misfolded Superoxide Dismutase 1 in an Amyotrophic Lateral Sclerosis Mouse Model
- Deletion of interleukin 1 receptor-associated kinase 1 (Irak1) improves glucose tolerance primarily by increasing insulin sensitivity in skeletal muscle
- Assessing Cardiac Metabolism: A Scientific Statement From the American Heart Association
- Deletion of MLIP (Muscle-enriched A-type Lamin-interacting Protein) Leads to Cardiac Hyperactivation of Akt/Mammalian Target of Rapamycin (mTOR) and Impaired Cardiac Adaptation
- Impact of Image-Derived Input Function and Fit Time Intervals on Patlak Quantification of Myocardial Glucose Uptake in Mice
- Glutaredoxin-2 Is Required to Control Oxidative Phosphorylation in Cardiac Muscle by Mediating Deglutathionylation Reactions
- Noninvasive Measurement of Mouse Myocardial Glucose Uptake with 18F-FDG
- Reply: Noninvasive Measurement of Mouse Myocardial Glucose Uptake with 18F-FDG