


Abstract
We investigated the biodistribution and radiation dosimetry of the PET amyloid imaging agent 11C-PIB (11C-6-OH-BTA-1) (where BTA is benzothiazole) in humans. Previous radiation exposure estimates have been based on animal experiments. A dosimetry study in humans is essential for a balanced risk–benefit assessment of 11C-PIB PET studies. Methods: We used data from 16 different 11C-PIB PET scans on healthy volunteers to estimate radiation exposure. Six of these scans were dynamic imaging over the abdominal region: 3 covering the upper abdomen and 3 covering the middle abdomen. On average, 489 MBq of 11C-PIB (range, 416–606 MBq) were injected intravenously, and dynamic emission scans were recorded for up to 40 min. Two subjects had whole-body imaging over the entire body to illustrate the biodistribution. PET brain scans and blood and urine radioactivity measurements from our previous 11C-PIB studies were also analyzed. Thirteen source organs and the remainder of the body were studied to estimate residence times and mean radiation-absorbed doses. The MIRD method was used to calculate the radiation exposure of selected target organs and the body as a whole. Results: There is a high degree of consistency between our human data and previous biodistribution information based on baboons. In our study, the highest radiation-absorbed doses were received by the gallbladder wall (41.5 μGy/MBq), liver (19.0 μGy/MBq), urinary bladder wall (16.6 μGy/MBq), kidneys (12.6 μGy/MBq), and upper large intestine wall (9.0 μGy/MBq). The hepatobiliary and renal systems were the major routes of clearance and excretion, with approximately 20% of the injected radioactivity being excreted into urine. The effective radiation dose was 4.74 μSv/MBq. Conclusion: The established clinical dose of 11C-PIB required for 3-dimensional PET amyloid imaging has an acceptable effective radiation dose. This dose is comparable with the average exposure expected in other PET brain receptor tracer studies. 11C-PIB is rapidly cleared from the body, largely by the kidneys. From the viewpoint of radiation safety, these results support the use of 11C-PIB in clinical PET studies.
Deposits of amyloid β (Aβ) in the brain appear to be crucial in the pathogenesis of Alzheimer's disease (AD) (1). Amyloid-binding tracers for PET have been developed for studying Aβ plaques in AD (2), with 11C-PIB, or 11C-6-OH-BTA-1 (where BTA is benzothiazole), being one of the most promising compounds (3). It has been shown that 11C-PIB readily crosses the blood–brain barrier and that it has high affinity and selectivity for Aβ (4,5). Its retention in brain seems to be inversely related to cerebral glucose metabolism measured with 18F-FDG (6), with increased uptake in brain regions typically affected by Aβ aggregates.
In ongoing clinical studies, 11C-PIB PET is being examined to determine whether the tracer has utility in the differential diagnosis and follow-up of AD and in evaluating the efficacy of antiamyloid therapies. To enable the continued use of 11C-PIB and to confirm safety, it is important to determine the radiation exposure caused by such studies. A radiation dosimetry study with baboons showed that 11C-PIB was eliminated by the hepatobiliary and renal systems and that the critical organ was the gallbladder wall (7). In that study, data from 2 baboons were used to estimate human radiation doses; as yet, to our knowledge, no human data on 11C-PIB dosimetry are available. Therefore, we investigated the biodistribution and excretion of 11C-PIB in 6 healthy volunteers with a dynamic scanning protocol in the abdominal region. Three subjects had their middle abdominal region in the tomography field of view to measure radioactivity in the liver, kidneys, stomach, and intestine. Three subjects were positioned for scanning radioactivity in the heart wall, lungs, and spleen. We also observed the biodistribution in the entire body with 2 whole-body images. Also, 5 brain scans from a previous study by our group (8) were reanalyzed. Absorbed dose estimates were based on 11C-PIB residence times in source regions, which were defined from dynamic radioactivity concentration curves.
MATERIALS AND METHODS
Subjects
The protocol of this study was approved by the local ethics committee and the Finnish National Agency for Medicines. Eight healthy male volunteers, 22- to 42-y old (mean ± SD, 27.5 ± 6.7 y; median age, 27 y), were recruited for dynamic PET of the upper or middle abdominal region or the entire body after written informed consent was given. The subjects weighed 65–96 kg (mean ± SD, 76.4 ± 11.2 kg; median, 73 kg). These body weights are close to the 70-kg Reference Man's weight of the MIRDOSE3.1 software (9). All subjects were free of somatic and neuropsychiatric illness, according to history and thorough physical examination.
To estimate the absorbed dose in the brain, we reanalyzed the brain images of 5 healthy control subjects (3 females) who participated in a previous 11C-PIB imaging study on AD (8). The subjects were 59- to 73-y old (mean ± SD, 67.4 ± 4.9; median, 70 y) and weighed 59–101 kg (mean ± SD, 79.0 ± 20.6 kg; median, 75 kg).
During the data analysis, we discovered that additional gallbladder images at later time points would be needed because of continuous uptake of tracer. Therefore, the study protocol was amended to include another 3 healthy control subjects (age, 78, 78, and 82 y; weight, 68, 57, and 70 kg) participating in a 11C-PIB brain study. An additional gallbladder scan was obtained after the brain scans.
An intravenous line was inserted into each subject's forearm for the 11C-PIB injection. An arterial cannula was inserted into the radial artery of the opposite arm for arterial sampling during the PET scan. This sampling was done to acquire whole-blood time–activity values for modeling and also to determine heart content radioactivity in our dosimetry study.
Radiochemistry and Radioligand Purity
11C-6-OH-BTA-1 was produced by a reaction of 0.8 mg 6-OH-BTA-0 and 11C-methyl triflate in 100 μL acetone for 3 min at 80°C. The crude product was purified using high-performance liquid chromatography with a μBondapak column (Waters) using an eluent of 0.01 mol/L phosphoric acid/acetonitrile (63:37) and a flow of 5 mL/min. After addition of 0.3 mL of sterile propylene glycol/ethanol (7:3, v/v), the fraction containing the product was evaporated and redissolved in sterile propylene glycol/ethanol (7:3, v/v)/physiologic phosphate buffer (0.1 mol/L, pH 7.4; 1.5:8.0) and filtered through a 0.2-μm Acrodisc 4192 sterile filter (Gelman). The radioligand purity in our study ranged from 95.5%–99.9%, averaging 98.2% (SD, ±1.5%; median, 98.1%). Specific radioactivity averaged 29.0 MBq/nmol (range, 15.4–37.3 MBq/nmol; SD, ±5.7 MBq/nmol; median, 28.4 MBq/nmol).
MRI
Abdominal MRI was performed on 6 healthy volunteers with a 1.5-T Intera scanner (Philips) for anatomic reference. T1-weighted 3-dimensional scans with a voxel size of 1.56 × 1.57 × 4.00 mm were obtained with subjects holding their breath. The location of the kidneys was marked on the subjects' skin based on the MRI data to consider interindividual anatomic variance when positioning the subject for PET. The brain images were obtained with the same scanner, with a voxel size of 0.50 × 0.50 × 1.00 mm. Metal objects in the body and claustrophobia were contraindications to MRI. The MR images were viewed simultaneously with the PET image slices, and they aided in confirming the positions of some source regions that were less visible on the PET images, when drawing regions of interest (ROIs) on the PET sum images.
PET Imaging
PET was performed with an ECAT EXACT HR+ scanner (CTI/Siemens) in 2-dimensional mode. The field of view on the scanner consists of 63 image slices in 15.5 cm with 2.46-mm slice separation (10). To enable attenuation correction of dynamic images, a transmission scan of 5-min duration using 68Ge rod sources was obtained before the injection of 11C-PIB. A rapid bolus injection of 416–606 MBq (mean ± SD, 489 ± 61; median, 471) was given intravenously.
Upper abdominal scans were performed on 3 subjects to obtain data for the heart wall, liver, stomach, spleen, and intestine. Three subjects underwent middle abdominal imaging to investigate the kidneys, liver, and back muscles. All abdominal regions included vertebral bodies and the liver. When imaging either of the 2 abdominal regions, a 40-min emission scan consisted of 23 frames (8 × 15, 6 × 30, 5 × 180, and 4 × 300 s) and was acquired with a stable bed position. These dynamic acquisitions were reconstructed with the filtered back projection algorithm using the Hann filter and a 4-mm cutoff frequency.
A whole-body PET scan over the entire body was performed with 2 different subjects to assess the distribution of 11C-PIB. The first whole-body scanning was started 5 min after the 11C-PIB injection and was acquired from the head to upper thigh. The other whole-body imaging was started 11 min after bolus injection and was acquired from the upper thigh to head . Each bed position had an emission scan of 5 min and a transmission scan of 2 min.
We also included previously acquired 11C-PIB PET data from an AD project (8) for brain, blood, and urine radioactivity analyses. The brain images were attained with an Advance PET scanner (GE Healthcare) and consisted of 35 image slices in a 15.2-cm-long field of view, yielding 4.25-mm slice separation (11). Transmission scans of 10–15 min were acquired before 90-min 3-dimensional emission scans. The dynamic images consisted of 28 frames (4 × 30, 9 × 60, 3 × 180, 10 × 300, and 2 × 600 s). The injected activities were 285–332 MBq (mean ± SD, 304 ± 19 MBq; median, 304 MBq).
Arterial blood samples were taken during the scans as follows: 0–5 min with an online detector (ABSS, Allogg, on the HR+ scanner; or FRQ, GE Healthcare, on the Advance scanner) and manually at 3, 8, 12, 25, and 40 min or at 3, 8, 12, 25, 45, 60, 75, and 90 min after the tracer injection. Both online detectors and the well counter (Wizard 1480; Wallac) for manual blood sample measurements were cross-calibrated with the PET scanners via an ionization chamber (Veenstra Instruments).
Urination was controlled during the 11C-PIB PET study. The subjects were asked to void before the PET session and after scanning was completed. We recorded the time of voiding through a time stamp system in the lavatory. The urine samples were acquired between 46 and 141 min after the injection of 11C-PIB. After measuring the total volume of voided urine, a 2.5-mL sample was taken with a dropper; this sample was measured in an ionization chamber and this time was recorded to enable decay calculation. The radioactivity in the urine at the time of voiding was estimated as the fraction of the injected 11C-PIB radioactivity.
Dosimetry
Absorbed doses were calculated with the MIRD algorithm (developed by the MIRD Committee of the Society of Nuclear Medicine) for radiation dose calculations in internal exposure (12). The equation for the mean absorbed dose (D) in a target organ (rk) from injected radioactivity (A0) is: Eq. 1where S contains the physical characteristics of 11C (half-life, emission types and energies, and penetration ability of the radiation) and the specific fraction of energy absorbed in each source–target organ pair. Residence time (τh) includes the kinetics of the radionuclide in the source organ (rh).
The MIRD algorithm is implemented in the MIRDOSE3.1 program (Oak Ridge Institute for Science and Education, Oak Ridge, TN) (9). We measured the residence time for a source region as the ratio of accumulated to injected radioactivity. The other values for absorbed dose calculation were tabulated in MIRDOSE3.1 according to the selected radionuclide and phantom.
To measure the accumulation of 11C-PIB in selected source regions, the PET images were studied with the image analysis software Imadeus Academic 1.10 (Forima Inc.). ROIs were drawn on representative parts of the liver, heart, kidney cortices (bilaterally), kidney pelvises (bilaterally), spleen, gallbladder, lungs (bilaterally), stomach, large intestine, back muscles, and vertebral bone (representing cortical bone). ROIs were drawn on the sum images of either the first 4 min (frames 1–12) or the last 20 min (frames 20–23). Some organs were more visible on the sum images in the earlier part of the scan because of vascular activity, and others were more visible in the later part of the scan because of radiotracer uptake or metabolism.
The brains were analyzed with the same procedure as the other organs despite different scanning duration and framing. The lung ROIs were drawn according to anatomic landmarks on the transmission images because of better contour visibility. The back muscles and vertebral bodies lacked visible radioactivity on the PET images, and their ROIs were drawn on sum PET images while determining their positions by viewing corresponding MRI slices and transmission slices simultaneously. The ROIs for each source organ were drawn on 4 consecutive image planes on a minimum of 3 different subjects' images. The ROIs were drawn manually, separately for each subject and for each plane considering interindividual variation in anatomy.
The subjects' ROIs were imposed on their dynamic images, and time–activity values were acquired with the Imadeus software. The time–activity curves represented the radioactivity concentrations of each organ plotted against time. They were normalized to express the values for a 70-kg reference adult man and a 1-MBq injection. The normalization formula is: Eq. 2where C′(t) is the normalized radioactivity concentration in kBq/mL, C(t) is the measured radioactivity concentration from the ROI analysis, A0 is the injected radioactivity, W is the subject's body weight, and
  is the reference body weight of 70 kg.
The decay corrections automatically calculated during image reconstruction were reversed, and the normalized, nondecay–corrected time–activity curves were fitted with 3-exponential functions. The concentration curves were extrapolated to infinity. The dynamic acquisition time of 40 min was not sufficient to measure the clearance of 11C-PIB in the gallbladder and upper large intestine. Physical decay according to the half-life of 11C (20.4 min) was taken as the clearance of radioactivity in the upper large intestine after the last measured value, because the curve was already descending at 40 min. However, extrapolation of gallbladder radioactivity concentration with the physical decay function was not reasonable because of a still-ascending curve at 40 min. Therefore, additional measurements were required to predict the clearance of 11C-PIB from the gallbladder. The gallbladder regions of 3 healthy subjects participating in a 11C-PIB brain study were scanned with the HR+ scanner at approximately 100 min from injection, after their 90-min brain scans. The gallbladder data with a 40-min dynamic phase and 3 later time points were fitted with the 3-exponential function, and analysis was performed using the same procedures as described earlier.
The blood radioactivity measurements by the online detector and the manual samples were combined to form a continuous curve of radioactivity concentration in kBq/mL as a function of time. The values were normalized and the decay correction was reversed. The descending part of the curve was then fitted into a 2-exponential function and the curve was extrapolated to infinity.
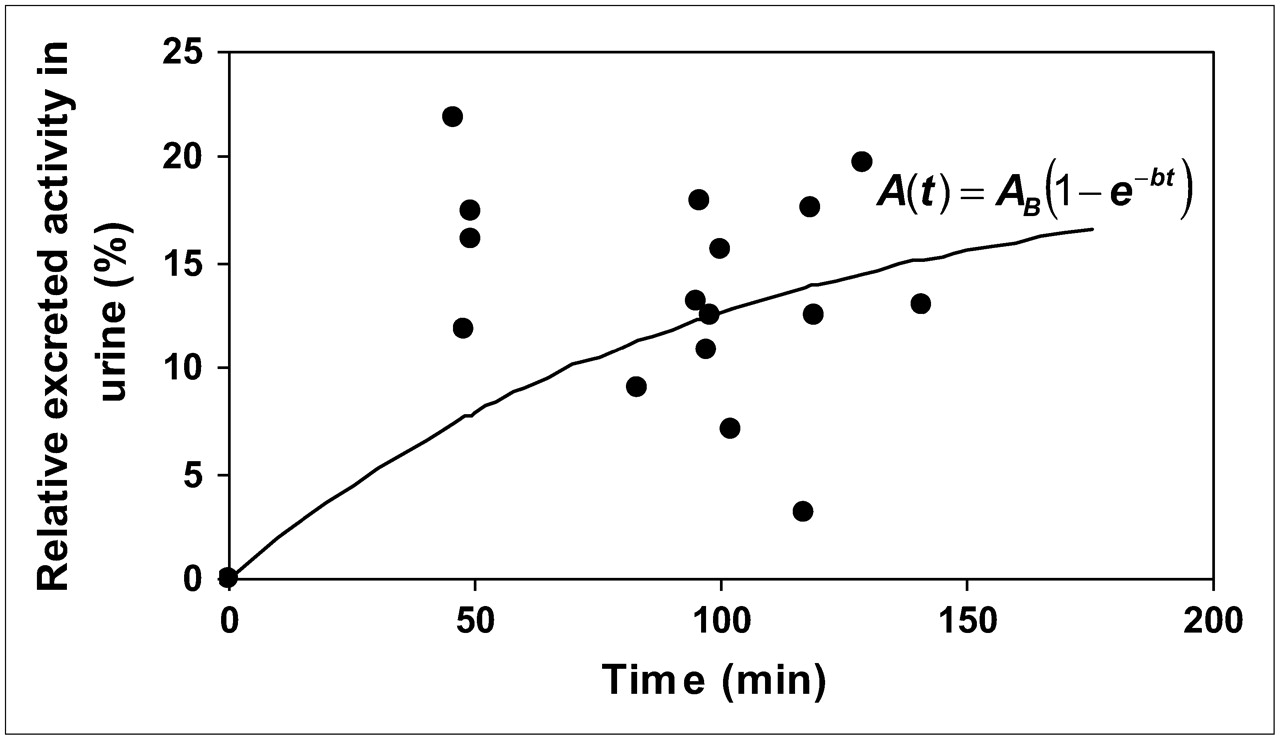
Urine radioactivity data from 16 different subjects were combined into one dataset. These subjects were of different ages, ranging from 22 to 73 y. Each measurement represented the radioactivity in voided urine, whereas the radioactivity in the residual (nonvoided) urine could not be estimated. Being aware of this methodologic weakness, we modeled the values with the empiric formula of exponential in-growth (13): Eq. 3Equation 3 was used as a pattern of 11C-PIB excretion into urine. The rate coefficient for clearance, b, was estimated by adjusting the total excretion fraction of the injected radioactivity in urine, AB, to different values between 15% and 40% to fit the measured data. The mean sample volume of the measurements, V = 384 mL, and the mean injected radioactivity were used to convert the fractional data to radioactivity concentration data.
The residence time in each source region was acquired by integrating the area under the fitted time–activity concentration curve and multiplying that area by the source organ volume in a 70-kg Reference Man (14). The residence times for source tissues, including blood, were entered into the MIRDOSE3.1 program. Radioactivity in the remainder of the body (outside the measured organs) was acquired by subtracting the source organ values from the total decayed value of the injected radioactivity. The effective dose was calculated from the target organ absorbed doses according to the ICRP 60 recommendations (15).
RESULTS
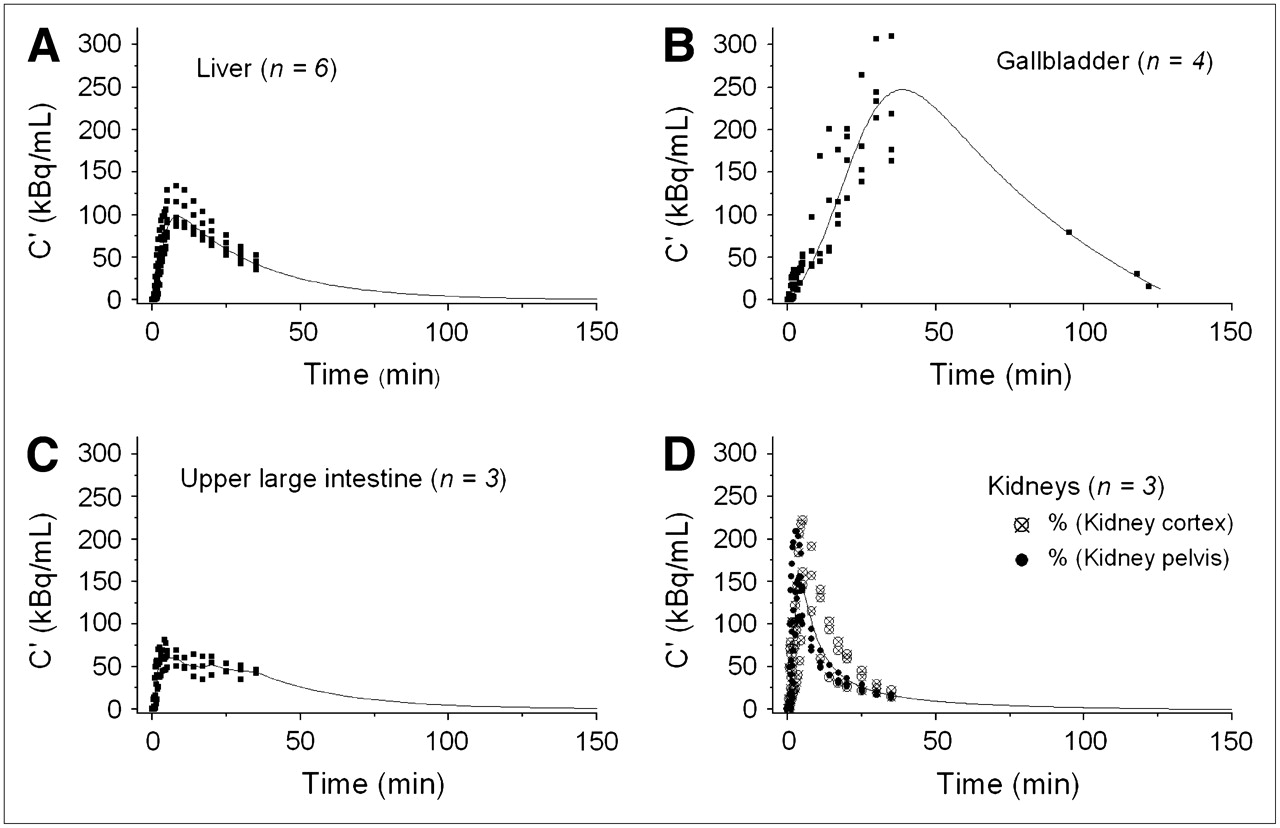
Highest accumulation of 11C-PIB was visually observed in the gallbladder, liver, and urinary bladder (Fig. 1). To calculate absorbed doses in the target organs, we estimated the residence times in the source regions as areas under the time–activity curves. The time–activity curves of the primary source organs are presented in Figure 2. The liver curve is a model case of fitting measured data with a 3-exponential function. The gallbladder curve (Fig. 2B) includes both the dynamic phase during 40 min and 3 steady-state measurements at approximately 100 min. The kidney cortex and kidney pelvis values did not differ markedly, and the data of the 2 regions were combined (Fig. 2D). Although there are no separate anatomic models for kidney pelvis and cortex in MIRDOSE3.1, we ignored the slightly lower concentration in the kidney pelvis and calculated one averaged residence time for the kidneys.
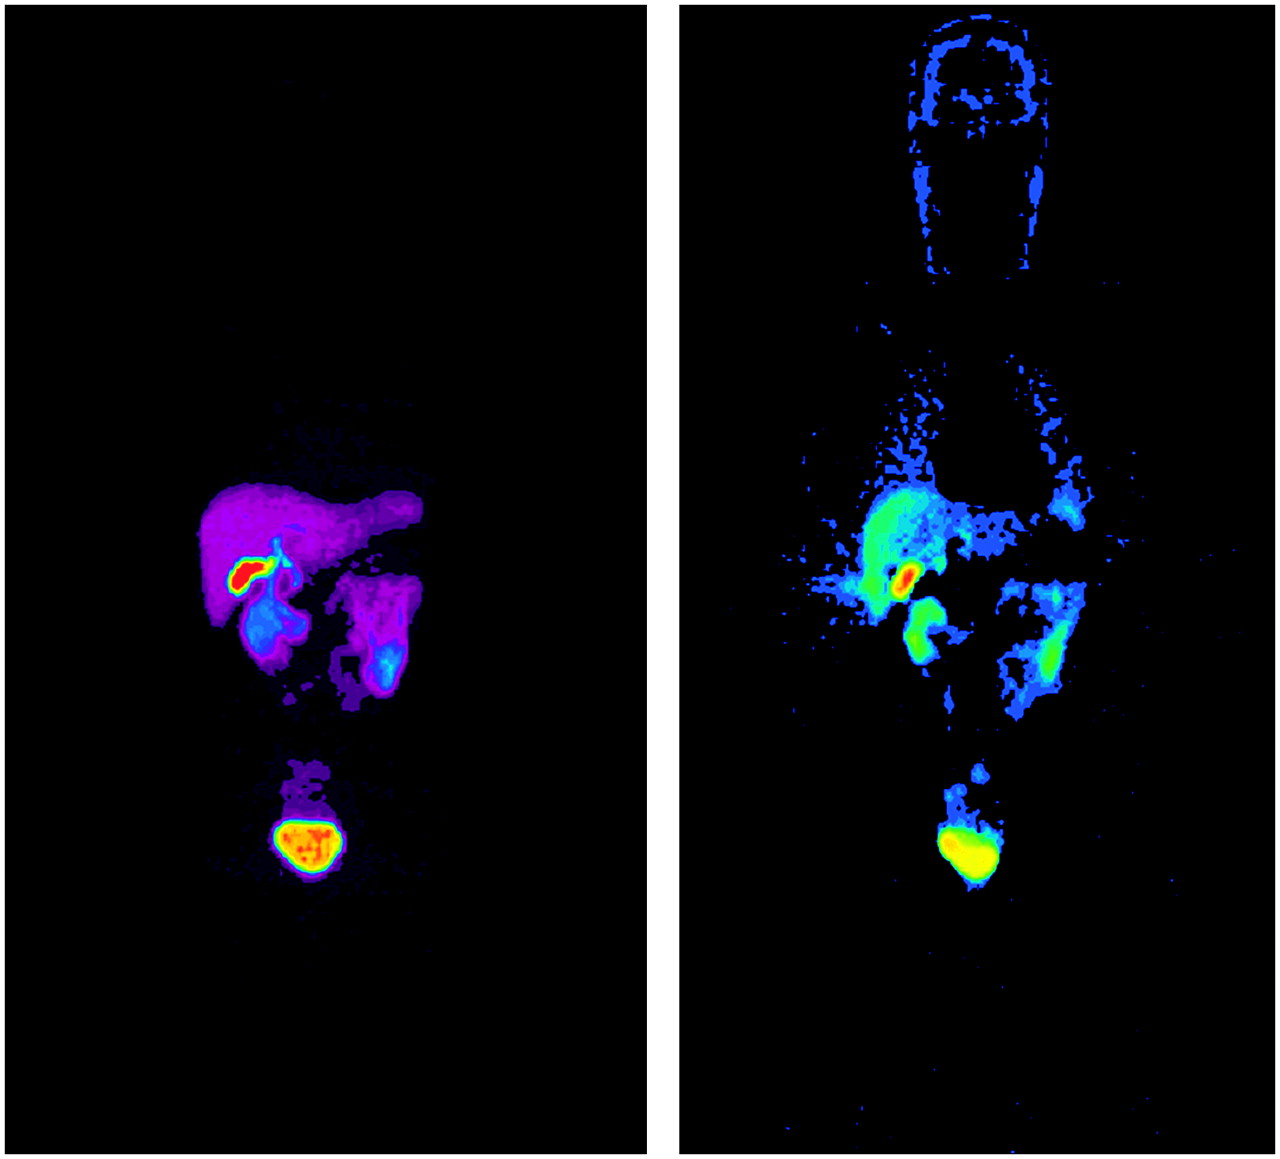
Whole-body images of 2 subjects printed at different brightness levels. Subject on left was scanned from head to feet. Subject on right was scanned in opposite direction to visualize the body before high amounts of 11C-PIB accumulate in urinary bladder. There is no 11C-PIB binding to Aβ deposits in these healthy volunteers as they lack Aβ aggregates. Radioactivity on images is due to biodistribution of tracer in the course of its metabolism and elimination.

Time–activity curves of liver (A), gallbladder (B), upper large intestine (C), and kidneys (D). Dots indicate measured data; line is a 3-exponential fitting to those measurements, except in C, upper large intestine, where the line is average of measurements until 40 min and after that it represents physical decay of 11C.
The urine time–activity values of all subjects are presented as one dataset in Figure 3. When fitting the dataset to the exponential in-growth function, parameter AB received the value 20%. This means the renal system excretes approximately 20% of the injected radioactivity.

Excretion of 11C-PIB into urine expressed as percentage of excreted radioactivity out of the injected dose. Dots are individual measurements, and line is the fitted exponential in-growth formula, which starts at zero.
The 11C-PIB residence times in the source regions are given as hours in Table 1, in line with the requirements of the MIRDOSE3.1 program. The absorbed doses given in Table 2 were calculated for a 70-kg reference adult. The organs with the greatest equivalent doses were the gallbladder wall, liver, urinary bladder wall, kidneys, and upper large intestine wall. The critical organ, which received 0.042 mGy/MBq, was the gallbladder wall. The effective radiation dose in a 70-kg adult man was 4.74 μSv/MBq.
Residence Times in Source Regions and Number of Subjects Contributing to Each Source
Radiation Doses in a 70-kg Reference Man
DISCUSSION
11C-PIB has been validated as an imaging agent to visualize Aβ accumulation in the human brain (6), and it is increasingly used in AD clinical research. The aim of this study was to contribute to the further validation of the clinical use of 11C-PIB by estimating the human radiation exposure involved in 11C-PIB PET scans.
The gallbladder wall was determined to be the critical organ for radiation safety, and this finding supports the prediction from the preclinical baboon study (7). In our study, initial results indicated the gallbladder accumulation curve was still ascending at 40 min after the tracer injection. To estimate the 11C-PIB residence time in the gallbladder more accurately, we scanned 3 additional subjects up to 100 min after the injection. The fit of a 3-exponential curve to the gallbladder measurement points was assumed to be a rough estimate of tracer kinetics because differences in gallbladder physiology between individuals could be anticipated. The tracer clearance through bile excretion may vary greatly, depending on the quality and quantity of postinjection food intake. Although variability is expected in such measures, the provision of additional data was deemed to be sufficient for predicting the decline in gallbladder radioactivity. Furthermore, the residence time of the gallbladder radioactivity was nearly equal in the previous baboon study (7) and in our measurements; 0.018 h and 0.016 h, respectively.
For the upper large intestine, the radioactivity concentration after 40 min was estimated to continue in accordance with the physical decay of 11C. This allowed an estimation of the rate of decline in radioactivity without including the effects of biologic clearance or bile excretion into the small intestine and its transportation into the large intestine. Cinematic rotating maximum intensity projections showed that the intestinal radioactivity did not originate in the small intestine. The residence time in the upper large intestine was estimated as the sum of areas under the average curve before 40 min and under the 11C decay curve after 40 min. It remains unclear, however, why an important fraction of 11C-PIB is cleared through bile excretion. Excluding the 20% excretion into urine, most of the remaining radioactivity can be considered to stay within the body until 11C decays.
Generally, there is a high degree of consistency between our human biodistribution data and the baboon biodistribution data (7), but the high 11C-PIB uptake seen in baboon lungs was absent in humans. Also, the residence time of 11C-PIB in the kidneys of baboons was estimated to be 2.3 times longer than that in our human subjects—that is, 0.027 h versus 0.012 h. The residence time of 11C-PIB in baboon liver was estimated to be 2.7 times shorter than in our measurements—that is, 0.039 h versus 0.107 h. These differences probably reflect differences in physiology between species or possibly the effects of ketamine/isoflurane anesthesia in the baboons (7).
We found the renal system to be an important route of clearance of 11C-PIB from the body, excreting approximately 20% of the injected radioactivity. In baboons, also, urinary excretion was estimated to account for 15% of the injected radioactivity at 80 min after injection. The difference in urinary bladder content residence times in our human data (0.022 h) and the baboon data (7) (0.041 h) may be explained by the different methods of analysis. The absorbed dose in the urinary bladder wall would have been smaller if the subjects had had their bladders full at the time of injection and during the PET. A fraction of the detrimental β+-radiation would be absorbed into a bigger volume of urine and would possibly never reach the bladder wall (16). However, such a radiation protection arrangement might disturb scanning sessions by causing subject discomfort.
The radiation dose results estimated by the MIRDOSE3.1 algorithm are for a reference 70-kg adult man. Our subjects' weights were close to 70 kg (range, 65–96 kg; mean ± SD, 76.4 ± 11.2 kg; median, 73 kg). The organ sizes of our healthy subjects were most likely in accordance with those of the 70-kg Reference Man. Therefore, the observed organ radioactivity concentrations and their relative distribution in the body were appropriately accounted for by this 70-kg model. In spite of the rather limited variance between the model and the study subjects, some variation arises from the modeling of the data, and the results must always be considered as estimates of average radiation exposure.
The effective radiation dose estimate obtained here may be used as a reference when estimating radiation exposure in PET studies with 11C-PIB. An effective radiation dose of 4.74 μSv/MBq is substantially less than the estimated maximum radiation burden caused by 11C tracers, which may be as high as 11.0 μSv/MBq (17), and is somewhat less than the estimate based on a preclinical study with baboons, 6.5 μSv/MBq (7). Thus, the exposure caused by 11C-PIB PET is comparable with the average effective radiation dose in brain receptor PET tracer studies, which is 4.5 μSv/MBq (17).
CONCLUSION
The use of 11C-PIB for amyloid PET results in an effective human radiation dose of 4.74 μSv/MBq, which is within the conventional range of 11C tracer radiation burden. From the viewpoint of radiation safety, our results support the use of 11C-PIB in clinical PET studies. When calculated using the effective dose estimated in this study, a 500-MBq injection of 11C-PIB—for example, would result in a radiation dose of 2.37 mSv. These results may be used as reference when evaluating permissible injected doses and as information for ethical committees to judge the risk–benefit ratio of 11C-PIB PET studies.
Acknowledgments
We thank the medical laboratory technologists and radiographers of Turku PET Centre for skilful assistance and cooperation. The staff at the Turku University radiochemistry laboratory is thanked for the production and delivery of this new tracer. GE/Imanet Ltd. is thanked for supplying the PIB precursor. This study was supported financially by the Academy of Finland (project 205954), the Sigrid Juselius Foundation, and clinical grants (EVO) of Turku University Hospital.
Footnotes
-
COPYRIGHT © 2007 by the Society of Nuclear Medicine, Inc.
References
- Received for publication May 11, 2006.
- Accepted for publication October 19, 2006.


Jump to section
Related Articles
Cited By...
- Phase 1 Evaluation of 11C-CS1P1 to Assess Safety and Dosimetry in Human Participants
- Repurposing bromocriptine for A{beta} metabolism in Alzheimers disease (REBRAnD) study: randomised placebo-controlled double-blind comparative trial and open-label extension trial to investigate the safety and efficacy of bromocriptine in Alzheimers disease with presenilin 1 (PSEN1) mutations
- The Synthesis and Structural Requirements for Measuring Glucocorticoid Receptor Expression In Vivo with ({+/-})-11C-YJH08 PET
- Biodistribution and Radiation Dosimetry of 11C-Nicotine from Whole-Body PET Imaging in Humans
- Human Radiation Dosimetry for the N-Methyl-D-Aspartate Receptor Radioligand 11C-CNS5161
- Radiosynthesis, Photoisomerization, Biodistribution, and Metabolite Analysis of 11C-PBB3 as a Clinically Useful PET Probe for Imaging of Tau Pathology
- Dual-Biomarker Imaging of Regional Cerebral Amyloid Load and Neuronal Activity in Dementia with PET and 11C-Labeled Pittsburgh Compound B
- Whole-Body Biodistribution and Radiation Dosimetry of 18F-GE067: A Radioligand for In Vivo Brain Amyloid Imaging
- Consideration of Optimal Time Window for Pittsburgh Compound B PET Summed Uptake Measurements
- Radiation Dosimetry of {beta}-Amyloid Tracers 11C-PiB and 18F-BAY94-9172
- 1-11C-Methyl-4-Piperidinyl-N-Butyrate Radiation Dosimetry in Humans by Dynamic Organ-Specific Evaluation