


Abstract
Deficits of cholinergic neurotransmission contribute to various neurologic and psychiatric conditions. The neurotransmitter acetylcholine is hydrolyzed in the synaptic clefts by 2 enzymes, acetylcholinesterase (AChE) and butyrylcholinesterase (BuChE). 1-[11C]-Methyl-4-piperidinyl-N-butyrate (11C-MP4B) is a radioligand for the assessment study of BuChE activity in human brain with PET. In the present study the radiation-absorbed doses of the 11C-MP4B were estimated in humans according to the guidelines of the International Commission on Radiological Protection. Two different data acquisition protocols—dynamic organ-specific evaluation (DOSE) and whole-body scanning—were compared. Both methods are widely used for evaluation of radiation burden of 11C-labeled PET tracers. Methods: Fixed-bed PET on the upper neck, thorax, abdomen, or pelvic region was performed on 7 healthy subjects after injection of 707 ± 34 MBq (mean ± SD) of 11C-MP4B. Brain input was derived from our previous studies on 18 healthy control subjects and 10 patients with Alzheimer's disease. Regions of interest were drawn on transverse images of all visible organs. Radiation dose estimates were calculated from organ residence times using the MIRDOSE3 software. Urine samples were collected after imaging to estimate tracer extraction. To compare the estimates for absorbed doses between the whole-body scan approach and the DOSE method, we simulated whole-body data acquisition methods used in 11C dosimetry studies with our fixed-bed data. Results: The organs with the highest radiation-absorbed doses were the liver, urinary bladder, kidneys (renal cortex), upper large intestine, trabecular bone, salivary glands, and heart wall. Up to 60% of the injected dose was excreted via the urinary pathway, and the clearance was relatively rapid, as 30% of the radioactivity was excreted within 60 min after injection. With a 2-h voiding interval the effective dose was 4.2 μSv/MBq. Conclusion: 11C-MP4B causes less radiation burden than previously studied 11C-labeled PET tracers. No intolerably high absorbed doses were observed in critical organs. With 740 MBq of injected radioactivity, the radiation burden is equivalent to 3.11 mSv. This would allow multiple PET examinations per year to be performed on the same subject. The DOSE method and the simulated whole-body imaging approach produced similar results.
Deficits in cholinergic neurotransmission contribute to various neurologic and psychiatric conditions (1). In Alzheimer's disease, especially, the mainstay of pharmacologic therapy is the enhancement of cholinergic neurotransmission (2) by inhibiting acetylcholinesterase (AChE) and butyrylcholinesterase (BuChE), the enzymes hydrolyzing the neurotransmitter acetylcholine in the synaptic clefts. AChE has been considered the main target of anticholinesterase therapies, but increasing evidence suggests that BuChE has an important role in the pathophysiology of Alzheimer's disease (3–8).
PET is used to study the cholinergic system in vivo in human brain. Although PET radioligands assessing cerebral AChE activity are widely used (9–12), 1-11C-methyl-4-piperidinyl-N-butyrate (11C-MP4B) is, to our knowledge, the first radioligand validated for the study of BuChE activity in human brain (13). It is the specific substrate for BuChE and is inert for AChE. The blood–brain barrier is impermeable to the hydrolyzed tracer 11C-MP4B-OH; thus, the tracer accumulates in the tissue in a rate determined by the local BuChE activity (14). Only a fraction of the injected tracer passes the blood–brain barrier, leaving most of the radioactivity in the lower parts of the body.
When assessing the risks of using radiopharmaceuticals against clinical benefits, the biologic risks of the internal radiation exposure are characterized by the effective dose. It is calculated by summing the absorbed doses in organs multiplied by a weighting factor, which accounts for the biologic effectiveness of different types of radiation in different organs. The common procedure for radiation dose calculations in nuclear medicine is the scheme developed by the MIRD Committee of the Society of Nuclear Medicine (15). In this approach, the characteristic distribution of the studied radiopharmaceutical (accumulation to “source organs”), physical characteristics of the radionuclide, and a specified anatomic model (phantom) are used to calculate absorbed doses in 26 organs of the human body (“target organs”) and in the rest of the body (tissues outside the target organs) (16).
We selected the source organs according to our previously published 11C-MP4B human biodistribution study (17) to cover the structures that receive a high radioactivity concentration after injection of the tracer and the structures known to be sensitive to adverse effects of ionizing radiation. The organs selected were brain, upper large intestine, heart content, heart wall, kidneys, liver, lungs, muscle (erector spinae), red bone marrow, cortical bone, trabecular bone, salivary glands (parotid and submandibular), and urinary bladder.
We measured the distribution of the tracer by dynamic, fixed-bed PET of selected body regions (dynamic organ-specific evaluation, DOSE). The other widely used imaging method in radiation dosimetry studies is whole-body PET. We compared the results obtained by these 2 methods by simulating whole-body image acquisition with our fixed-bed data.
No radiation dose estimates have been previously described for 11C-MP4B or the other PET tracers for assessing the cholinergic nervous system in human brain. Evaluating the radiation exposure of this tracer is essential, as it is injected frequently to same subjects in follow-up and intervention studies. Accurately measured distribution and estimated radiation doses of 11C-MP4B can also be used as a reference when evaluating the risk-to-benefit balance of structurally similar PET tracers.
MATERIALS AND METHODS
Subjects
Biodistribution and residence times of 11C-MP4B were measured on 7 healthy young male volunteers from 21- to 24-y-old (mean age ± SD, 23.4 ± 0.8 y). PET was targeted to the abdominal region in 3 subjects to study liver, large intestine, kidneys, and skeletal muscle (erector spinae). Scanning was targeted to the thorax in 2 subjects to study heart, lungs, and liver. One subject was imaged in the pelvic area to study urinary bladder and red bone marrow in iliac cristae, and 1 subject was imaged in the upper neck area to study parotid and submandibular salivary glands. Brain data were obtained from our previous PET scans conducted primarily to evaluate the 11C-MP4B dynamics in dementing disorders. The brain data were pooled from 10 patients with Alzheimer's disease and 18 cognitively healthy subjects. Ten of the subjects were male and 18 were female. The mean age ± SD of the subjects was 67.5 ± 6.6 y (age range, 58–80 y).
The studies were reviewed and approved by the Joint Committee of Ethics of the Turku University and Turku University Hospital and by the National Agency of Medicine. All participants gave their written informed consent before participating in this study. The participants with diagnosed dementing disorders were in an early stage of their disease and, thus, were able to give their informed consent autonomously.
Dynamic PET Studies
PET was performed with an Advance PET scanner (GE Healthcare). The scanner consists of 18 rings of bismuth germinate detectors, yielding 35 transverse slices spaced by 4.25 mm. The imaging field of view (FOV) was 15.2 cm in axial length (18). Before injecting the tracer the radiation attenuation of the imaged area was measured with 2 rotating rod sources containing 68Ge/68Ga. The scanner was operated in 2-dimensional (2D) mode for body imaging and in 3-dimensional (3D) mode for brain imaging. The 2D (high-resolution) mode was chosen to avoid the spillover effect, in which the organs having the high radioactivity concentration erroneously increase the radioactivity value in neighboring lower radioactivity organs. The radioactivity concentrations in abdominal organs are also high enough to challenge the scanner performance if 3D (high sensitivity) mode is used. Brain tissue is relatively homogeneous in tracer distribution and only a fraction of injected radioactivity passes the blood–brain barrier—thus, making the 3D mode an optimal choice for brain scanning.
The radiochemical synthesis and quality control of 11C-MP4B are described elsewhere (17). In short, the tracer was produced by the reaction of 4-butyryl-piperidine, generated in situ from its hydrochloride salt using 1,2,2,6,6-pentamethyl-piperidine, and 11C-methyl-triflate in methanol acetonitrile for 1 min at 60°C. The crude product was purified using high-performance liquid chromatography (HPLC) with a μPorasil column (Waters). After addition of 0.3 mL of sterile propylene glycol/ethanol (7:3 v/v) and 100 μL of 0.1 mol/L HCl, the fraction containing the product was evaporated and redissolved in physiologic phosphate buffer (0.1 mol/L, pH 7.4) and filtered through a 0.2-μm Gelman Acrodisc 4192 sterile filter. Quality control was performed using HPLC with a Waters μBondapak C18 10-μm, 3.9 × 300 mm column (Waters) and a gradient of phosphoric acid (50 mmol/L) and acetonitrile. The radiochemical purity of the tracer was >99%, and the average specific radioactivity ± SD was 60 ± 10 GBq/μmol.
At the start of PET the 9-mL bolus of tracer solution was infused during 80 s into the right anterior cupital vein, according to the standard 11C-MP4B study protocol in our PET center. The average radioactivity ± SD of the injected tracer was 707 ± 34 MBq in the body scans and 703 ± 63 MBq in the brain studies.
The dynamic body scans were fitted to cover the internal organs of the imaging region. The total scanning time of 40 min was divided into time frames of 8 × 15 s, 6 × 30 s, 5 × 180 s, and 4 × 300 s—thus, adding up to 23 frames. In the brain scans the data were acquired for 60 min with time frames of 1 × 30 s, 4 × 15 s, 5 × 30 s, 2 × 60 s, 2 × 120 s, 6 × 300 s, and 2 × 600 s, adding up to 22 frames.
Images were iteratively reconstructed with the ordered-subsets expectation maximization (OSEM) algorithm with 2 iterations and 28 subsets. Scatter correction, attenuation correction, random counts, and dead-time corrections were all incorporated into the reconstruction algorithm.
Measurement of 11C Radioactivity in Blood and Urine Samples
Arterial blood samples were collected from the 28 elderly subjects during the brain PET scan, via a catheter inserted into the radial artery, because arterial blood time–activity data are necessary in the modeling of tracer kinetic in brain tissue. The procedure and measured time–activity curves are described in detail elsewhere (17). No blood samples were collected during the body scans to avoid unnecessary risks and inconvenience for the subjects.
Urine samples were collected after the body imaging scans and from 20 brain study participants. The fraction of injected radioactivity excreted to urine was quantified 14–90 min after the infusion of the 11C-MP4B. Urinary samples of 2.5 mL were measured with a VDC404 dose calibrator (Veenra Instrumenten by Joure).
Residence Times in Source Organs
In our dosimetry procedure the residence times for source organs are determined with a 4-step procedure from the PET scan and the blood data. First, 2 summated images from each dynamic PET scan were calculated, one from the time frames of the first 2 min of the scan to visualize the organs with high blood flow and one from the frames of the last 25 min to detect the retention of the 11C-MP4B. The source organs were defined by marking them manually as regions of interest (ROIs) on the summated images. The drawing was done by a single experienced operator and was reviewed subsequently by other investigators before the analyses. Then the ROIs were copied on the dynamic images, and the radioactivity concentration in the ROIs was plotted against time (time–activity curve).
In the second step, the time–activity curves were normalized to 1-MBq injection (the denominator of the equation below) and to 70 kg, the weight of the Fisher–Snyder phantom (19) used in the MIRD scheme: where C′(t) is the normalized radioactivity concentration (kBq/mL), C(t) is the measured radioactivity concentration in the ROI (kBq/mL), A0 is the injected activity (MBq), W is the weight of the subject (kg), and
  is the weight of the phantom reference (70 kg).
Third, exponential curve fitting was used to determine a time–activity curve from the set of the normalized time–activity curves in each source organ. To choose the most appropriate fitting method, 4 different methods were compared in the liver ROI: 1-exponential, 2-exponential, and 3-exponential functions and an average curve of extrapolated 11C-decay function. After the last time frame, the time–activity curve was assumed to continue in compliance with the fitted function of source organ radioactivity concentration.
Fourth, the cumulated radioactivity concentration for the source organs was determined as the area under the normalized average time–activity curve from 0 to infinity, except for the urinary bladder content from 0 to the voiding time. Total cumulated activity for organs was calculated by multiplying the cumulated activity concentration in the respective ROI by the volume of the organ in the Fisher–Snyder Reference Man.
Radiation Dose Calculations
Accumulated radioactivity in the remainder of the body, ARB, was calculated with the equation: where A0 is the injected dose, AT is the injected dose minus the excreted activity, and Ai is the activity in the measured source organ. The excreted activity was estimated by an empiric formula of exponential in-growth fitted to the postscan urinary samples:
 where AB is the excretion fraction of the injected dose in the urine, b is the rate coefficient for clearance, and t is the time (20). In the fitting procedure, AB was adjusted to different values between 40% and 100% to fit the rate coefficient in the measured data. Cumulated activity of the bladder was determined by removing the physical decay from fitted curves and normalizing the data for 1-MBq injection of tracer activity. The average measured volume of the voided urine, 370 mL, was used as volume of the urinary bladder in calculating total cumulated activity.
In the MIRD scheme, the mean absorbed dose (D) in target organ (rk) of the phantom from injected dose A0 is calculated with the equation: where Āh is the cumulated activity in the source organ h, A0 is the total activity injected into the patient, Δi is the mean energy emitted per nuclear decay for the emission type i, φ(rk ← rj)i is the fraction of energy emitted in the source organ h, which is absorbed in the target organ k, and mk is the mass of the target organ (16).
Residence time τ is the quotient of cumulated activity in the organ and total injected activity; τ = Ā/A0. The quantity Σ [(Δi φ(rk ← rj)i)/mk], which describes the physical characteristics of the radionuclide 11C in the phantom model, was incorporated into a single variable S(rk ← rj). The S values for different radionuclides and phantoms can be obtained from a database (21); thus, the equation above is simplified into:
The residence times of source organs were determined, and absorbed as well as effective doses were calculated with MIRDOSE3 software (Oak Ridge Associated Universities, Oak Ridge, TN) (22), according to the risk weight factors of Publication 60 of the International Commission on Radiation Protection (15).
Comparison of DOSE Method with Simulated Whole-Body Scan Approach
As described earlier, the residence time is the integral of the exponential function fitted to the measured time–activity data. In our DOSE method, the time–activity data are acquired for each source organ throughout the imaging, whereas, in the whole-body scan approach, the source organ is inside the FOV only in a few bed positions. In the whole-body studies, the FOVs, the number of bed positions, as well as the duration of time frames vary considerably (23–33).
We compared the 2 different acquisition procedures for residence time estimation. The simulation is done on the liver time–activity curve, as the liver is a homogeneous and a relatively large organ that is well visualized in the 11C-MP4B PET images. The DOSE method requires at least 6 healthy volunteers or patients—3 for thorax and 3 for abdominal region scans. The whole-body procedure provides fewer experimental observations for each source organ. The number of subjects in published studies has been between 1 and 6. To compare the estimates for absorbed doses between the whole-body scan approach and the DOSE method, we simulate whole-body data acquisition methods used in 11C dosimetry studies (23,26,28) with our fixed-bed data. We estimated the time frames of whole-body scanning in which liver was in the FOV and used only those time points in calculating the residence time.
RESULTS
We used the liver time–activity curve as an example for comparing the different methods in determining residence times. Different fitting methods yielded liver residence times of 0.047, 0.041, 0.040, and 0.044 h with 1-exponential, 2-exponential, and 3-exponential, and the average curve of extrapolated 11C-decay fitting functions, respectively. By visual inspection, the 2-exponential fitting was observed to give the closest match to the data and was used in calculating the residence times for source organs.
In line with the previously published whole-body 11C-MP4B summated image (17) and tissue-specific expression of the BCHE gene (http://t1dbase.org/page/GeneOverview/display/gene_id/590), the organs that were easily visualized in the summated images were liver, urinary bladder, kidneys (renal cortex), upper large intestine, trabecular bone, salivary glands, and heart wall. The time–activity curves for kidneys, liver, muscle tissue, and salivary glands are illustrated in Figure 1.

Normalized time–activity curves in kidneys, liver, muscle tissue, and salivary glands by 2-exponential fitting.
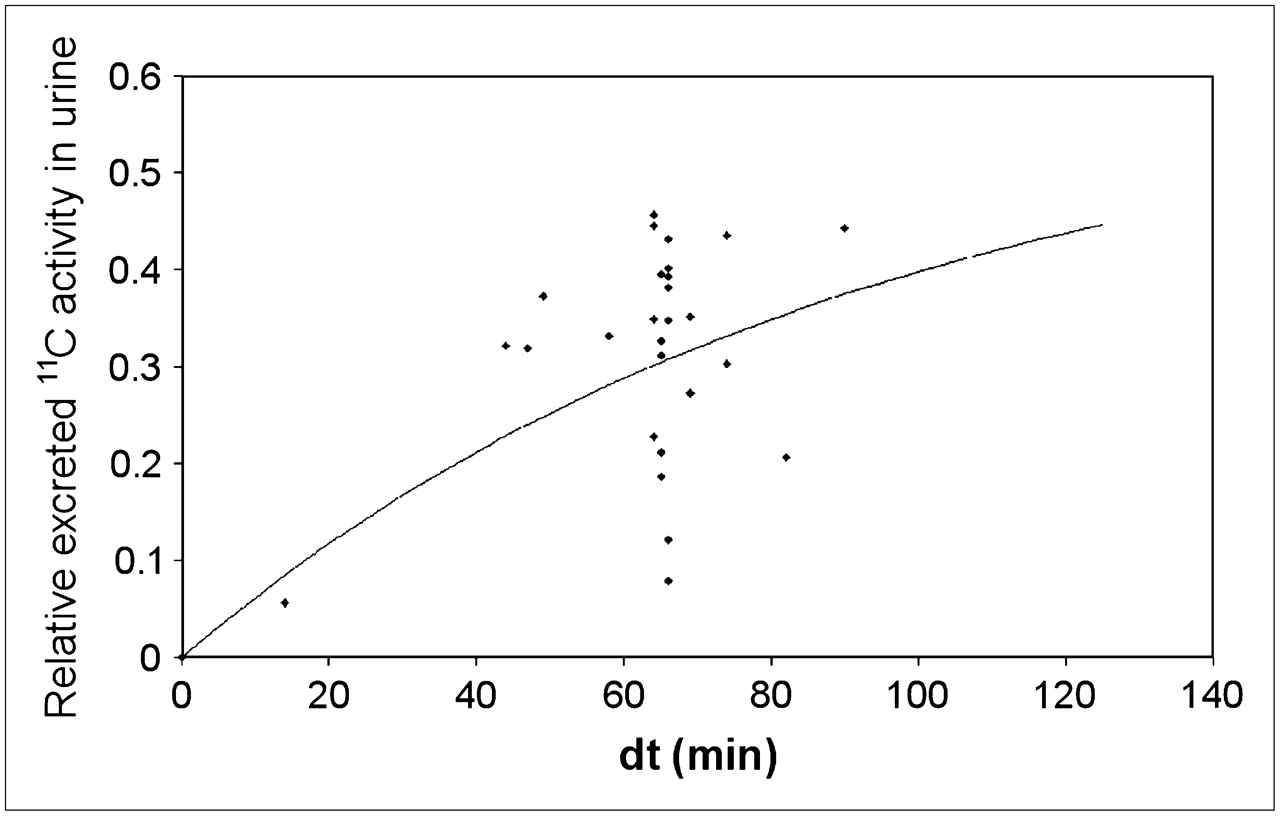
The urinary excretion of 11C-MP4B was 5%–45% within the first 90 min after the injection of the tracer. Figure 2 illustrates the relative excreted 11C activity in the urine—that is, the quotient of the measured activities (n = 27) of the total injected activity. The graph suggests that up to 60% of the injected dose is excreted via the urinary pathway, and this clearance is relatively rapid with 30% of the tracer excreted 60 min after injection—that is, at the end of the regular scan protocol in the brain studies with the tracer.

Empiric formula of exponential in-growth fitted on 11C-MP4B urine samples.
The residence times of the 14 source organs are given in Table 1. The residence times were calculated assuming no postscan urinary bladder voiding. The estimates of absorbed doses in target organs for an adult weighting 70 kg are given in Table 2. The highest absorbed doses were found in the urinary bladder (0.019 mGy/MBq) and the renal cortex (0.014 mGy/MBq). The effective dose was estimated to be 0.0042 μSv/MBq.
Measured Residence Times in Source Organs of 11C-MP4B
Absorbed Doses of 11C-MP4B to Target Organs in 70-kg Reference Man
Calculating the residence times with 1- or 2-h voiding time—that is, assuming that the urinary bladder is voided 60 or 120 min after the injection—yielded similar estimates for absorbed doses in target organs than those with no voiding assumed, except for urinary bladder wall and uterus. For urinary bladder wall, a 1-h voiding time yielded an absorbed dose of 0.013 mGy/MBq and a 2-h voiding time yielded 0.019 mGy/MBq. For uterus, the absorbed doses were 0.0033 mGy/MBq with a 1-h voiding time and 0.0035 mGy/MBq with a 2-h voiding time. With a 1-h voiding time, the effective dose was estimated to be 0.0041 μSv/MBq and with a 2-h voiding time it was estimated to be 0.0042 μSv/MBq—that is, similar to the effective dose estimated assuming no postscan voiding.
In comparing the DOSE method with the simulated whole-body scanning approach, the DOSE method yielded a liver residence time of 0.0411 h using the 2-exponential fitting. We estimated that in the procedure used by Cropley et al. (23) and Lu et al. (26) liver was in the FOV in the third and fourth bed positions in each of 14 frames. By using corresponding time points from our data, the liver residence time would have been 0.0444 h. Simulating the procedure of Parsey et al. (28) similarly (third and fourth bed positions, 5 frames) would yield a liver residence time of 0.0426 h.
DISCUSSION
Because of the rapid clearance of 11C-MP4B and the short half-life of 11C, the different postscan urinary bladder voiding protocols gave similar estimates of absorbed doses, except in organs in a small pelvis. Assuming no postscan voiding gave the most conservative estimate of the effective dose, and, thus, the assumption was used in calculating the absorbed doses.
When assessing the safety of a tracer, it is compared with the theoretic maximum effective dose calculated from the generic biokinetic model, described in Addendum 5 to ICRP Publication 53 (34), which for the 11C-tracers is 11.0 μSv/MBq. The 11C-labeled tracers in clinical use have relatively low effective doses, varying between 4.2 and 7.0 μSv/MBq, except for 11C-WAY100635, which causes an overall radiation exposure of 14.1 μSv/MBq (23–33,35). In comparison with other 11C-tracers (Table 3), the effective dose for 11C-MP4B is one of the lowest and is well below the dose estimated by the generic model.
Effective Doses of 11C-Labeled PET Tracers in Humans
With the 740-MBq standard dose in our 11C-MP4B studies, the radiation burden is equivalent to 3.11 mSv, or 3.5 brain CT scans (effective dose for adult brain CT scan is approximately 0.9 mSv (36)). With 500 MBq of injected radioactivity, the 11C-MP4B PET results in an effective dose of 2.10 mSv (equivalent to 2.3 brain CT scans), 11C-raclopride results in an effective dose of 3.3 mSv (3.6 brain CT scans), and, as an extreme example, 11C-WAY100635 results in an effective dose of 7.05 mSv (7.8 brain CT scans). Therefore, it is important to estimate the radiation burden of each tracer separately instead of using the generic effective dose of the radionuclide. To our knowledge, no dosimetry studies on radioligands structurally similar to 11C-MP4B have been published.
For an accurate estimation of the effective dose for 11C-MP4B, special attention was given to a reliable selection and outlining of the source organs. Red marrow was selected as a source organ, even though the marrow in the iliac cristae was not a hot area in the summated images, as the tissue is sensitive to the adverse effects of radiation. Salivary glands were selected as source organs because they have been observed to accumulate the tracer (17). The myocardial ROIs were drawn on the outer parts of the heart to avoid spillover from the blood and the red bone marrow ROIs on the internal parts of the pelvic cristae to avoid spillover from the cortical bone. The brain ROI is a sum of ROIs outlined in the cerebral cortex, striatum, cerebellum, and brain stem, the areas where the highest enzyme activities in the central nervous system have been observed (13). Because of the rapid excretion of the tracer via kidneys, renal pelvis and the ureters were also visible in the summated images. Using the urinary bladder content as a source organ also covers the radiation exposure for these structures.
The highest activity concentrations were measured in the urinary bladder, kidneys, large intestine, and liver. In line with this, the highest absorbed doses were measured in the urinary bladder wall, large intestine wall, kidneys, and liver. Yet, the main sources of radiation were—due to their large volume—the body outside specified regions (remainder of the body), muscle tissue, and cortical bone. The exposure from the cortical bone might also be partially due to the fact that the ROIs for the tissue were outlined in the vertebral bodies, in which the activity was higher than that observed elsewhere in the skeleton.
Cholinergic nerves are known to be abundant outside the central nervous system—for example, in cardiac neurons (37,38) and in urinary and gastrointestinal tracts. The clinical side effects of the cholinesterase inhibitors have been suggested to be primarily due to the BuChE activity outside the brain. Nevertheless, the distribution of the enzyme in the human body has not, to our knowledge, been characterized. Although the clinical radiation safety of the tracer is the main outcome of this study, the results also approximate the whole-body BuChE activity, along with the biodistribution study published earlier (17). Nevertheless, the exact enzyme activity cannot be determined from these results, as the residence times are affected also by blood flow, tracer uptake, and excretion.
When comparing the DOSE method with the simulated whole-body imaging approach, the methods gave roughly similar residence times for liver. As the whole-body studies require fewer PET scans, this method might be most appropriate for 11C-radioligands with rapid clearance, especially if short time frames (approximately 15 s per bed position) are chosen. Otherwise, the whole-body images might not give a sufficient number of data points for validly fitting the decay function on the observed data. In addition, in the DOSE method, the ROIs drawn on the summated images are valid over all time frames.
The ROIs cover a representative range of source organs, and the total absorbed dose is estimated by multiplying the ROI concentration with the organ volume. This gives more conservative estimates of the absorbed doses than measuring the whole-organ radioactivity in the whole-body imaging approach. With precise subject positioning, the same source organs are covered in the DOSE method as are measured in whole-body procedures, especially if additional brain studies are available and urine measurements are recorded.
CONCLUSION
11C-MP4B causes less radiation burden than other studied 11C-labeled PET tracers. No intolerably high absorbed doses were observed in critical organs. With 740 MBq of injected radioactivity, the radiation burden is equivalent to 3.11 mSv. This would allow multiple PET examinations to be performed on the same subject per year. When comparing the DOSE method with the simulated whole-body imaging approach, the methods gave roughly similar results.
Acknowledgments
We thank the medical laboratory technologists and radiographers of Turku PET Centre for skillful assistance and cooperation. We also thank the staff of the Turku University radiochemistry laboratory for the production and delivery of the tracer. This study was financially supported by clinical grants of Turku University Hospital.
Footnotes
-
COPYRIGHT © 2008 by the Society of Nuclear Medicine, Inc.
References
- Received for publication September 11, 2007.
- Accepted for publication November 26, 2007.


