


Abstract
Accurate, early differentiation of dementias will become increasingly important as new therapies are introduced. Differential diagnosis by standard clinical criteria has limited accuracy. PET offers the potential to increase diagnostic accuracy. 18F-FDG studies detect metabolic abnormalities in demented patients, but with limited specificity. PET also offers the ability to quantify other biochemical markers that can yield additional useful diagnostic information. We demonstrate that (+)-11C-dihydrotetrabenazine (11C-DTBZ) studies, which provide an index of nigrostriatal terminal density (distribution volume; DV), also provide a measure of transport (K1) that produces information comparable to the metabolic measure of 18F-FDG. Methods: Fifty-two patients and 19 control subjects underwent both 11C-DTBZ and 18F-FDG PET scans. Seven had the clinical diagnosis of frontotemporal dementia (FTD), 25 had Alzheimer’s disease (AD), and 20 had dementia with Lewy bodies (DLB). DTBZ scans provided maps of K1 and DV, whereas 18F-FDG scans provided maps of glucose metabolism. Correlation analyses were performed between the different PET measures both within and across subjects. Discriminant analysis using logistic regression compared the performance of 11C-DTBZ K1 and 18F-FDG in differentiating subject groups. Three experienced PET researchers participated in an interrater reliability study using both 11C-DTBZ K1 and 18F-FDG images. Results: Within-subject correspondence between 11C-DTBZ K1 and 18F-FDG measures was high, with correlations averaging 0.92. Correlations between the 11C-DTBZ DV and either K1 or 18F-FDG were far lower, averaging 0.37 and 0.31, respectively, indicating the much higher degree of similarity in information provided by K1 and 18F-FDG compared with the very different information provided by 11C-DTBZ DV. Discriminant analysis demonstrated that 11C-DTBZ K1 and 18F-FDG yielded similar levels of sensitivity and specificity for differentiating the subjects in this study. Including 11C-DTBZ DV in addition to either K1 or 18F-FDG improved discrimination between groups. The raters classified PET scans nearly equivalently using K1 and 18F-FDG. Conclusion: Multiple PET measures, whether 2 parameters from a single PET study such as 11C-DTBZ K1 and DV, or 2 parameters from different studies such as 18F-FDG and 11C-DTBZ DV, offer complementary information useful for diagnosing dementias. K1 and DV images generated from a single 11C-DTBZ scan provide as much diagnostic information as 2-scan studies using both 11C-DTBZ and 18F-FDG.
Dementia is a highly prevalent problem causing considerable disability and mortality and exacting great costs to individuals, their families, and society as a whole (1–3). The 4 most common forms of dementia are vascular dementia and 3 degenerative dementias: Alzheimer’s disease (AD), dementia with Lewy bodies (DLB), and frontotemporal dementia (FTD). AD is the most common form of dementia. Autopsy series suggest that DLB may be the second most common form of dementia though some epidemiologic studies suggest that DLB and vascular dementia have approximately the same prevalence (4–8). FTD accounts for a small but significant fraction of the dementias (9,10). Convergent clinical, pathologic, and genetic evidence indicates that the 3 degenerative dementias have different underlying etiologies and pathogenetic mechanisms. Treatment approaches probably will be different for each major form of degenerative dementia. Precise differentiation of dementias is possible presently only with postmortem brain examinations. When specific treatments become available, accurate diagnosis will be crucial to avoid ineffective or inappropriate treatments. Even now, accurate diagnoses have clinical utility; precise diagnosis is important for counseling patients and families about prognosis, cholinesterase inhibitor therapy may not be effective for FTD, and DLB patients are dangerously susceptible to neuroleptic agents.
Clinical criteria exist for premortem diagnosis; however, these are imprecise guides for differentiating degenerative dementias (11–14). Studies comparing clinical criteria for degenerative dementias against the gold standard of pathologic evaluation reveal varying degrees of sensitivity and specificity (11,14). Studies evaluating the capacity of clinical criteria to differentiate degenerative dementias reveal the relatively imprecise nature of these criteria (15–18). Furthermore, many of these studies involve patients with moderate and even advanced disease. Precise differentiation in early, mild dementia is even more challenging (19–22).
PET offers a potentially powerful tool for differentiating the degenerative dementias. 18F-FDG, the most commonly used PET radiotracer, provides measures of regional brain glucose metabolism. 18F-FDG scans reveal regional patterns of hypometabolism that distinguish demented from normal individuals and may differentiate some degenerative dementias (23–29). In AD, there is a well-characterized pattern of temporoparietal, posterior cingulate, and, often, lateral frontal hypometabolism (23,26,28,29). In FTD, hypometabolism in the frontal and temporal cortices is characteristic (24–26). Differentiation of DLB from AD is more difficult; DLB has a pattern of cerebral metabolic deficits similar to that of AD, though often with additional hypometabolism in the occipital cortex (27–29). Discrimination of AD from DLB on the basis of occipital hypometabolism is only moderately effective (27–29).
PET tracers designed to target specific brain neurochemical processes offer many new possibilities for improving differentiation of dementias. PET and SPECT studies with ligands that bind to nigrostriatal terminals show good differentiation of clinically ascertained DLB from AD (30,31). Such methods, however, may be less helpful in identifying FTD. Many FTD subjects develop parkinsonism, suggesting nigrostriatal injury, and loss of nigrostriatal terminals has been shown in one PET study of FTD (32).
PET studies assessing both regional brain metabolism and nigrostriatal terminal integrity could prove more accurate than other methods in the early diagnosis of dementia. Performing 2 PET procedures, however, requires several hours, which is both taxing for patients and expensive. A single PET study that provided information about both regional brain metabolism and nigrostriatal terminal density would eliminate these drawbacks.
We have assessed previously nigrostriatal terminal density in AD and DLB subjects using the PET tracer (+)-11C-dihydrotetrabenazine (11C-DTBZ), demonstrating good discrimination of clinically diagnosed DLB and AD (31). DTBZ PET studies can yield 2 relevant parameters: a measure of ligand binding to the vesicular monoamine transporter type 2 (VMAT2) sites, distribution volume (DV); and a measure of the rate of ligand influx into the brain, K1 (33). 11C-DTBZ has a relatively high single-pass capillary extraction fraction of ∼60% (33). Consequently, regional K1 is highly correlated with regional cerebral blood flow. As blood flow is coupled tightly to metabolism, 11C-DTBZ K1 measurements may yield nominally the same diagnostic information as 18F-FDG metabolic measurements. Our primary goal in this study was to determine the extent to which 11C-DTBZ K1 provides information equivalent to 18F-FDG in the setting of degenerative dementia, with a secondary goal of showing the promise of 11C-DTBZ, which provides 2 important biologic measures in a single PET study. We assessed the concordance between 18F-FDG measurements of regional cortical metabolism and 11C-DTBZ K1 measurements of regional cortical blood perfusion in a population of healthy control subjects and subjects with AD, DLB, and FTD. We performed discriminant analysis to investigate the capacity of each PET measure to differentiate the forms of dementia. In addition, we assessed interrater reliability of visual interpretation of 11C-DTBZ K1 or 18F-FDG with 11C-DTBZ DV images.
MATERIALS AND METHODS
Subject Selection
The Institutional Review Board of the University of Michigan Medical School approved the study, and informed consent was obtained from all participants or their caregivers. Seventy-one subjects were studied: 25 with AD (age, 69 ± 9 y [mean ± SD]; range, 52–85 y; 7 men, 18 women), 20 with DLB (age, 73 ± 7 y; range, 54–81 y; 15 men, 5 women), 7 with FTD (age, 68 ± 8 y; range, 54–78 y; 4 men, 3 women), and 19 healthy elderly control subjects (age, 69 ± 8 y; range, 55–86 y; 10 men, 9 women). These patients were recruited from the Cognitive Disorders and Movement Disorders Clinics of the Department of Neurology, University of Michigan. National Institute of Neurological and Communicative Disorders and Stroke–Alzheimer’s Disease and Related Disorders Association criteria were used for the diagnosis of AD (13), consensus criteria for the diagnosis of probable DLB (15), and work group criteria for the diagnosis of FTD (34). Diagnoses were established by the clinicians caring for the patients and verified by the investigators before study. No diagnoses were altered during the course of the study, and no patients who met criteria and volunteered for study were eliminated. AD and DLB subjects have been described in prior studies (29,31). AD and DLB subjects were matched well for dementia severity with similar Mini-Mental State Examination (MMSE) scores and symptom duration. FTD subjects, on average, had less advanced disease. MMSE scores averaged (mean ± SD) 15 ± 7 (range, 2–27) for AD, 17 ± 6 (range, 8–29) for DLB, and 23 ± 5 (range, 15–29) for FTD. Disease durations averaged (mean ± SD) 5 ± 3 y (range, 1–13) for AD, 5 ± 3 y (range, 2–13) for DLB, and 4 ± 2 y (range, 2–8) for FTD.
PET
All subjects underwent 11C-DTBZ and 18F-FDG PET either in the same imaging session or on consecutive days if they were not able to tolerate the 4-h procedure. Subjects were positioned supine and awake in a quiet dimly lit room with eyes open. For 11C-DTBZ, 666 ± 66 MBq (18 ± 1.8 mCi) of 11C-DTBZ were administered intravenously. An equilibrium protocol was used, infusing 55% of the dose over 30 s, followed by continuous infusion of the remaining 45% over 60 min (33). 18F-FDG studies were performed as a single 20-min scan acquired 30 min after intravenous injection of 296 ± 29 MBq (8.0 ± 0.8 mCi) of 18F-FDG.
All scans were performed in 3-dimensional (3D) mode. Measured attenuation correction was performed using a 6- to 8-min 2-dimensional (2D) transmission scan followed by segmentation and reprojection. Scatter correction was performed on all scans. After Fourier rebinning of the 3D projection sinograms into 2D datasets, images were reconstructed with smoothing parameters that provided in-plane and axial resolution of 8.5- to 9.0-mm full width at half maximum. During the course of this project, we replaced our PET scanner. The first 25 subjects were scanned with a Siemens/CTI ECAT Exact-47 scanner (10 DLB, 9 AD, 6 normal controls [NCs]) and the final 46 subjects were scanned with a Siemens/CTI ECAT Exact HR+ scanner (10 DLB, 16 AD, 7 FTD, and 13 NCs). Greater smoothing was applied during reconstruction of HR+ scans due to their higher intrinsic resolution, resulting in images of the same spatial resolution. Statistical checks revealed that scanner effects were negligible and had no substantive impact on any results or conclusions.
Image Processing and Data Analysis
The single 20-min 18F-FDG image acquired starting 30-min after injection provided an index of glucose metabolism. For the 11C-DTBZ scan, the average of the first 4 min of uptake provided our index of ligand transport, K1. An equilibrium estimate of DV with occipital cortex as the reference region (35) was selected as the index of VMAT2 binding-site density. PET images for all 3 measures for each subject were reoriented to a common coordinate system based on the stereotactic atlas of Talairach and Tournoux (36). After reorientation, all images underwent linear scaling and nonlinear warping (37). A single transformation based on the individual’s summed 18F-FDG and K1 images was calculated for each subject and then applied to all 3 image sets.
All transaxial levels of the atlas have been digitized, and a set of standardized volumes of interest (VOIs) defined on the atlas images. VOIs include both cortical Brodmann areas (BA) and subcortical regions. A subset of 22 cortical VOIs was selected and applied automatically to all images (18F-FDG, 11C-DTBZ K1, and 11C-DTBZ DV) for each subject. Data were averaged over the corresponding areas of each hemisphere. This set of regions consisted of cortical areas hypothesized to provide the best differentiation between groups. We expected frontal regions, particularly medial, to be affected more in FTD (23) than AD or DLB and posterior parietal/posterior cingulate regions to be more affected in AD and DLB than FTD (27). We expected the occipital region to be more affected in DLB than AD or FTD and the region that best differentiates DLB from AD (27,28). Motor and premotor regions (BA4 and BA6) were included as cortical regions likely to be affected least in these dementias. 18F-FDG and 11C-DTBZ K1 data were normalized to the mean VOI value obtained from the cerebellar vermis. The vermis was selected as the normalizing factor because it is a structure known to be minimally involved in these disorders, enhancing the ability to detect regional cortical deficits by removal of the more variable global factor in these measures.
Discriminant Analysis
Logistic regression was used to determine linear combinations of the regional 18F-FDG and 11C-DTBZ variables that best differentiated control subjects and patient groups. For ease of interpretation, 3 binary comparisons were assessed: NC versus all dementias (FTD/AD/DLB), FTD versus AD/DLB, and AD versus DLB. For each binary comparison, forward stepwise variable selection was used to determine the regional PET measure(s) that best differentiated the 2 groups. Regional PET measures were transformed to a logarithmic scale. Attention was paid to the degree to which similar regions entered the analysis, whether the coefficients in the logistic regression were similar, and whether the power to discriminate was similar for 18F-FDG and K1.
Interrater Reliability Study
A subset of the 46 subjects scanned on the ECAT HR+ was selected randomly for rating. The test set comprised 11C-DTBZ scans from 6 FTD, 8 AD, 8 DLB, and 5 NC subjects. For each subject, a composite of transaxial K1 and DV images at 10 brain levels was created. A second composite was created for each subject by replacing the K1 images with the corresponding 18F-FDG slices. Three authors, including one nuclear medicine physician with full neurology residency training and 2 neurologists, both experienced PET researchers, first viewed all K1+DV image sets in randomized order (the same for each rater). The raters were told that the order was random and that all subjects had a clinical diagnosis of FTD, AD, DLB, or NC but were not told the number of subjects in each group. The primary criteria for classifying patients as FTD was the presence of primary K1 or 18F-FDG deficits in frontal or temporal cortex, with frontal deficits being greater than posterior deficits. Classifying patients as either AD or DLB was based on the presence of primary K1 or 18F-FDG deficits in the posterior cingulate, superior parietal, and inferior tempoparietal cortex, sometimes with frontal deficits, but with relative sparing of the sensorimotor cortex. The criterion for separating AD from DLB was the presence of 11C-DTBZ DV deficits in the striatum of DLB patients. Each rater was asked to choose the single best diagnosis for each subject based on visual inspection of the images. Six weeks later, the raters again were assigned diagnoses based on review of 18F-FDG+DV image sets in a different randomized order so they would be unlikely to recall their scoring in the first session.
RESULTS
11C-DTBZ K1–18F-FDG Correlations
A high degree of similarity existed between K1 and 18F-FDG images in patients from all dementia groups and NC subjects (Fig. 1). Regional cortical deficits seen in one measure were seen distinctly in the other measure, consistent with the known coupling between flow and metabolism in both normal and diseased brains. We quantified the degree of similarity through several measures, including the magnitudes of cortical deficits in patient scans relative to NC subjects for K1 and 18F-FDG (Fig. 2); correlations between the 2 measures across both subjects and regions (Fig. 3; Tables 1 and 2); and the capacity of each PET measure to discriminate between groups (Table 3).

11C-DTBZ K1 and 18F-FDG images at 3 brain levels for one representative subject from each group. All images are normalized to cerebellar vermis.
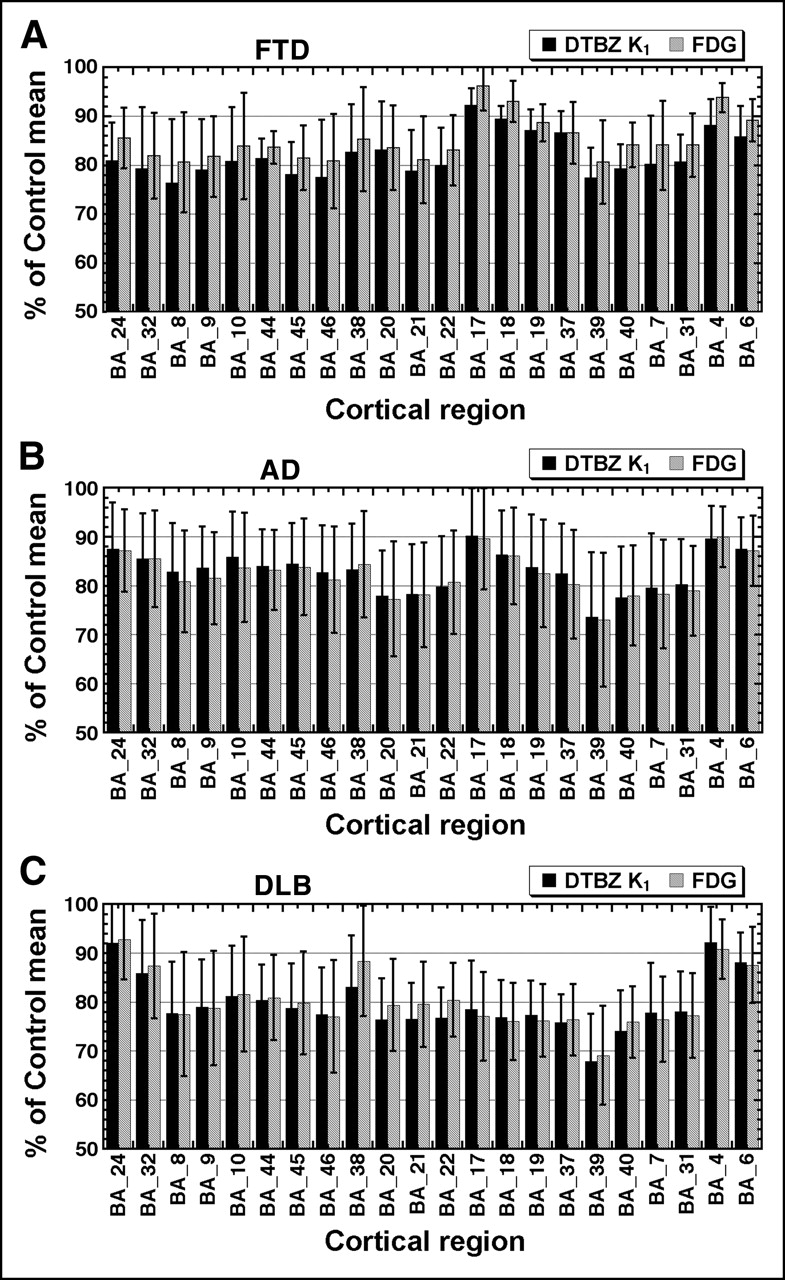
Group average deficits of 11C-DTBZ K1 (solid bars) and 18F-FDG (hatched bars) relative to NC for 22 cortical regions. Shown are mean and SD for FTD (A; n = 7), AD (B; n = 25), and DLB (C; n = 20) expressed as a percentage of NC (n = 19) mean. All values are normalized to cerebellar vermis.
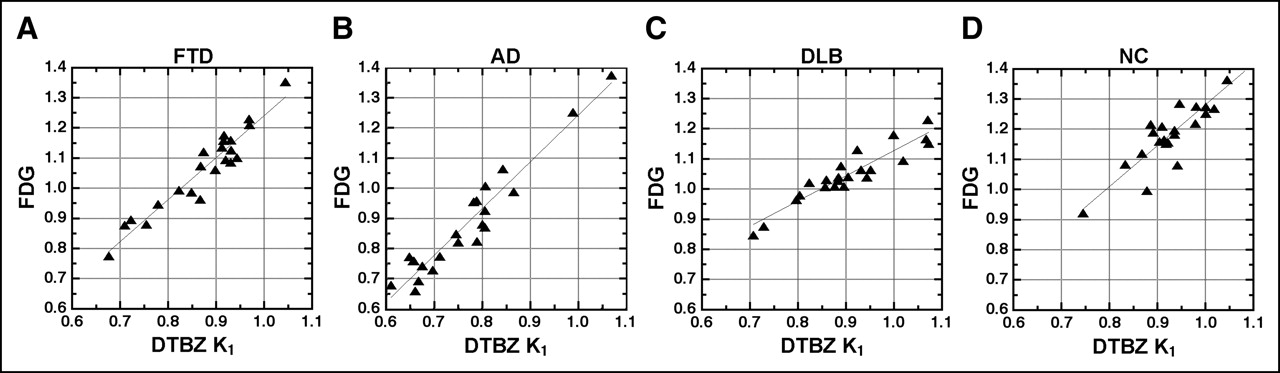
Correlations between 18F-FDG and 11C-DTBZ K1 across 22 cortical regions for selected individuals from each diagnostic group. Both 18F-FDG and K1 values are normalized to cerebellar vermis. The subject selected from each group was the individual having a correlation coefficient closest to the group average (Table 1, column 2). Correlation coefficients are 0.953, 0.945, 0.919, and 0.887 for the selected FTD (A), AD (B), DLB (C), and NC (D) subjects, respectively.
Within-Subject Correlations Across 22 Cortical Regions
Between-Subject Correlations Across 22 Cortical Regions
Classification by Logistic Regression
Figure 2 depicts the magnitudes of regional cortical deficits for each dementia group relative to NCs. Cortical areas are grouped by general brain region and, from left to right, are anterior cingulate and medial frontal (BA24, BA32, BA8, BA9, and BA10); lateral frontal (BA44, BA45, and BA46); temporal (BA38, BA20, BA21, and BA22); occipital (BA17, BA18, and BA19); posterior parietal and posterior cingulate (BA37, BA39, BA40, BA7, and BA31); and motor and premotor cortex (BA4 and BA6). The regional patterns of ligand transport (K1) and glucose metabolism deficits are parallel in all 3 groups, with the least-affected regions decreased from normal on average by 5%–10% and the most- affected regions decreased by ∼30%. Deficit patterns in AD and DLB appear similar, with a notable exception of the occipital regions, where deficits in both PET measures are more pronounced in DLB. Deficit patterns in FTD and AD appear more similar than expected for both K1 and 18F-FDG. Though AD subjects do show relatively larger posterior than anterior deficits, both K1 and 18F-FDG measures revealed deficits of roughly equal magnitude in these regions in FTD, rather than the expected larger deficits in frontal cortex. Whereas some FTD subjects showed the expected FTD pattern (Fig. 1, upper left), several had images more typical of AD (Fig. 4, left). These findings suggest that some subjects with a clinical diagnosis of FTD in the current relatively early stage of the disease may prove to have AD on further clinical evaluation over time and, ultimately, by postmortem examination.

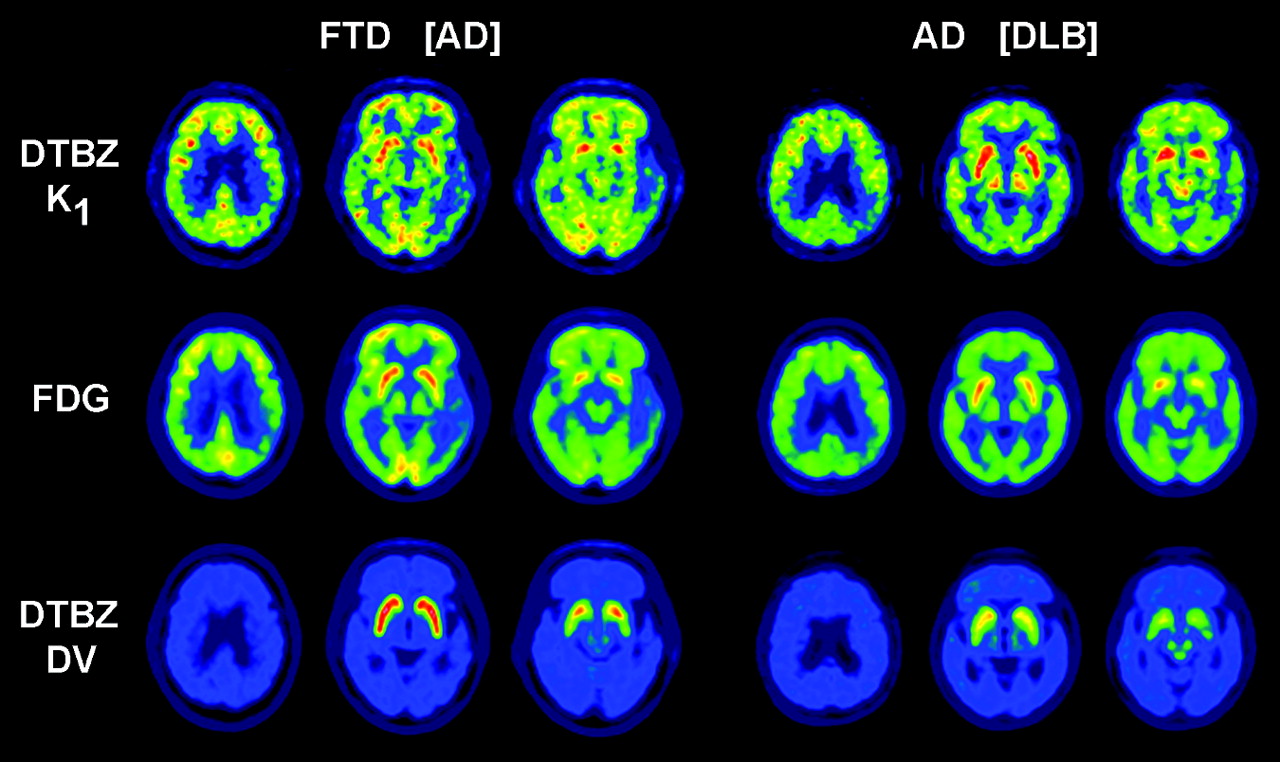
Discrepancies between clinical and PET diagnoses. Shown are 11C-DTBZ K1, 18F-FDG, and 11C-DTBZ DV images at 3 brain levels for 2 subjects whose clinical diagnosis at time of PET was different than classifications by both logistic regression and all physician ratings. Clinical diagnosis at time of scan is given first, followed by PET classification in brackets.
Within-subject correlations between 18F-FDG and 11C-DTBZ K1 measures across cortical regions were very high (Table 1), averaging 0.924 ± 0.043, with individuals’ r values ranging from 0.808 to 0.992. Figure 3 depicts this relationship in representative FTD, AD, DLB, and NC subjects. Displayed are data from the individuals whose correlation coefficients were closest to their group mean. Correlations in NC subjects tended to be slightly lower than in dementia subjects due to the lower dynamic range of values.
Though the within-subject 18F-FDG–K1 correlations averaged above 0.9, we addressed next the question of whether this correlation was specific to this parameter pair, reflecting a close functional relationship between K1 and 18F-FDG, or whether the correlation was more reflective of other factors such as anatomy. The within-subject correlations between the other estimated 11C-DTBZ parameter, DV, and either 18F-FDG or K1, averaged <0.4 (Table 1). The much lower within-subject correlations with DV demonstrate that the high correspondence between 18F-FDG and 11C-DTBZ K1 is not due primarily to the matched anatomic features.
Additional correlations were calculated between each PET measure (18F-FDG, 11C-DTBZ K1, 11C-DTBZ DV) from one individual with each PET measure from all other individuals (Table 2). The mean value of the correlation coefficient for 18F-FDG and 11C-DTBZ K1 between subjects averaged 0.58 ± 0.22. Between-subject correlations were lower than within-subject correlations due to both anatomic differences and functional differences (flow/metabolism pattern) across individuals. Between-subject correlations were far more variable, ranging from correlations nearly as high as those observed within-subject (for subjects with similar anatomy and function) to correlations near zero (for subjects with very different anatomy or function). There was no significant difference in between-subjects correlation strength for same-parameter correlations versus between-parameter correlations, as the 18F-FDG–K1 correlations averaged nearly as high (0.58) as the 18F-FDG–18F-FDG and K1–K1 correlations (0.61 and 0.59, respectively). This indicates that differences attributable to pattern mismatches in 18F-FDG versus K1 are almost inconsequential relative to differences attributable to anatomic and functional variability between individuals. Results from correlations with 11C-DTBZ DV were noticeably different (Table 2, bottom). 11C-DTBZ DV values were more uniform across the cortex than were 18F-FDG or 11C-DTBZ K1 values and, thus, same-parameter correlations were lower for DV (0.29) due to the more limited dynamic range of values than 18F-FDG (0.61) or K1 (0.59). When the comparisons included DV as one measure, there was a significant drop in correlation strength when moving from same-parameter to between-parameter correlations, as correlations involving cortical 11C-DTBZ DV values and either 18F-FDG or 11C-DTBZ K1 averaged nearly zero. This illustrates that it is not a general property of PET measures to be highly coupled, further suggesting that the high degree of correspondence between 18F-FDG and DTBZ K1 indicates that these measures provide nearly the same biologic information.
Logistic Regression Analysis for Subject Classification
Results from the logistic regression analysis are presented in Table 3. Three distinct 2-group classification tests were performed: (a) normal versus all dementias (FTD/AD/DLB); (b) FTD versus AD/DLB; and (c) AD versus DLB. Logistic regression models were fitted with the binary classification as outcome and predictor variables consisting of (i) regional 11C-DTBZ K1 measures alone, (ii) regional 18F-FDG measures alone, (iii) regional 11C-DTBZ K1 measures in conjunction with the 11C-DTBZ DV putamen measure, and (iv) regional 18F-FDG measures in conjunction with DV in the putamen. In each of measures i–iv, forward selection was used to choose the best 1 or 2 regions that differentiated the groups. Additional variables did not yield significant additional predictive power. In support of our hypothesis that DTBZ K1 and 18F-FDG yield nearly identical information, forward selection picked the same regions as best discriminators (Table 3): BA40 for NC versus FTD/AD/DLB; BA24 and BA31 for FTD versus AD/DLB; and BA17 and BA24 for AD versus DLB. Furthermore, the coefficients of the log(PET) measures were similar whether 11C-DTBZ K1 or 18F-FDG was used to discriminate. This resulted in similar odds ratios and P values for the regressions when using either measure alone or in conjunction with DV (Table 3).
When differentiating dementia from control, or FTD from AD/DLB, sensitivity and specificity using either 11C-DTBZ K1 or 18F-FDG alone were similar to classification using 11C-DTBZ DV and either K1 or 18F-FDG. However, when differentiating AD from DLB, which have similar K1 or 18F-FDG patterns but markedly different VMAT2 binding levels, not only did sensitivity and specificity improve significantly but also the certainty of classification increased dramatically.
Interrater Reliability
Interrater agreement on the diagnostic classification of subjects based on visual interpretation of PET images was high for image sets containing either 11C-DTBZ K1 or 18F-FDG. When viewing 11C-DTBZ K1 and DV images, all 3 raters agreed on 23 of 27 cases yielding a mean unweighted Cohen’s κ of 0.85 for the between-rater comparisons. In 5 cases, all 3 raters agreed on the classification, but one that was different from the clinical diagnosis. Four of these were clinical FTD subjects, which all raters classified as AD (Fig. 4, left). All raters classified one subject, a clinical AD patient, as DLB due to low 11C-DTBZ DV in the putamen (Fig. 4, right).
Ratings using the 18F-FDG plus 11C-DTBZ DV image pairs exhibited slightly higher consistency. All 3 raters agreed on 25 of 27 cases, yielding a mean unweighted Cohen’s κ of 0.92 for the between-rater comparisons. Since each individual rated the 18F-FDG+DV image sets approximately 6 wk after the K1+DV ratings, a learning effect may have contributed to the small improvement in interrater reliability. The 5 cases that were classified by all raters differently than the clinical diagnosis when using 11C-DTBZ K1 were again classified differently when using 18F-FDG.
Within-rater classification between K1+DV and FDG+DV image sets was the same in 23, 24, and 25 of the 27 cases for the 3 raters, respectively (72 of 81 total ratings), yielding a mean unweighted Cohen’s κ of 0.83. In comparison, rater and clinical diagnoses agreed 59 of 81 times for 11C-DTBZ K1+DV and 60 of 81 times for 18F-FDG+11C-DTBZ DV. This level of agreement with clinical diagnosis was significantly lower than both across- and within-rater agreement, indicating that while K1 and 18F-FDG provide very similar information it is not always concordant with the clinical data.
DISCUSSION
Our results demonstrate excellent correlation between regional cortical K1 values derived from 11C-DTBZ imaging and regional cortical glucose utilization values measured with 18F-FDG. Qualitative visual examination of individual 11C-DTBZ K1 and 18F-FDG image sets confirm that K1 images reproduce the regional metabolic alterations characteristic of the 3 major degenerative dementias. This was true both when PET results matched the working clinical diagnosis (Fig. 1) and in all cases in which the qualitative assessment by the raters disagreed with the working clinical diagnosis (Fig. 4). This is not surprising as regional cerebral perfusion is tightly coupled to regional cerebral metabolic demands. 11C-DTBZ K1 provides nearly equivalent data to 18F-FDG not only with respect to regional cortical patterns but also in the magnitudes of the deficits in specific cortical regions (Fig. 2). The correlation between regional K1-derived estimates of cortical perfusion and 18F-FDG-derived estimates of cortical metabolism is even stronger in demented subjects than in control subjects, due mostly to the higher degree of variation (broader range of values) in cortical metabolism/perfusion in demented subjects. In 45 of the 52 patients, the correlation between the 2 PET measures exceeded 0.90.
The results of both the quantitative logistic regression analysis and the visual ratings indicated that 11C-DTBZ K1 data/images and 18F-FDG data/images are nearly interchangeable when classifying a patient’s dementia. 18F-FDG imaging may be slightly superior to 11C-DTBZ K1 due to the inherently better noise properties of the images, but there were no cases in which a diagnosis appeared clear-cut with one measure and not the other. In contrast, the agreement between these methods and the working clinical diagnosis was much lower. This suggests that, without autopsy confirmation, the use of clinical diagnosis as a gold standard for assessing sensitivity and specificity of diagnosis by PET is problematic. Varma et al. demonstrated that clinical criteria do a poor job of distinguishing FTD from AD (17). Among the 7 clinically diagnosed FTD patients in this study, 4 had both qualitative appearance and quantitative measures more consistent with AD than FTD.
The key result from the logistic regression is that both K1 and 18F-FDG data were consistent in suggesting a diagnosis of AD or DLB. Discrimination between FTD and AD/DLB was limited for 2 reasons. First, the FTD group comprised only 7 of the 52 patients. Second, any clinical misdiagnoses in this group would alter the probability estimates and the probability threshold for classification.
18F-FDG has been proposed as a method for the diagnosis and differentiation of dementia. Silverman et al. (26) presented data on a large number of demented subjects of mixed etiologies studied prospectively with 18F-FDG. A substantial fraction of these subjects had autopsy confirmation of diagnosis. Their study, which included individuals with pathologically verified DLB and FTD, showed that 18F-FDG was excellent at confirming the presence of AD and other degenerative dementias (sensitivity, >90%) but that discrimination of AD from other forms of degenerative dementia had a specificity of only ∼70%. Results from the present study are in accord with those from their study, as our sensitivity for detecting the presence of dementia was ∼90%, while our sensitivity and specificity for differentiating between dementias using either K1 or 18F-FDG alone was just over 70%. A major obstacle to the use of 18F-FDG in differentiating dementias is overlap between DLB and AD. These disorders have similar patterns of cortical hypometabolism/perfusion, with the exception of the occipital cortex (Fig. 2, bottom), where DLB exhibits greater deficits. The presence or absence of occipital hypometabolism, however, is not a particularly sensitive discriminator of AD and DLB. Previous studies of pathologically confirmed DLB suggest that the sensitivity and specificity of 18F-FDG imaging are equal to or slightly better than those based on clinical evaluation (27,28). As DLB is a major cause of dementia, imprecise discrimination of AD and DLB is a major obstacle to using 18F-FDG to differentiate dementias.
Methods visualizing nigrostriatal terminals provide a more promising approach to differentiating DLB and AD. Postmortem studies indicate that nigrostriatal dopaminergic terminal density is essentially normal in AD and markedly reduced in DLB (38,39). PET and SPECT studies with ligands binding to nigrostriatal terminals provide good discrimination of clinically ascertained AD and DLB (30,31). The precision of this approach, however, is confounded by the fact that nigrostriatal pathology occurs in FTD, and a previous PET study indicates that some FTD subjects have marked reductions in nigrostriatal terminal density (32). FTD, however, has a distinctive pattern of frontotemporal cortical hypometabolism, often with greatest decreases in the medial frontal cortices. Distinguishing patterns of cortical hypometabolism is the most promising avenue for differentiating FTD from AD and DLB. Frontotemporal perfusion or metabolic deficits are included as “strong supporting evidence of FTD” in existing guidelines for clinical diagnosis of FTD (40). Perfusion or metabolic imaging methods have been used both clinically and in research to characterize FTD (40,41). Another potentially confounding, though rare, situation would be individuals with both Parkinson’s disease and AD, which could mimic the pattern of DLB.
A PET method such as 11C-DTBZ, providing accurate characterization of both regional cortical perfusion/metabolic deficits and nigrostriatal terminal density, offers the possibility of diagnosing and differentiating AD, FTD, and DLB. Our interrater reliability assessment demonstrated high reliability. In this exercise, images were presented transaxially and diagnostic classification was based only on qualitative impression of images. No effort was made to extract quantitative data from the images, which may further improve classification accuracy. Viewing of transaxial images alone is likely not optimal for the differential diagnosis of neurodegenerative dementias. Three-dimensional stereotactic surface projection analysis (42), for example, is an easily applied alternative for viewing and quantifying regional perfusion/metabolism deficits with demonstrated superiority in both diagnostic sensitivity and specificity (27). Fully automated quantitative methods such as discriminant analysis using logistic regression may prove useful, but will require further optimization of the formulas for calculating classification probabilities and thresholds. Use of 11C-DTBZ PET or any other imaging method for differentiation of dementias will require validation in large prospective studies of representative patient populations. Evaluation of diagnostic precision in subjects with early, mild dementia will be particularly important.
Although we have focused on 11C-DTBZ, the extraction of reliable regional cortical perfusion/metabolism data is not unique to this PET tracer. Any radiotracer that has a reasonably high extraction fraction can yield a K1 measure proportional to cerebral blood flow and can be used to assess both regional perfusion/metabolism and disease-specific neurochemistry.
CONCLUSION
Multiple PET measures, whether 2 parameters from a single PET study—such as 11C-DTBZ K1 and DV—or 2 parameters from different studies—such as 18F-FDG and 11C-DTBZ DV—offer complementary information useful in categorizing dementias. Due to the near-equivalence of K1 and 18F-FDG, images from a single 11C-DTBZ scan provide as much diagnostic information as a 2-scan study using both 11C-DTBZ and 18F-FDG, while requiring only half the time yet far more information than can be obtained for a single 18F-FDG study alone.
Acknowledgments
This research was supported in part by grants P01 NS15655 and AG08671 from the National Institutes of Health and DE-FG02-87ER60561 from the Department of Energy. We thank Drs. Nancy Barbas, Norman L. Foster, Douglas Gelb, Judith Heidebrink, and Scott Turner for thoroughly evaluating and referring these patients to this study and the PET Center staff for production of radiotracers and performance of the PET studies.
Footnotes
Received Oct. 19, 2004; revision accepted Feb. 14, 2005.
For correspondence or reprints contact: Robert A. Koeppe, PhD, Division of Nuclear Medicine, Department of Radiology, University of Michigan Medical School, 3480 Kresge III, Box 0552, Ann Arbor, MI 48109.
E-mail: koeppe{at}umich.edu
REFERENCES
In this issue


Jump to section
Related Articles
Cited By...
- Dual-Biomarker Imaging of Regional Cerebral Amyloid Load and Neuronal Activity in Dementia with PET and 11C-Labeled Pittsburgh Compound B
- Early 11C-PIB Frames and 18F-FDG PET Measures Are Comparable: A Study Validated in a Cohort of AD and FTLD Patients
- The 18F-FDG PET Cingulate Island Sign and Comparison to 123I-{beta}-CIT SPECT for Diagnosis of Dementia with Lewy Bodies
- In Vivo Imaging of {beta}-Cell Mass in Rats Using 18F-FP-(+)-DTBZ: A Potential PET Ligand for Studying Diabetes Mellitus
- Multicenter Standardized 18F-FDG PET Diagnosis of Mild Cognitive Impairment, Alzheimer's Disease, and Other Dementias
- Evaluation of the Metabotropic Glutamate Receptor Subtype 5 Using PET and 11C-ABP688: Assessment of Methods