


Abstract
A whole-body 3-dimensional PET scanner using gadolinium oxyorthosilicate (GSO) crystals has been designed to achieve high sensitivity and reduced patient scanning time. This scanner has a diameter of 82.0 cm and an axial field of view of 18 cm without interplane septa. The detector comprises of 4 × 6 × 20 mm3 GSO crystals coupled via an optically continuous light guide to an array of 420 photomultiplier tubes (39-mm diameter) in a hexagonal arrangement. The patient port diameter is 56 cm, and 2.86-cm (1.125 in.) thick lead shielding is used to fill in the region up to the detector ring. Methods: Performance measurements on the scanner were made using the National Electrical Manufactures Association (NEMA) NU 2-2001 procedures. Additional counting rate measurements with a large phantom were performed to evaluate imaging characteristics for heavier patients. The image-quality torso phantom with hot or cold spheres was also measured as a function of counting rate to evaluate different techniques for randoms and scatter subtraction as well as to determine an optimum imaging time. Results: The transverse and axial resolutions near the center are 5.5 and 5.6 mm, respectively. The absolute sensitivity of this scanner measured with a 70-cm-long line source is 4.36 cps/kBq, whereas the scatter fraction is 40% with a 20 × 70 cm line source cylinder. For the same cylinder, the peak noise equivalent count (NEC) rate of 30 kcps at an activity concentration of 9.25 kBq/mL (0.25 μCi/mL) leads to a 7% increase in the peak NEC value. A significant reduction in the peak NEC is observed with a larger 35 × 70 cm line source cylinder. Image-quality measurements show that the small 10-mm sphere in the NEMA NU 2-2001 image-quality phantom is clearly visible in a scan time of 3 min, and there is no noticeable degradation in image contrast at high activity levels. Conclusion: This whole-body scanner represents a new generation of 3D, high-sensitivity, and high-performance PET cameras capable of producing high-quality images in <30 min for a full patient scan. The use of a pixelated GSO Anger-logic detector leads to a high-sensitivity scanner design with good counting rate capability due to the reduced light spread in the detector and fast decay time of GSO. The light collection over the detector is fairly uniform, leading to a good energy resolution and, thus, reduced scatter in the collected data due to a tight energy gate.
The Allegro scanner (Philips Medical Systems) represents a new generation of 3-dimensional (3D) whole-body PET scanners. It was first installed at the University of Pennsylvania PET Center in early 2002 and, since then, has been routinely used for clinical studies. It is based on the detector technology that was developed for use in the dedicated brain scanner, G-PET (1), at the University of Pennsylvania. It uses small, discrete gadolinium oxyorthosilicate (GSO) crystals placed in an Anger-logic detector to achieve optimal crystal separation with minimal light spread in the detector. This leads to good spatial resolution and significantly reduced pulse pileup effects in the scanner. The use of fast and dense GSO also leads to a decrease in scanner dead time and a high sensitivity. The good and uniform energy resolution achieved with this design allows the use of a high-energy gate (410 keV) in the scanner and, therefore, an efficient rejection of scatter and random coincidences in the images. Transmission imaging is performed with a postinjection transmission scan using a single 137Cs source (662-keV γ-rays). The intrinsic physical properties of the scanner combined with the iterative, fully 3D, row-action maximization-likelihood algorithm (RAMLA) image reconstruction leads to the acquisition of very high quality whole-body images in <30 min. In this study, we evaluated the imaging characteristics of the Allegro scanner using the National Electrical Manufactures Association (NEMA) NU 2-2001 standard (2) measurements as well as additional measurements to evaluate imaging characteristics at low and high counting rates.
MATERIALS AND METHODS
Scanner Design
Detector.
The Allegro scanner is comprised of 28 flat modules of a 22 × 29 array of 4 × 6 × 20 mm3 GSO crystals. Adjacent modules are coupled together with an optical grease to facilitate transfer of scintillation light across module boundaries. Even so, there is internal reflection of some light at these boundaries, and crystal separation in this region is improved by straddling photomultiplier tubes (PMTs) across the 2 adjoining modules. This geometry leads to a ring diameter of 82 cm between 2 directly opposite modules and an axial field of view (FOV) of 18 cm. Readout is performed by a hexagonal array of 420 PMTs that are 39 mm in diameter. This detector design was derived from the pixelated GSO Anger-logic detector used in the G-PET brain scanner (1) and retains its characteristics of good crystal separation with optimized light spread in the Anger-logic detector. The GSO crystals used in Allegro were doped with 1.0% cerium as compared with the 0.5% cerium concentration for the GSO used for the G-PET scanner. The higher cerium concentration leads to a faster decay time (55 ns compared with 85 ns) and, thus, lower dead time while maintaining similar energy resolution (3). The use of this detector together with the fast and dense GSO scintillator leads to a high-sensitivity and counting-rate-performance 3D PET scanner. To reduce activity from outside the FOV, the patient port is 56 cm, and 2.86-cm (1.125 in.) thick lead shielding is used to fill in the region up to the detector ring.
Electronics.
The electronics architecture for the Allegro is derived from the original PENN PET design (4) with appropriate upgrades to use new advancements in technology. The output from each PMT enters an analog preamplifier channel for pulse amplification, followed by signal digitization with 50-MHz, flash (asynchronous) analog-to-digital converters. Concurrently, the analog preamplifier outputs of the PMTs are also summed into 28 overlapping trigger channels, each consisting of a group of 20 PMTs. Each trigger signal passes through a constant fraction discriminator (CFD) to obtain trigger timing information for high-energy deposition events in the detector. The overlapping triggering scheme and good system energy resolution provide the capability to raise the trigger CFD threshold as high as 400 keV, thereby reducing the scanner dead time significantly. The trigger signals are formed before PMT gain matching and, since the gains can vary by as much as a factor of 4, the CFD threshold is set lower than the final software energy lower level discriminator (ELLD) that sets a gate for events that are histogrammed in the sinogram. With a CFD threshold of around 400 keV, we are able to achieve uniform event distribution over the entire scanner area. The CFD signals are then checked for coincident events and, once a coincidence is detected (within a timing window, 2τ, of 7.5 ns), the digitized PMT signals within the 2 groups of trigger channels are read up, followed by calculations of the local energy and local position centroid (5). The coincidence timing window for the Allegro is similar to NaI(Tl)-based scanners, which is better than bismuth germanate (BGO)-based scanners (15–20 ns) but not as good as lutetium oxyorthosilicate (LSO)-based scanners (6 ns). For transmission scanning, the scanner is run in a singles mode (6), where these calculations are performed for every event that triggers the electronics.
Data Calibrations.
For an accurate measurement of interaction position in the detector and the deposited energy, a PMT gain matching needs to be performed to compensate for the PMT gain differences. Additionally, the collected light has a maximum of 20% difference between events at a PMT center and its edges. This is due to loss of collected light in the gaps between the hexagonally packed PMTs and small variations between light outputs of individual crystals. To achieve good system energy resolution, a position-based energy correction (scaling) is performed through a lookup table. The final data correction before sinogram binning involves identification of crystal boundaries. This must take into consideration the spatial nonlinearity of the calculated position, which is a characteristic of all Anger-logic detectors. An automated search algorithm previously developed for the G-PET (1) brain scanner has been adapted for Allegro. This algorithm detects the minima (between crystals) within a high-count flood histogram, defines the crystal boundaries around each crystal, and assigns a real position to all events that occur within each boundary region.
After all of these corrections have been performed, the acquired data from the scanner are binned into a sinogram with 161 angles and 295 rays for every ring combination (total of 292 = 841 combinations) covering a 576-mm FOV for the whole body. For brain imaging, the sinogram for each ring combination is split into 322 angles and 295 rays covering a 256-mm FOV. Interpolation is performed to rebin these data into a 256 × 192 sinogram, up to 15 tilts (out-of-plane angle) (typically, 7 tilts for whole-body and brain studies) and 2- or 4-mm-thick slices (brain and whole body, respectively).
Data Corrections and Image Reconstruction.
Initially, routine clinical scans used a background tail-fitting algorithm for randoms and scatter correction. With a more recent software release, Allegro scanners now have the capability of estimating randoms using the delayed coincidence window technique. For routine clinical scans we currently use direct online randoms subtraction. The tail-fitting algorithm is however still being used for scatter correction. Within our research group we have developed the capability for a model-based scatter correction using a fast, accurate algorithm (7). This method is currently undergoing a rigorous analysis using patient data as well as challenging phantom measurements. In this work, we have performed image-quality measurements using both randoms smoothing (Casey averaging) (8,9) algorithms as well as the model-based scatter correction technique to compare the relative improvements over the current manufacturer-supplied techniques.
Attenuation correction is performed by acquiring multiple transmission scans in a singles mode using a 740-MBq (20 mCi) 137Cs transmission source. The source holder is made of tungsten, which provides fanbeam collimation between the 740-MBq (20 mCi) source and patient and shields the back detectors. The source is located at the center of the axial FOV and, with each rotation, which takes 20 s, we sort and store transmission data over an axial dimension of 84 mm. Therefore, a full whole-body scan requires multiple bed positions (1 or 2 rotations each) with an axial offset of 84 mm between positions. Single-slice rebinning and ordered-subsets expectation maximization (OSEM) reconstruction are then used to reconstruct the transmission image, followed by a histogram-based algorithm for segmentation (10).
Routine clinical image reconstruction is performed with a fast, fully 3D iterative algorithm (3D-RAMLA) (11–14) with a relaxation parameter of 0.006 and a “blob” radius of 2.5. The reconstruction time with full corrections on a SUN Blade 2000 (Sun Microsystems, Inc.) is <5 min for a single bed position to produce a 144 × 144 image with 4-mm-thick slices from a 256 × 192 sinogram and 7-tilt (out-of-plane angle) dataset.
Scanner Performance Measurements
Performance measurements were done on the Allegro scanner following the procedure outlined in the new NEMA NU 2-2001 standard (2,15). Additional measurements were taken of spatial resolution and also to evaluate the counting rate performance of objects larger than the 20 × 70 cm cylinder. We manufactured an annular sleeve to fit around the 20-cm diameter, which extends its diameter to 35 cm.
Spatial Resolution.
Spatial resolution measurements were performed using a point source of 18F in a thin glass capillary tube with an inner diameter of <1 mm. The axial length of the point source was also kept to <1 mm. Following the NU 2-2001 protocol (2), measurements were performed at radial positions of 1 and 10 cm. Additional measurements were performed at radial positions of 15 and 20 cm. The data were acquired in 7-tilt (out of plane) angles with 2-mm sampling in the transverse and axial directions. The sinograms were reconstructed using the 3D Fourier reprojection (3D-FRP) algorithm (16), with an unapodized filter (ramp filter with a cutoff at the Nyquist frequency). For comparison, we also reconstructed the point source data with Fourier rebinning (FORE) (17) followed by 2-dimensional filtered backprojection (2D-FBP) for comparison. FORE is commonly used in 3D PET; however, this algorithm suffers from losses in axial resolution. The NEMA measurement specifies that the image pixel size should be smaller than one third of the expected full width at half maximum (FWHM). The images were reconstructed into a 288 × 288 × 90 array giving a 2-mm cubic image voxel. The FWHM and full width at tenth maximum (FWTM) of the point spread functions (PSFs) were determined in all 3 directions by forming 1-dimensional (1D) response functions through the peak of the distribution in the 3 orthogonal directions. The width of these profiles (wide profile) at right angles to the direction of measurement is ∼2 times the FWHM in those directions, rather than a single pixel, to reduce measurement variability. The FWHM and FWTM are calculated by linear interpolation between adjacent pixels at one half or one tenth of an estimate of the maximum value of the response function. For comparison, we also used profiles only 1 pixel wide (narrow profile) for analysis, as per the original NEMA NU 2-1994 protocol (18,19). These NU 2-1994 measurements are included here because the spatial resolution quoted for some older scanners was measured with this technique. However, it needs to be pointed out that the NU 2-2001 analysis technique is more robust and less error prone.
Sensitivity.
Following the NEMA NU 2-2001 standard (2), the absolute sensitivity of the Allegro scanner was measured using a 70-cm-long line source at the center of the scanner, without and with 4 different metal sleeves representing varying amounts of attenuation. This measurement technique is based on work described previously by Bailey et al. (20) and has the advantage of no significant self-attenuation and scatter contamination, leading to unambiguous determination of the scanner sensitivity. The measured counting rate with each metal sleeve was corrected for activity decay and the natural logarithm of the results plotted as a function of sleeve thickness. Linear regression was used to fit the data and obtain an extrapolated value for the absolute sensitivity of the scanner with no metal sleeves. The sensitivity measurement was performed using the standard energy window of 410–665 keV.
Scatter.
The scatter fraction (SF) for the Allegro scanner was measured following the NU 2-2001 procedure (2), which uses a line source filled with 18F, placed at a 4.5-mm radial offset from the center of a solid polyethylene cylinder (diameter, 20 cm; length, 70 cm) with a water equivalent density of 1 g/mL. The length of tube is 70 cm and the volume is ∼5.7 mL. This phantom is equivalent to a uniformly water-filled cylinder of similar size. The data were acquired at low counting rates and rebinned using single-slice rebinning (SSRB) (21). The sinogram profile was used to calculate the number of scatter events within a diameter of 24 cm (4 cm larger than the phantom diameter) and the number of trues within a 2-cm radius of the source. The scatter within the peak was estimated by assuming a constant background under the peak, the level of which was determined by the average of the intensities near the edge of the peak (at ±2 cm). These scatter measurements were performed as function of the lower energy gate (ELLD) while keeping the upper gate fixed at 665 keV. After estimating the trues and scatter, the noise equivalent count (NEC) was calculated using the definition:
 where T is the true, Sc is scatter, R is random counting rate within a 24-cm diameter circular region centered on the phantom, and k is set to 1 or 2 depending on whether we use direct randoms subtraction or use variance reduction techniques for estimating a smooth randoms distribution. For the scatter calculations, randoms were 3% of the collect rate. Though this randoms rate is slightly higher than the NEMA-prescribed procedure (randoms 1% of the collect rate), the subtraction of randoms estimated through the delayed window data allows for an accurate measurement of the SF. The data acquisition was performed in list mode so that sinogram rebinning could be performed in software using different ELLD values. To better assess the performance of the scanner for heavy patients, we manufactured an annular polyethylene sleeve of inner diameter 20 cm and outer diameter of 35 cm. This sleeve was then fit over the 20 × 70 cm cylinder to achieve an effective 35-cm-diameter × 70-cm-long cylinder that better simulates a very heavy patient. In our experience, the counting rates from the 20 × 70 cm phantom simulate a light patient of ∼45.4 kg (100 lb) and the 35 × 70 cm phantom was designed with 3 times the volume (and mass) so that it simulates a patient 3 times heavier—thus, 136.2 kg (300 lb). The scatter measurements were then repeated as function of ELLD. The estimation of scatter within the sinogram was similar to the standard NU 2-2001 analysis except that, instead of using 24 cm as the object diameter, here we used 39 cm (4 cm larger than the object diameter of 35 cm).
Counting Rate Performance.
For counting rate performance in a whole-body imaging situation, the NEMA NU 2-2001 standard (2) using the 20-cm-diameter × 70-cm-long line source cylinder was used. The analysis as described earlier for scatter measurement is again used here, except that at high rates the background estimation now includes scatter and random whereas at low rates it includes only scatter. Based on our earlier results for SF and relative NEC as a function of the energy gate (Fig. 1), we performed this counting rate measurement at 2 energy gate settings, the standard 410–665 keV as well as 425–665 keV. The counting rate measurements were then repeated for the 35-cm-diameter line source phantoms with the standard energy gate of 410–665 keV as well as the gate of 450–665 keV. The higher ELLD settings were chosen because the relative NEC calculation suggests that higher counting rate capability can be achieved at these settings.

(A) SF as function of lower energy gate (ELLD) for 20 × 70 cm and 35 × 70 cm line source phantoms. Data were acquired at low activity level so that randoms were <3% of collected rates. (B) Calculated relative NEC vs. ELLD for 20 × 70 cm and 35 × 70 cm line source phantoms.
Additionally, to evaluate the counting rate performance of the Allegro scanner in a brain imaging situation, we performed a counting rate measurement with a uniform water-filled 20-cm-diameter × 19-cm-long cylinder using the earlier NEMA NU 2-1994 standard (18) and a standard energy gate of 410–665 keV. The tail-fitting method using a parabolic function was used to estimate the background (scatter + random) fraction (background counts/total counts) for each acquisition frame (22). The background fraction at low activity levels determines the SF; for the higher activities, the randoms rate was estimated from the background fraction and the SF. The NEC rate was then calculated.
Image Quality.
Image-quality measurements were performed using 6 small spheres in the NEMA/IEC (International Electrotechnical Commission) torso phantom together with a cylindric foam insert of 50-mm diameter and 0.3 g/cm3 density. The spheres had internal diameters (dI) of 37, 28, 22, 17, 13, and 10 mm and were placed so that their centers lay in the same axial plane close to the central slice in the scanner. The 2 largest spheres were always cold, whereas the 4 smaller spheres were filled with an activity concentration of either 8:1 or 4:1 with respect to the background. To simulate activity outside the FOV, the 20 × 70 cm line source cylinder was placed adjacent to the torso phantom and outside the scan FOV. For analysis, the count density was determined for circular regions of interest (ROIs) with diameters (D) equal to the physical inner diameters of the spheres and centered over the 6 spheres in the central slice. The background count density was obtained by drawing 12 ROIs within the central slice and in slices ±1 and ±2 cm away, leading to 60 background ROIs for each sphere size. As described in the NU 2-2001 contrast measurement (2), the percentage contrast (QH,j) for each hot sphere (j) was defined as:
 where CH,j is the count density in the ROI for sphere j, CB,j is the average count density of the background ROIs for sphere j, and aH and aB are the activity concentrations in the spheres and background, respectively. The background variability (Nj) for sphere j was defined as:
 where CB,j is the average of the background ROI counts (over 60 regions) for sphere j and CB,j,k is the background ROI counts for sphere j in the k-th ROI.
Three different measurements were performed with this setup. The first measurement was to assess the impact of acquisition time on the image contrast and noise. Here a transmission scan was followed by a dynamic emission acquisition with varying scan times. The starting activity concentration of 18F in the phantom background was ∼5.3 kBq/mL (0.14 μCi/mL), which corresponds to a typical injected dose for a clinical scan. The line source phantom was filled with 116 MBq (3.08 mCi) to also yield a similar activity concentration. Both 8:1 and 4:1 hot sphere-to-background activity concentrations were investigated here and the emission scan time varied in 1-min increments from 1 to a maximum of 11 min, corresponding to a total emission scan time of 11–121 min and another 4-min transmission scan time for a 100-cm-long object. Standard clinical reconstruction using 3D-RAMLA was used for producing the images, after using a 2D parabolic tail-fitting estimation and subtraction for randoms and scatter, singles transmission, and image segmentation for attenuation correction.
Our next set of measurements investigated new correction techniques for both randoms and scatter. After the latest upgrade, the Allegro scanner now has the capability of direct randoms estimation using a delayed coincidence window technique. Currently, the scanner provides the capability of direct online randoms subtraction from the prompt sinograms, as well as separately saving the randoms and prompt sinograms for further processing in software. Independently, we have recently developed a single-scatter simulation (SSS) based on the Klein–Nishina equation (7) for a more accurate estimation of the scatter in collected data. The aim of this set of measurements was to evaluate the effect on image noise characteristics of direct randoms subtraction against using an in-plane Casey averaging procedure (8,9) for variance reduction in the randoms sinogram. Additionally, we also evaluated the impact of the SSS on the contrast recovery in the scanner. These measurements were performed with a 3-min (clinical) emission acquisition time with a hot sphere-to-background activity concentration of 8:1.
The final set of image-quality measurements was performed to assess the impact on image quality as a function of counting rate or injected activity. The emission data were acquired as a dynamic acquisition with a 3-min acquisition time for each emission scan. The hot sphere-to-background activity concentration was once again 8:1, but the starting background activity concentration was ∼18 kBq/mL (0.47 μCi/mL). We compared direct randoms subtraction with the Casey-averaged randoms subtraction technique and the tail fitting to the model-based SSS technique. The singles rate at the highest activity concentration was 26 Mcps with an R/(T + Sc) of 1.0.
Patient Study.
For illustration, we have included images from 2 whole-body scans, one from a 55-kg patient and one from a 100-kg patient. The 55-kg patient was injected with 287 MBq (7.75 mCi) 18F-FDG 60 min before scan time, and a total of 8 emission frames (3 min each) and 10 interleaved transmission frames (40 s per frame) were acquired. These data were then reconstructed after subtraction of smoothed randoms (using Casey averaging) and scatter (using SSS) and using the standard clinical reconstruction with 3D-RAMLA. Based on the standard clinical protocol followed at our institution, the 100-kg patient was injected with 423 MBq (11.42 mCi) 18F-FDG 60 min before scan time. The acquisition and reconstruction protocols were the same as for the lighter patient.
RESULTS
Spatial Resolution
Table 1 summarizes the spatial resolution measurement results for the Allegro scanner. The spatial resolution near the center is ∼5.5 mm in the transverse direction and 5.6 mm in the axial direction (wide profile, NEMA NU 2-2001 (2)). The results with the narrow profile (NEMA NU 2-1994 (18)) are slightly better at 4.6 and 5.2 mm in the transverse and axial directions, respectively. The NEMA NU 2-2001 analysis gives more robust and consistent results, but better results (smaller FWHM and FWTM) are seen with the NEMA NU 2-1994 analysis. This requires very good statistics in the peak and careful attention to ensure that the profile is placed over the center of the peak to reduce the likelihood of error. There is a degradation in the axial resolution when the source is at 10 cm radially due to FORE, an effect that is somewhat reduced by the 3D-FRP reconstruction. This analytic algorithm is used to analyze the point source data since an iterative algorithm gives a measure of spatial resolution that depends on the number of iterations. However, since the 3D-RAMLA algorithm is fully 3D, it will behave similarly as 3D-FRP with respect to achieving a uniform PSF as a function of radius. The transverse resolution shows almost no degradation (<2%) when the source is placed 10 cm radially.
Results from Spatial Resolution Measurements with Point Source
Sensitivity
The absolute sensitivity of the Allegro scanner with standard energy window is 4.36 cps/kBq and 4.65 cps/kBq when the line source is placed at the center and a radial distance of 10 cm, respectively. The axial sensitivity profile is triangular in shape and peaks at ∼0.2 cps/kBq when the line source is at r = 0 cm.
SF
Figure 1A shows the measured SF as function of ELLD for the 20 × 70 cm line source and 35 × 70 cm line source phantoms. The corresponding calculated NEC curves (normalized to the peak value for 20 × 70 cm line source phantom) are shown in Figure 1B. These results indicate that by raising the ELLD value we reduce the SF until an optimal ELLD value is reached where the NEC peaks. Raising the ELLD beyond this value leads to a more significant reduction in the true counts and, therefore, a decrease in the NEC value. The NEC curves also show that the optimal ELLD value is dependent on the phantom size (425 keV for the small and 450 keV for the large phantom) and is higher for the larger phantom, which has more scatter. For the standard ELLD value of 410 keV, the NU 2-2001 SF value (2) for the 20 × 70 cm line source cylinder is 40% and for the 35 × 70 cm line source cylinder is 61%. At the optimal ELLD value, the SF is reduced to 37% for the 20 × 70 cm line source cylinder and 51% for the 35 × 70 cm line source cylinder.
Counting Rate Performance
Figures 2A–2D summarize the results of the counting rate measurements for a whole-body imaging situation. For the NU 2-2001 20 × 70 cm line source phantom with the standard energy gate of 410–665 keV (2), the true rate peaks at 83 kcps at an activity concentration of 13.69 kBq/mL (0.37 μCi/mL), and the NEC rate (k = 1) peaks at 30 kcps for an activity concentration of 9.25 kBq/mL (0.25 μCi/mL). The sensitivity for this phantom is 14.7 kcps/kBq/mL (545 kcps/μCi/mL). Repeating these measurements, with the optimal (as determined in Fig. 1) energy gate of 425–665 keV, the sensitivity decreases slightly to 14.2 kcps/kBq/mL (525 kcps/μCi/mL). The peak NEC value now increases by a little less than 7%, showing some minor improvement with the optimal energy gate. With the 35 × 70 cm line source phantom, there is a significant drop in both the true rate as well as the peak NEC value, compared with the 20 × 70 cm phantom. For the standard energy gate, the sensitivity for this large phantom is 11.6 kcps/kBq/mL (430 kcps/μCi/mL), the peak true rate is 25 kcps at an activity concentration of 3.33 kBq/mL (0.09 μCi/mL), and the peak NEC value is ∼5 kcps for the same activity concentration. Using a higher ELLD value (energy gate of 450–665 keV) reduced the sensitivity to 10 kcps/kBq/mL (370 kcps/μCi/mL), but the peak NEC rate is now 6.25 kcps, an increase of 25%. Figures 2E and 2F show the SF (at low-activity levels) as a function of slice number for the 20 × 70 cm line source phantom (Fig. 2E) and 35 × 70 cm line source phantom (Fig. 2F). The average SF (standard energy gate) over all slices was 40% and 61% for the 20 × 70 cm and 35 × 70 cm phantoms, respectively.

(A and B) Counting rate curves measured for 20 × 70 cm line source phantom with standard ELLD of 410 keV (A) and optimized ELLD of 425 keV (B). (C and D) Counting rate curves measured for larger 35 × 70 cm line source phantom with standard ELLD of 410 keV (C) and optimized ELLD of 450 keV (D). (E and F) SF as function of slice number for 20 × 70 cm (E) and 35 × 70 cm (F) line source phantoms.
The results for the smaller 20 × 19 cm uniform cylinder that is more representative of brain imaging situations are shown in Figure 3. With the standard energy gate of 410–665 keV, the true rate peaks at 300 kcps at an activity concentration of 43.29 kBq/mL (1.17 μCi/mL), and the NEC rate (k = 1) peaks at 150 kcps for an activity concentration of 32.56 kBq/mL (0.88 μCi/mL). The sensitivity for this phantom is 18.1 kcps/kBq/mL (670 kcps/μCi/mL). The SF obtained through the tail-fitting method was measured to be 28%.

Counting rate curves measured for 20 × 19 cm uniform cylinder with standard ELLD of 410 keV. This cylinder is more representative of brain imaging situations.
Image Quality
Representative results from the datasets acquired with scan times of 1, 3, 6, and 9 min are given in Figure 4 for hot sphere-to-background activity concentrations of 8:1 (Figs. 4A and 4B) and 4:1 (Figs. 4C and 4D). Results for each acquisition time represent an average over multiple acquisitions. The contrast remains almost constant for all acquisition times except for the 1-min scan, and so the contrast recovery coefficient (CRC) results for the 9-min scan are plotted. The variability for the 1-min scan is noticeably poor but fits within the error limits compared with the scans of longer duration. In moving from a 1-min to a 3-min scan, there is a significant reduction in variability but a much smaller change from a 3-min to a 6-min (and 9 min) scan. These results indicate that a scan time of 3 min for a single bed position gives good contrast and noise properties, leading to a total emission scan time of 11 positions × 3 min = 33 min for a 100-cm-long object.
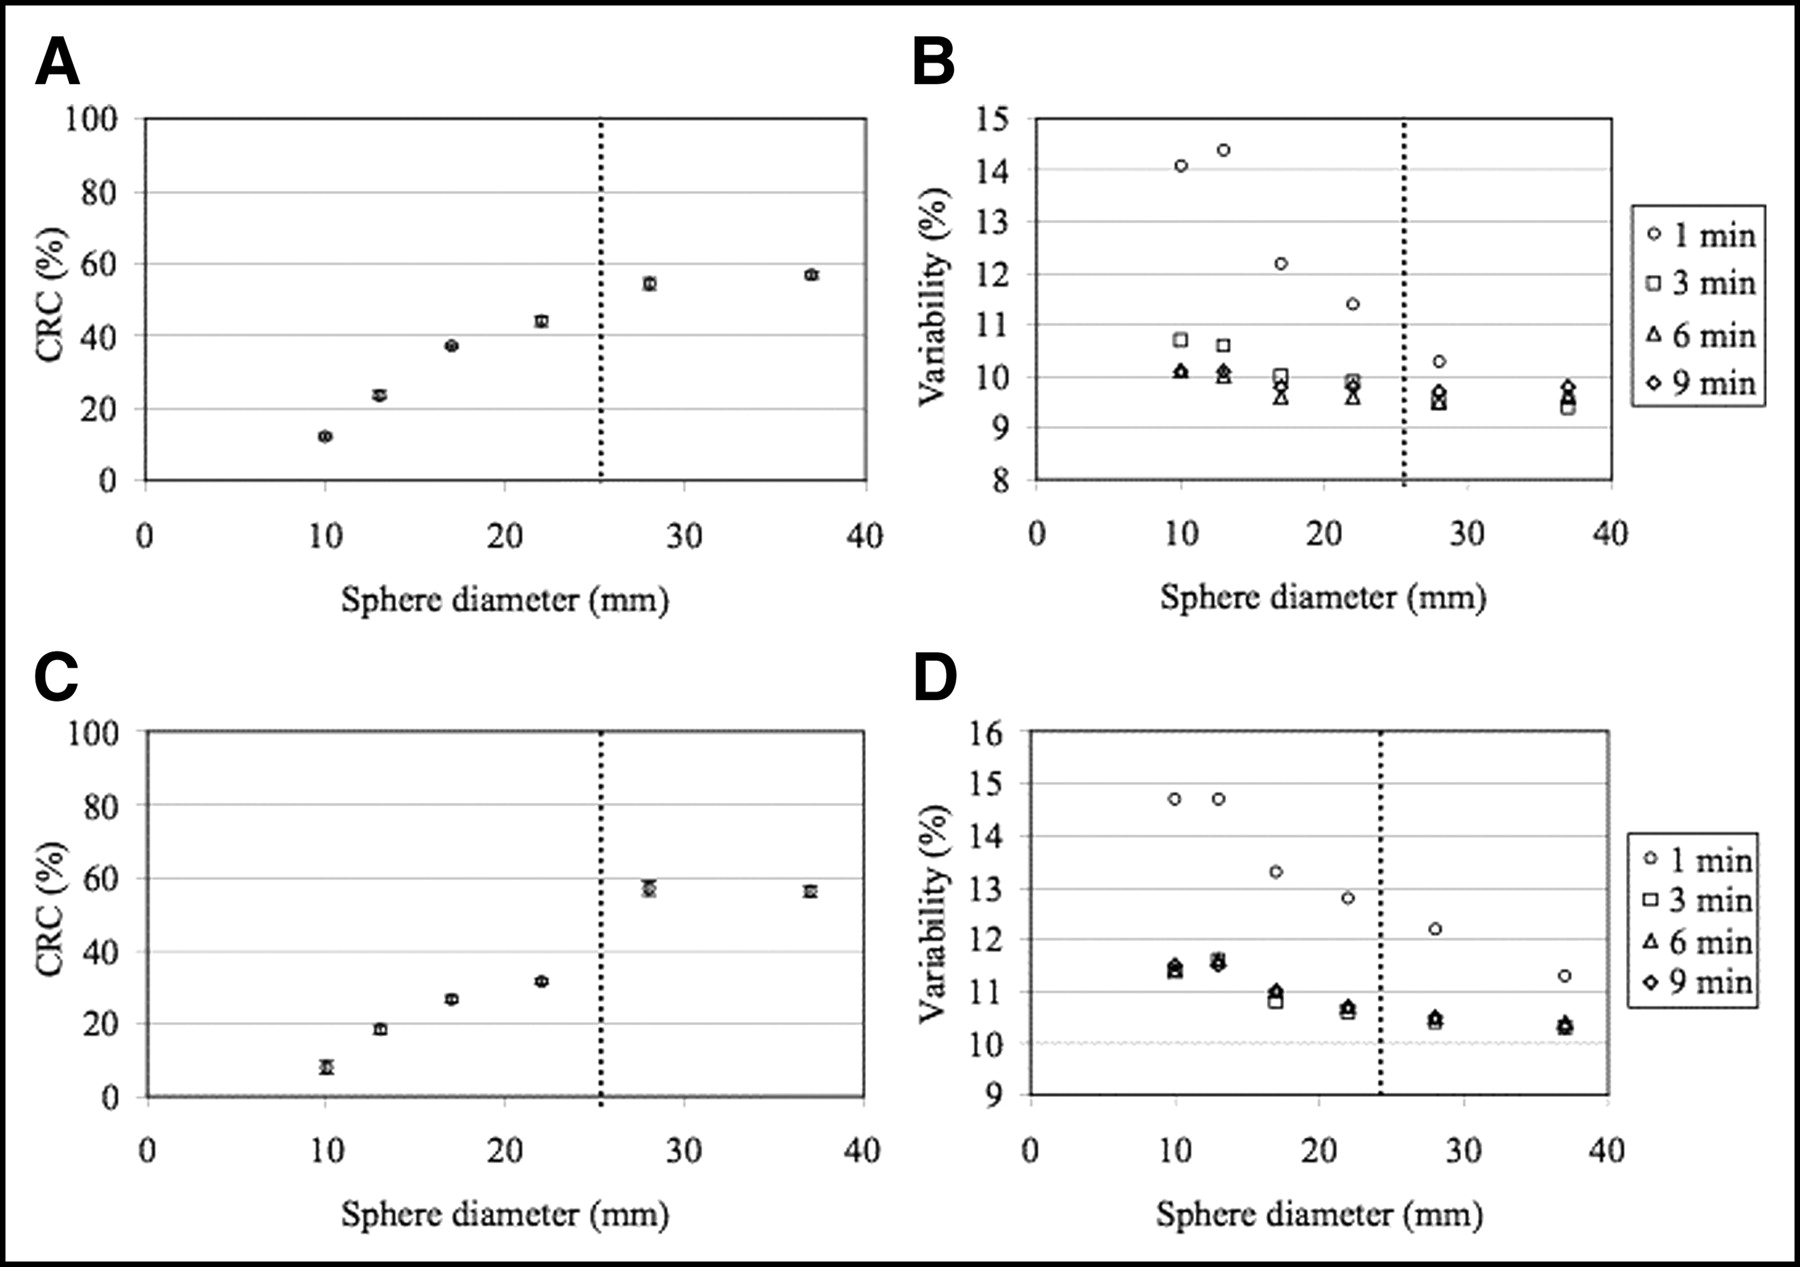
Contrast recovery coefficient (CRC) (A and C) and variability (B and D) for image-quality torso phantom for varying acquisition times. Ratio of activity concentration in hot spheres to background is 8:1 (A and B) and 4:1 (C and D). CRC was similar for all acquisition times except at 1 min. Results from 9-min acquisition are shown in CRC plot. Average error bars in variability plots were 6% (B) and 8.5% (D). Dotted vertical line in all 4 plots marks separation between large cold spheres on its right and small hot spheres on its left.
Figure 5 is a representative plot of the CRC and variability as a function of sphere size for 4 different processing techniques: tail fitting for both scatter and randoms, tail fitting for scatter after direct subtraction of randoms, SSS for scatter subtraction after either direct subtraction of randoms, or subtraction of smoothened randoms using the Casey averaging technique. These plots clearly show that the SSS simulation estimate for scatter leads to an overall increase in the CRC values, more noticeably for the large cold spheres. For randoms correction, all 3 techniques seem to behave in a similar manner without any noticeable differences. This is interesting because it indicates that at clinical rates, the low random coincidence rate leads to no significant improvements in noise properties after Casey averaging of the delays data.

CRC (A) and variability (B) for image-quality torso phantom for varying randoms and scatter correction techniques. Data were collected for 3 min, which is clinical standard for single bed position.
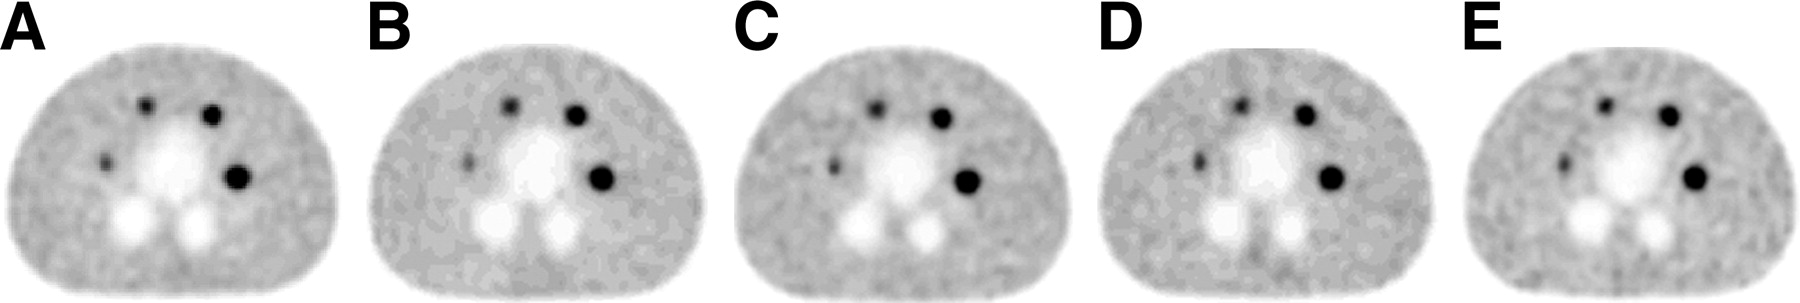
To better understand the impact of Casey averaging on the randoms correction, we then acquired the image-quality data as a function of counting rate starting with a reasonably high activity in the phantom. Figures 6A–6E show a representative middle slice from the reconstructed images at singles rates of 4.6, 7.1, 10.9 (similar to clinical rates), 16.9, and 26.1 Mcps after performing Casey averaging for randoms data and SSS for scatter subtraction. Qualitatively, the images at all 5 counting rates show no major differences.

(A–E) Reconstructed central slice for image-quality phantom. Images were acquired at singles rates of 4.6 Mcps (A), 7.1 Mcps (B), 10.9 Mcps (C) (clinically appropriate), 16.9 Mcps (D), and 26.1 Mcps (E). In these images, randoms were subtracted after Casey averaging of delays data followed by SSS for scatter correction.
In Figure 7, we plot the CRC and variability for the different sphere sizes and at varying singles rates. The variability plot shows that there is reduced noise in the images acquired at 16.9 Mcps. Looking at the corresponding NEC for these sinograms, we find that it peaks at the 16.9-Mcps singles rate and then starts decreasing at higher rates due to an increased randoms fraction.
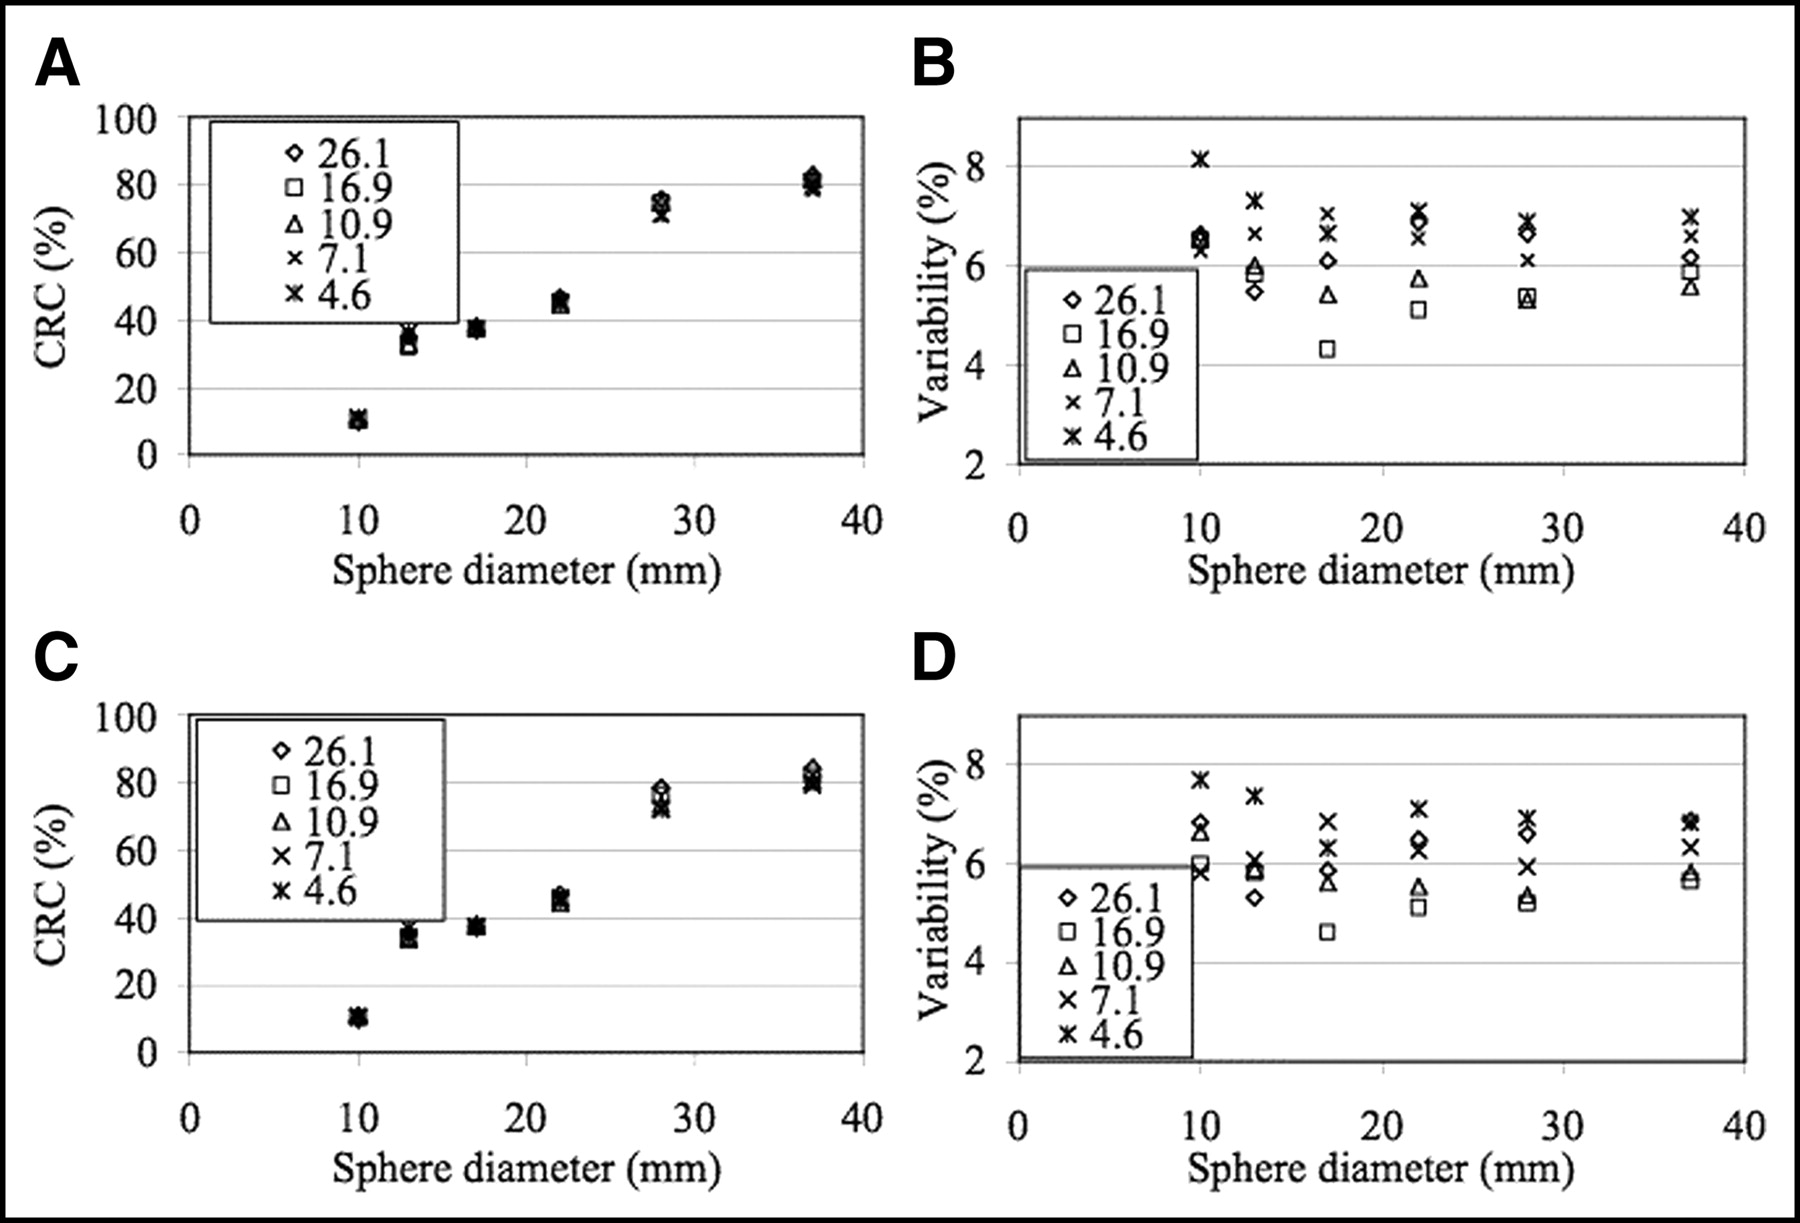
CRC (A and C) and variability (B and D) for image-quality torso phantom for varying singles rates (Mcps). Two rows represent 2 different ways of performing randoms corrections. Top row is after direct randoms subtraction of delays data, whereas bottom row is after subtraction of Casey-averaged delays data. For scatter correction, SSS was performed.
Patient Study
Figure 8A shows transverse, sagittal, and coronal views of selected slices from a 55-kg patient study. These images, reconstructed after subtraction of smoothed randoms (using Casey averaging) and scatter (using SSS), show the high image contrast and spatial resolution achieved by Allegro in average-size patients, leading to good visual quality in routine clinical scans. This particular patient image showed a lesion in the liver as well as abnormal uptake in the thorax (coronal slices 334 and 358, second and third images in the bottom row). Figure 8B is a set of representative slices from a reconstructed image of a heavy patient (100 kg). This patient was initially diagnosed with colon cancer, which is confirmed by the high uptake observed in the colon region (sagittal slice 295, third image in the middle row). Additionally, a liver lesion is visible in one of the coronal slices (coronal slice 346, third image in bottom row). The total collected counts were about 105 and 152 Mcts for the light and heavy patient, respectively. However, after randoms and scatter subtraction, the estimated trues counts in both images were ∼45 Mcts, indicating the larger fraction of scatter and randoms coincidences in the heavy patient.
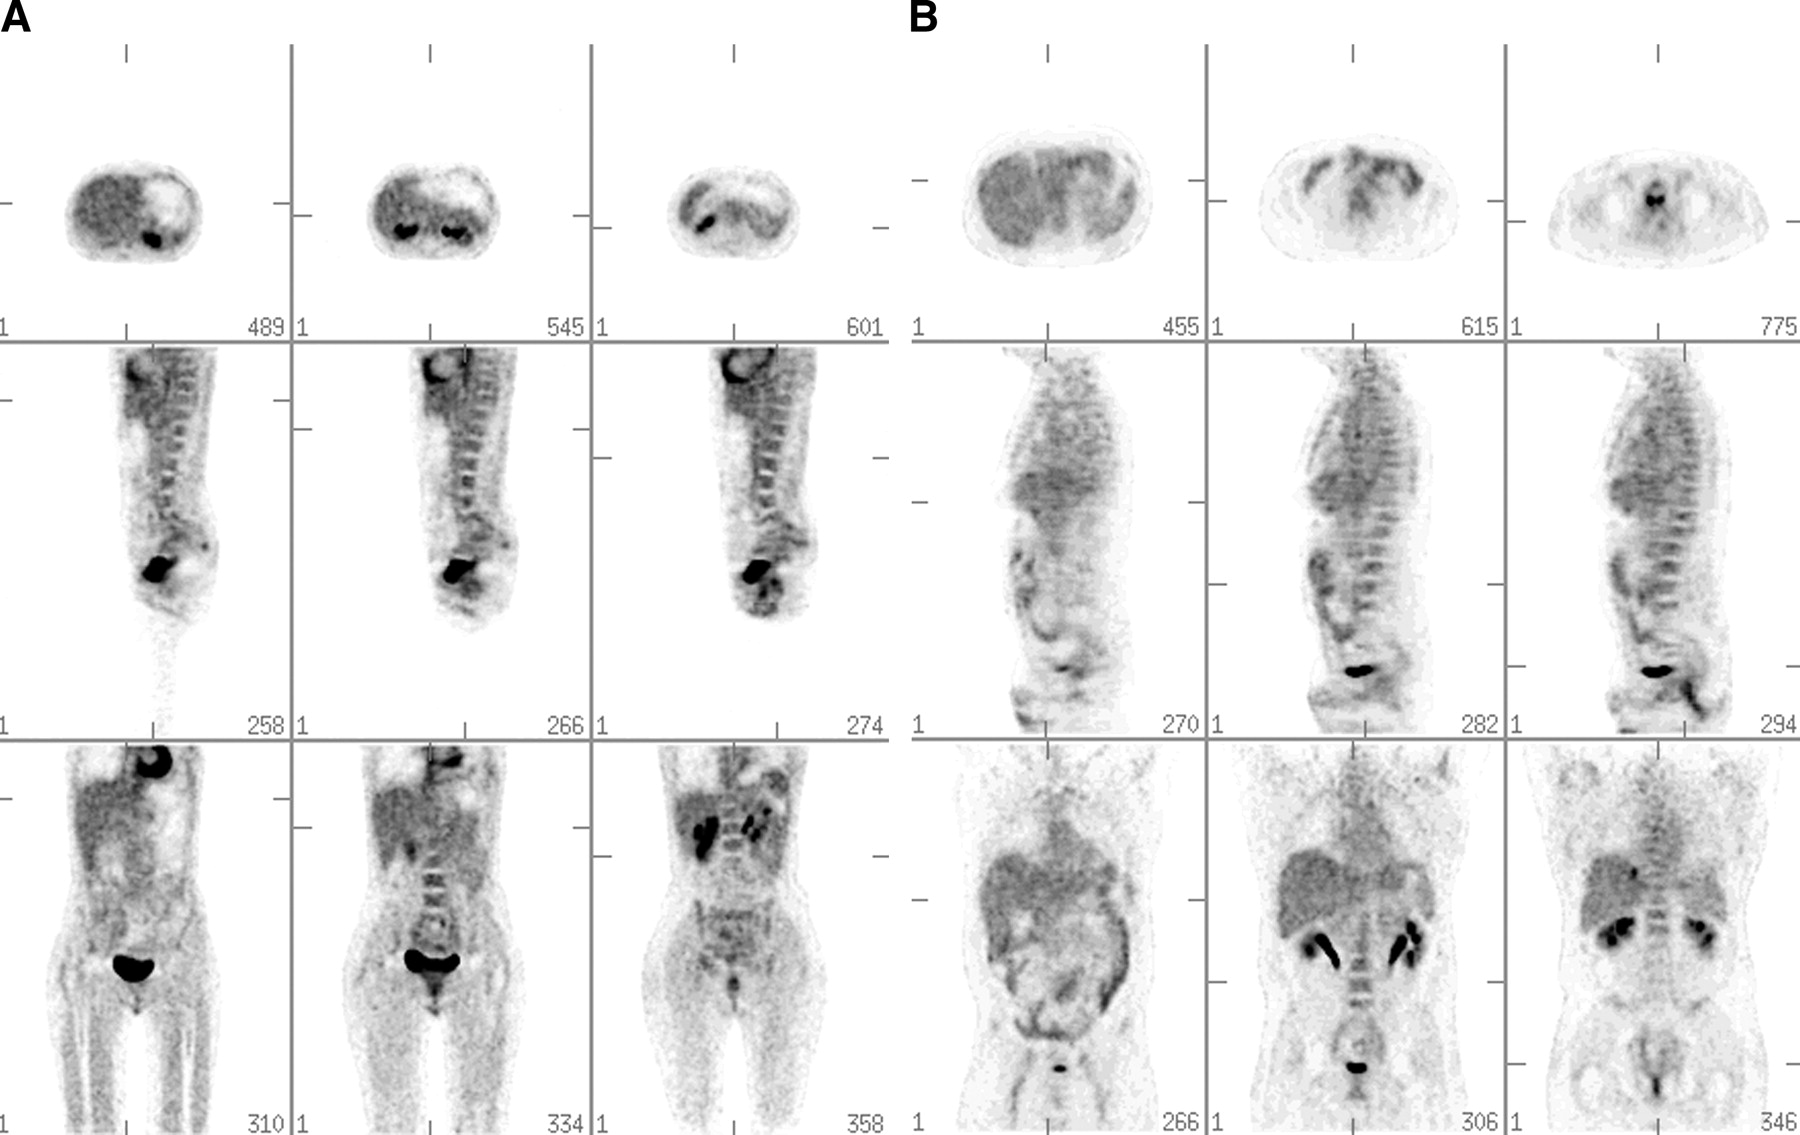
(A) Selected transverse, sagittal, and coronal slices from 18F-FDG study of 55-kg patient. Patient was scanned 60 min after injection. (B) Selected transverse, sagittal, and coronal slices from 18F-FDG study of 100-kg patient. Patient was scanned 60 min after injection.
DISCUSSION
The Philips Allegro scanner represents a new generation of PET cameras for clinical whole-body imaging that achieve high sensitivity and counting rate capability using 3D imaging and Anger detectors. The pixelated GSO Anger-logic detector helps achieve this by combining the high sensitivity and short decay time of GSO with a detector design that tunes the light spread to the size of the 7-PMT cluster while minimizing detector dead time, achieving good crystal discrimination, and uniform energy resolution.
Currently, the spatial resolution of the scanner is 5.5 mm with very little degradation at a radial position of 10 cm. The current technique of rebinning into 7 (clinical setup) or 15 tilts, as well as interpolation into uniform sinogram bins, leads to loss of some spatial resolution. Since the crystal pitch in the transverse direction is 4.3 mm, it may be possible to achieve better image resolution by reconstructing in the original line-of-response (LOR) space instead of interpolating the data to a uniform radial sampling as currently done. The iterative RAMLA algorithm is fundamentally amenable to such a technique and work is currently underway to evaluate reconstruction of the LOR data directly.
SF and NEC measurements with varying ELLD values indicate that there is some benefit to raising the lower energy gate above the current default value of 410 keV. With a system energy resolution of 19%, a higher ELLD value leads to a slight decrease in true sensitivity but also a decrease in the SF and an increase in the NEC. Our counting rate measurements for both the 20 × 70 cm and 35 × 70 cm line phantoms show small improvements in the measured peak NEC value with optimized ELLD value. However, to practically implement the higher energy threshold clinically, a careful investigation of the energy peak stability needs to be performed first. Possible fluctuations in the centroid position in daily operations would otherwise lead to significant changes in the scanner sensitivity. For both phantoms, the maximum NEC occurs where the randoms rate equals the trues, indicating that the NEC peak activity is not limited by the scanner dead time, a common problem in the older NaI(Tl) Anger detector–based PET scanners (4,22–24). However, there is pulse pileup and dead time in the detector, which limits the maximum NEC value achieved by the scanner. The absolute activity level where the NEC starts to level off is ∼370 MBq (10 mCi) for both the 20 × 70 cm and the 35 × 70 cm phantoms. Our current clinical practice is to keep the injected activity per kilogram constant for the patients. However, our results here show that we may want to change our imaging protocols by keeping the total injected activity constant, irrespective of the patient weight.
The peak NEC value of 30 kcps (or 32 kcps with a higher ELLD) for Allegro with the 20 × 70 cm phantom is close to the peak NEC achieved by the Advance (General Electric Medical Systems) and ECAT HR+ (Siemens-CTI), both of which are well represented in major PET clinics and medical centers. The respective peak NEC values for the Advance and HR+ in 3D acquisition mode are 33 and 38 kcps, respectively (25).
Our NEC measurements with the 35 × 70 cm line phantom (simulates a 136.2-kg [300 lb] patient) are significant in that they indicate the large degradation (factor of 6 in NEC) in image quality expected (and routinely observed) for heavy patients. This degradation arises due to a larger randoms and scatter contribution to the acquired data when compared with the true counts that have increased attenuation. It should be mentioned, however, that the assembly of this phantom with the line source placed at 4.5-cm radial position does not represent the average performance of a uniform cylinder of the same size. This line source position was appropriate to simulate the SF in a uniform 20 × 70 cm cylinder. However, our Monte Carlo simulations indicate that to reproduce the SF in a 35 × 70 cm uniform cylinder, the line source should be placed at 15 cm radially leading to a SF of 49%, as opposed to the currently measured 61%. The higher SF relative to the 20 × 70 cm cylinder will therefore still lead to a reduction in the NEC rate for the large phantom. Since the 20 × 70 cm line source phantom better simulates a slim 45.4-kg (100 lb) patient, we think that this larger phantom shows the limitation of 3D whole-body PET scanners when imaging heavy patients with increased scatter. Good system energy resolution should therefore lead to a reduced degradation of image quality in heavy patients, due to better scatter and randoms rejection achieved by using a tight energy window around photopeak events.
Our measurements with the image-quality phantom show that Allegro achieves good contrast and noise characteristics using a 3-min emission acquisition time per bed position. A typical whole-body scan comprises 7 bed positions leading to a total emission scan time of 21 min. An additional 3 min for the 9 interleaved transmission scans leads to a total scan time of <30 min. Our measurements indicate improvement in the contrast recovery especially for the cold spheres when using the SSS to estimate scatter. Randoms smoothing, however, does not show any improvement in noise characteristics over direct subtraction even at very high singles rates. The small loss in the image contrast recovery at high rates indicates some pulse pileup effect in the scanner. However, the variability decreases for the higher counting rate data. This is expected since the absolute collected counts increase at the higher rate for a fixed acquisition time. The reduced variability or noise at high rates will be helpful in the imaging of compounds labeled with short-lived radioisotopes such as 11C, where a large amount of activity is injected in the patient. These results do not contradict the NEC curves shown in Figure 2, which tend to plateau at the maximum value and stay flat for a reasonable activity range.
CONCLUSION
The Allegro whole-body scanner represents a new generation of 3D, high-sensitivity, and high-performance PET cameras capable of producing very high quality images in <30 min for a full patient scan. The spatial resolution of this is scanner is 5.5 mm as measured by NEMA NU 2-2001 analysis (2), and it has an absolute sensitivity of 4.36 cps/kBq. The use of a pixelated GSO Anger-logic detector leads to a high-sensitivity scanner design with good counting rate capability due to reduced light spread in the detector and the fast decay time of GSO. The light collection over the detector is fairly uniform, leading to a good energy resolution and, thus, reduced scatter in the collected data due to a tight energy gate. Our image-quality measurements show that the small 10-cm sphere is easily detectable and image contrast does not degrade at activity levels higher than the current clinical value (∼370 MBq [10 mCi]), a property that is beneficial in the imaging of compounds labeled with short-lived radioisotopes. Counting rate measurements with the 20 × 70 cm line source phantom show a peak NEC of 30 kcps at a point where random coincidences start to dominate. However, to better predict imaging of heavy patients, we compare a 35 × 70 cm line source phantom to the standard 20 × 70 cm phantom and observe a factor of 6 decrease in the peak NEC. The data from the 20 × 19 cm uniform cylinder show that higher counting rate capability can be achieved for brain imaging situations where large activity levels may be injected in the patient.
Acknowledgments
We thank Dr. Gerd Muehllehner, Michael Geagan, and the engineering team at Philips Medical Systems, Philadelphia, for their technical and scientific help with this work. Also, input from Matthew Werner (University of Pennsylvania), Christopher Cardi (University of Pennsylvania), Dr. Margaret Daube-Witherspoon (University of Pennsylvania), Dr. Lars-Eric Adam (University of Pennsylvania), Dr. Roberto Accorsi (Children’s Hospital of Philadelphia), Dr. Samuel Matej (University of Pennsylvania), and Dr. David Sebok (Philips Medical Systems, Philadelphia) in various aspects of these measurements and analysis was beneficial in the completion of this work. This work was supported by U.S. Department of Energy grant DE-FG02-88ER60642.
Footnotes
Received Sep. 30, 2003; revision accepted Jan. 13, 2004.
For correspondence or reprints contact: Suleman Surti, PhD, Department of Radiology, Hospital of the University of Pennsylvania, 110 Donner Building, 3400 Spruce St., Philadelphia, PA 19104.
E-mail: surti{at}rad.upenn.edu
REFERENCES
In this issue


Jump to section
Related Articles
Cited By...
- Improved Dose Regimen in Pediatric PET
- Optimization of the Injected Activity in Dynamic 3D PET: A Generalized Approach Using Patient-Specific NECs as Demonstrated by a Series of 15O-H2O Scans
- Amyloid load in Parkinson's disease dementia and Lewy body dementia measured with [11C]PIB positron emission tomography
- PET/CT of Skull Base Meningiomas Using 2-18F-Fluoro-L-Tyrosine: Initial Report
- Performance of Philips Gemini TF PET/CT Scanner with Special Consideration for Its Time-of-Flight Imaging Capabilities
- NEMA NU 2-2001 Performance Measurements of an LYSO-Based PET/CT System in 2D and 3D Acquisition Modes
- Performance Characteristics of a New 3-Dimensional Continuous-Emission and Spiral-Transmission High-Sensitivity and High-Resolution PET Camera Evaluated with the NEMA NU 2-2001 Standard
- Performance Characteristics Obtained for a New 3-Dimensional Lutetium Oxyorthosilicate-Based Whole-Body PET/CT Scanner with the National Electrical Manufacturers Association NU 2-2001 Standard
- Why Is the Resolution of the Discovery PET/CT Camera So Poor?