


Abstract
Misregistration between attenuation and emission images causes artifactual abnormalities on cardiac PET images that result in false-positive defects. This study determines the frequency and mechanisms of misregistration artifacts, identifies their predictors, and validates a method for their routine clinical identification, prevention, or correction. Methods: We performed 1,177 consecutive diagnostic myocardial perfusion PET studies using 1 of 3 protocols: (a) 3 initial consecutive measured attenuation correction (MAC) scans, followed by resting and dipyridamole emission scans; (b) an initial MAC scan (early MAC), followed by emission scans; and (c) a MAC attenuation scan obtained after emission scans (late MAC). Emission images were manually shifted to obtain coregistration with attenuation and reconstructed again using shifted emission data that eliminated artifactual defects. Measurements on PET images included heart size, heart and diaphragm displacement after dipyridamole, objective quantitative misregistration of attenuation and emission images, and size or severity of image defects before and after shifting emission images. Results: Of 1,177 rest-dipyridamole PET perfusion studies, 252 (21.4%) had artifactual defects due to attenuation–emission misregistration. By shifting emission images, quantitative severity and size of misregistration and artifactual defects significantly decreased (P < 0.001) with visual normalization. Artifactual defects were predicted by horizontal plane misregistration (odds ratio [OR] = 1.545, confidence intervals [CI] = 1.113–2.145, P = 0.009), body mass index (OR = 2.659, CI = 1.032–6.855, P = 0.043), and whole heart area in the horizontal plane at rest (OR = 1.096, CI = 1.018–1.179, P = 0.015). Quantitative misregistration was predicted by diaphragm displacement between rest and dipyridamole (P = 0.001, CI = 0.158–0.630), body mass index (P = 0.005, CI = 0.202–1.124), and whole heart area in the horizontal plane at rest (P = 0.004, CI = −0.144 to −0.028). Diaphragm displacement was significantly larger for obese compared with lean patients (P = 0.027) during the initial 10 min of the imaging protocol. Conclusion: Misregistration of attenuation and emission images is common in cardiac PET imaging and causes artifactual defects predicted by diaphragmatic displacement, body mass index, and heart size. Multiattenuation imaging sequences and manual, visually optimized coregistration of attenuation and emission images substantially eliminate artifacts for reliably identifying mild perfusion defects of early nonobstructive coronary atherosclerosis as the basis for intense lifestyle and pharmacologic treatment.
Myocardial perfusion PET at rest and with pharmacologic stress identifies flow-limiting coronary artery stenoses as regional perfusion defects (1–4). Cardiac PET also demonstrates mild reductions in coronary flow reserve (CFR) that indicate early nonobstructive or diffuse coronary artery disease (CAD) as the basis for life-long treatment before significant stenoses develop (3–6). Early detection of nonobstructive CAD by PET perfusion imaging requires accurate, reliable differentiation of small regional differences in relative CFR (7,8). However, misregistration of the attenuation and emission images may cause artifactual abnormalities on PET images that are false-positive defects (9–11). When compared with a precise myocardial perfusion map (2,4), we have observed that artifactual defects on PET perfusion images due to attenuation–emission misregistration typically (a) do not correspond to any of the coronary distribution territories, (b) are associated with visual and quantifiable misregistration of superimposed attenuation and emission images, and (c) disappear when corrected by manually shifting the emission image over the attenuation image to achieve optimal superimposition and coregistration. With repeated reconstruction of the shifted emission data, the emission images normalize in the area of a previous defect corresponding to the area of prior misregistration.
Therefore, the purpose of this study was to determine the frequency of attenuation–emission misregistration artifacts in cardiac PET perfusion imaging, to document the responsible mechanisms, to identify predictors of misregistration artifacts, and to validate their routine clinical identification, prevention, or correction.
Although there is a substantial literature on technical aspects of PET scanner performance regarding image reconstruction (12,13), registration (14–22), and 3-dimensional (3D) imaging (17,18,21,23), this report is, to our knowledge, the first to describe the dynamic changes in the attenuating structures of lungs, heart, and diaphragm from rest to pharmacologic stress that may cause significant artifactual defects due to misregistration of attenuation and emission images unless recognized and corrected for each patient. Consequently, our study is important for extending the limits to which cardiac PET perfusion imaging can be used for detecting mild differences in regional CFR or the base-to-apex longitudinal perfusion gradient indicating early CAD as the basis for lifelong lifestyle and medical treatment or for changes in perfusion as a guide to treatment (1,2,6–8).
MATERIALS AND METHODS
Study Patients
Between May 2000 and July 2003, a total of 1,177 consecutive diagnostic myocardial perfusion rest-dipyridamole PET studies were performed at the University of Texas Weatherhead PET Center for Preventing and Reversing Atherosclerosis. An additional 45 patients underwent cardiac PET imaging with 3 sequential resting attenuation scans to assess diaphragmatic changes on assuming the supine position. All subjects signed informed consent approved by the Committee for the Protection of Human Subjects of the University of Texas Health Science Center, Houston.
PET Imaging
Patients were instructed to fast for 4 h and abstain from caffeine, theophylline, and cigarettes for 24 h before study. As previously described (4–6,8), PET imaging was performed using the University of Texas–designed, Positron Posicam Auricle, bismuth germanate, 2-dimensional (2D) multislice tomograph with a reconstructed resolution of 10-mm full width at half maximum (FWHM). Based on a 5-min positioning transmission scan, patients were precisely positioned in the PET scanner with the first image plane 1 cm below the radiolucent bronchial carina on the positioning transmission scan. Laser guides aligned to external body markers were used to check correct position at least 3 times throughout data acquisition with adjustments before each image acquisition to maintain precise alignment according to the external body markers.
Using a rotating rod source containing 148–185 MBq (4–5 mCi) of 68Ge, transmission images to correct for photon attenuation contained 100–150 million counts; the transmission scan image is also called the attenuation image in this article. Emission images obtained after intravenous injection of 925 MBq to 2.22 GBq (25–60 mCi) of generator-produced 82Rb contained 40–60 million counts or after 666 MBq (18 mCi) of cyclotron-produced 13N contained 20–40 million counts.
Immediately after completing resting 82Rb or 30 min after administration of the first dose of ammonia, dipyridamole (0.142 mg/kg/min) was infused for 4 min. At 4 min after completion of the dipyridamole infusion, the same dose of the same radionuclide was given intravenously. For 82Rb, imaging data acquisition was started at 60 s (normally) to 90 s (for patients with heart failure or cardiac enlargement) after the beginning of 82Rb infusion. For 13N-ammonia, imaging data acquisition was started at 4 min after injection to allow blood-pool clearing needed for lung washout of 13N-ammonia. PET imaging was repeated by the same protocol as for the resting study. For angina, aminophylline (125 mg) was given intravenously.
Automated Quantitative Analysis of PET Images
Images were reconstructed using filtered backprojection with a Butterworth filter having a cutoff of 0.4 and roll off of 10. Completely automated analysis of severity and size of PET abnormalities was performed by previously described software (1–8). A 3D restructuring algorithm generates true short- and long-axis views from PET transaxial cardiac images, perpendicular to and parallel to the long axis of the left ventricle. From the tomographic data acquired in 2D mode to minimize scatter, circumferential profiles are used to reconstruct 3D topographic views of the left ventricle showing relative regional activity distribution divided into lateral, inferior, septal, and anterior quadrant views of the 3D topographic display corresponding to the coronary arteries as previously described (3–8) and illustrated in Figure 1A.

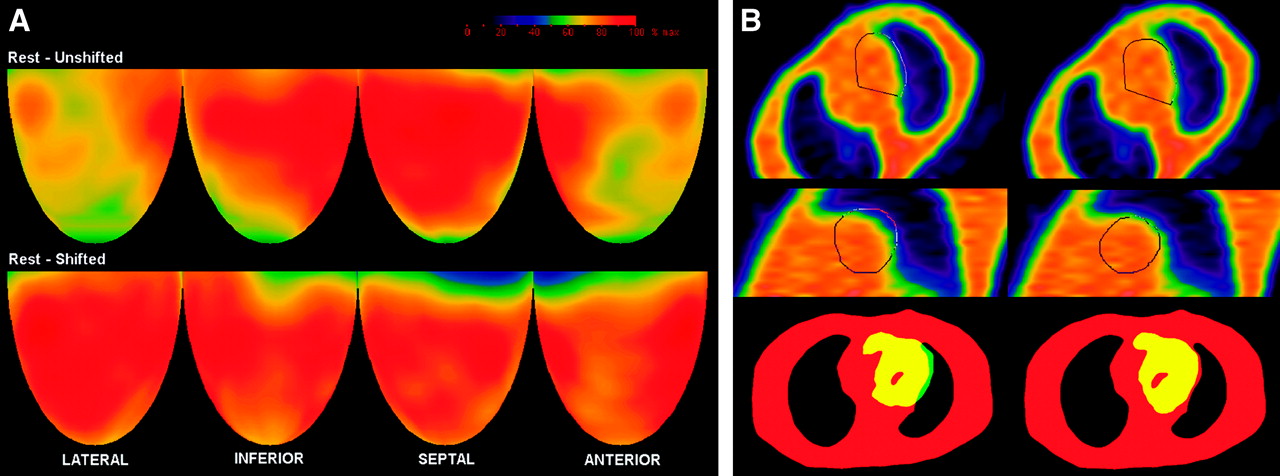
Severe rest perfusion defect. (A) Topographic display. Top panel shows topographic display of unshifted images with artifactual defect due to misregistration of emission and attenuation data. Middle panel shows topographic display of same patient after shifting emission images for optimal coregistration with attenuation image. Bottom panel shows our myocardial perfusion map relating 3D quadrant views of PET images to arterographic anatomy from (4). RI = ramus intermedius; OM1 = first obtuse marginal branch; OM2 = second obtuse marginal branch; LCx = left circumflex artery; D1 = first diagonal branch; D2 = second diagonal branch; RCA = right coronary artery; LAD = left anterior descending (artery). (B) Quantitative analysis of misregistration. Top panel shows rotated transmission images in scanner horizontal longitudinal section before shifting (left) and after shifting emission data (right) with superimposed outline of emission image in same tomographic slice using same rotation angles. Middle panel shows rotated transmission images in scanner vertical longitudinal section before shifting (left) and after shifting emission data (right) with superimposed outline of emission image in same tomographic slice using same rotation angles. Bottom panel shows transmission images (red color) in in-plane acquisition tomographic view using shift software with emission image superimposed (yellow color) before (left) and after shifting emission images (right) showing misregistration area (green) between emission and transmission images.
Mean activity in each quadrant is normalized to the maximum 2% of pixels in the whole heart dataset. Regions of each quadrant are identified having values outside 97.5% confidence intervals (CI) or 2.5 SDs outside normal values of 18 healthy volunteers with no risk factors by complete medical history (no hypercholesterolemia, hypertension, diabetes, smoking, obesity, drug or alcohol abuse, other systemic diseases, or family history of CAD) and the percentage circumferential profile units outside 97.5% CI calculated automatically.
Misregistration Artifacts
Misregistration artifacts were defined qualitatively and quantitatively as (a) abnormalities or defects on perfusion images that did not correspond to any of the coronary artery distribution territories in comparison with our previously reported precise myocardial perfusion map (4); (b) the area of the abnormality on the PET image that was associated with a corresponding area of misregistration of the transmission and emission scans when superimposed; and (c) the defects disappeared and the image normalized when the emission images were shifted to superimpose them precisely on the attenuation images and reconstructed again using the shifted emission data. Healthy control subjects were asymptomatic volunteers with normal rest and stress perfusion images and no risk factors for CAD.
Image Analysis Protocols
To determine the causes or mechanisms of misregistration producing image artifacts, 3 different attenuation-rest-stress imaging protocols were studied.
Protocol 1.
Protocol 1 consisted of 3 consecutive measured attenuation correction scans (MAC), with the first 2 scans obtained successively over 10 min each, followed by a third attenuation scan obtained over 20 min, followed by resting and dipyridamole emission scans.
Protocol 2.
Protocol 2 consisted of a measured attenuation correction scan obtained over 20 min at the beginning of the imaging sequence (early MAC), followed by resting emission and dipyridamole emission scans.
Protocol 3.
Protocol 3 consisted of a MAC attenuation scan obtained over 20 min at the end of the imaging sequence (late MAC) after resting and dipyridamole emission scans. In this later protocol, in addition to the late MAC attenuation image, 5-min segmented attenuation scans (SAC) were obtained before the resting emission scan (rest SAC) and immediately after the dipyridamole emission scan (stress SAC) just before the late MAC attenuation image.
Quantitative Measurements of Misregistration on PET Scans
The following objective quantitative measurements were made: (i) heart size; (ii) vertical and lateral heart displacement at rest compared with dipyridamole stress; (iii) diaphragm displacement between the initial attenuation scans and between rest and dipyridamole; (iv) size of misregistration of the attenuation and emission images expressed as the percentage of the emission heart area outside the heart contour superimposed on the attenuation image in the horizontal plane; and (v) amount of shifting of the emission image in centimeters that was required to correctly superimpose the attenuation and emission images sufficient to make the artifactual defect disappear (normalize) in the area of prior misregistration on repeated reconstruction using shifted emission data.
These endpoints are listed in a numbered sequence for conceptual clarity. However, for efficiency in image processing and making the measurements, these objective quantitative measurements were mechanically made in detail in a different lettered sequence as follows:
Heart displacement in protocols 2 and 3 between rest and stress images was measured by identifying the scanner’s in-plane acquisition tomographic view before rotation showing the uppermost superior border of the heart where each plane has a 5.125-mm slice thickness and a 5.125-mm center-to-center separation.
Left diaphragm dome displacement between the 3 initial attenuation scans in protocol 1 and between rest, stress, and late MAC in protocols 2 and 3 was measured by placing the cursor at the top of the right diaphragmatic dome position in the 3-plane display (scanner’s vertical in-plane, vertical, and horizontal longitudinal cuts) of the acquisition tomographic views, before rotation with readout of the cursor position in the x-, y-, and z-planes. Diaphragm motion could not be determined for protocol 2 (early MAC) in the absence of successive rest and stress SAC attenuation images.
Quantifying the misregistration area between attenuation and rest and stress emission images was done for protocols 2 and 3 in the 3-plane display of the acquisition tomographic view as follows. Rotation angles were copied from the rest and stress images onto the attenuation image and the attenuation image was rotated exactly the same as the emission images. Emission rest and stress images were thereby superimposed over the attenuation image as originally acquired in exactly the same orientation. To more tightly define the borders of the attenuation image, a 50% cutoff threshold was used for all attenuation images compared with a 30% cutoff threshold for the emission images. Misregistration was defined as the area of the heart on rest or stress emission images that was outside the heart contour on the attenuation image (Figs. 1B, 2B, 3B, and 4B). The misregistration area and the whole heart area were manually outlined with a region-of-interest program that automatically measured the absolute pixel counts of each area. The ratio between the misregistration area and the whole heart area was calculated and expressed as the percentage of the emission heart image outside the attenuation heart image. The whole heart area and misregistration areas were measured twice by the same operator with an intraobserver variability of ≤250 pixels. Misregistration areas of <250 pixels were not considered significant. The heart and misregistration areas were expressed in square centimeters calculated from the reconstructed image pixel resolution of 1.7 × 1.7 mm.
Images with misregistration artifacts were displayed in the acquisition tomographic in-plane views using the shift software (Figs. 1B, 2B, 3B, and 4B). The emission images (either rest or stress) were manually shifted in the x- and y-coordinates of the in-plane acquisition view over the attenuation image to achieve visually optimal superposition and proper coregistration of the free lateral heart wall.
Completely automated analysis of the artifactual image defect size and severity as previously reported (2–8) and briefly described here was obtained before and after manual shifting of the emission images in the shift view and before correction of the misregistration by repeated image reconstruction.

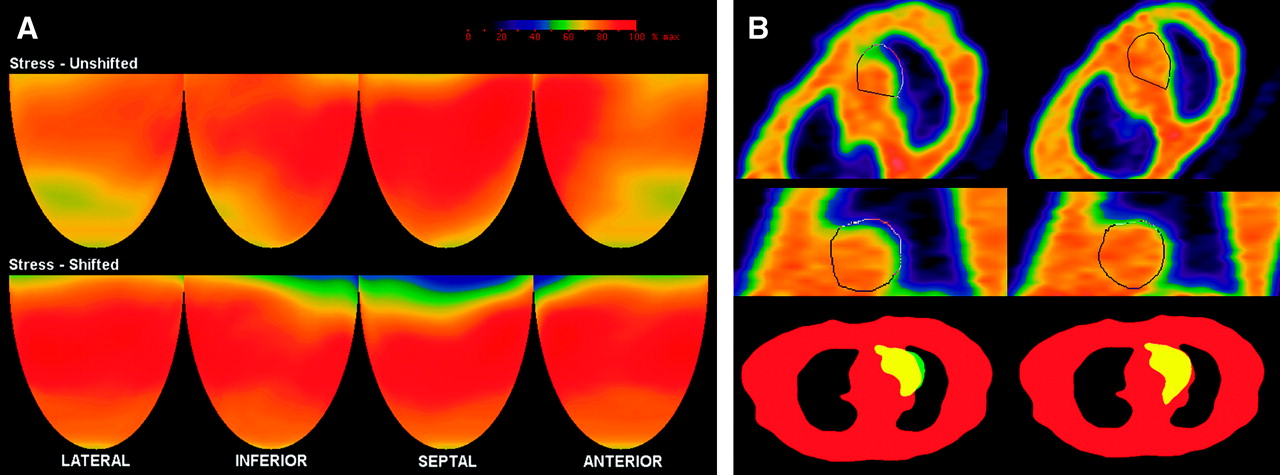
Severe stress perfusion defect. Legend is the same as Figure 1.

Moderate rest perfusion defect. Legend is the same as Figure 1.

Mild stress perfusion defect. Legend is the same as Figure 1.
Severity of an image defect was quantified as the lowest quadrant average relative activity—that is, average relative activity for the quadrant having the lowest average activity of anterior, septal, lateral, and inferior quadrants. For all patients, the most common, typical, and severe misregistration artifacts were observed in the anterolateral or lateral area of the left ventricle.
Combined size and severity of perfusion defects were defined as the percentage of cardiac image with relative activity of <60% of maximum activity that is 3 SDs below the mean maximum activity of healthy control subjects. The apical quadrant was not included. This measure of perfusion defect severity has been a highly reproducible endpoint with a narrow SD that sensitively quantifies perfusion defects and changes among sequential PET scans with high statistical significance (2–8).
To determine the mechanisms underlying the attenuation and emission misregistration artifacts, a detailed analysis was performed in a subset of 54 patients from the early MAC protocol and in a subset of 55 patients from the late MAC protocol, all with characteristic, definite, and comparable misregistration artifacts. A group of 18 healthy volunteer control subjects imaged using the late MAC protocol was also analyzed. Since protocol 3 (late MAC) had rest SAC, stress SAC, and late MAC attenuation images, a more complete analysis of the mechanisms underlying misregistration of emission images and attenuation was obtained in this group. Additionally, precise measurement of diaphragm motion was obtained using protocol 1 in a group consisting of 45 randomly selected patients, divided in 3 equal groups based on their body mass index (BMI).
Statistical Analysis
All statistical analyses were performed using SPSS version 11.5 (SPSS Inc.). Data are reported as mean ± 1 SD or SEM. Differences among the means of continuous variables for patients and the healthy control group were analyzed with an independent samples, 2-tailed t test using the Levene test for equality of variances. ANOVA was performed for significance of variance with the Games–Howell post hoc test for unequal variances. Pearson bivariate correlation coefficients were calculated. Single stepwise multivariate linear regression analysis was performed to identify predictors for the quantitative degree of misregistration. Multivariate logistic regression analysis was performed to identify predictors for the presence or absence of misregistration artifacts in nonshifted images. A 2-tailed P value of <0.05 was considered statistically significant.
RESULTS
Of the total 1,177 cardiac studies, 252 (21%) had artifactual defects due to misregistration of attenuation and emission images, all corrected by manually shifting the emission images to achieve precise coregistration and reconstructing the emission images with shifted data. Using the resting attenuation of the early, resting MAC protocol (protocol 2), a total of 450 cardiac PET studies were obtained with 138 misregistration artifacts (31%). Using the postdipyridamole attenuation of the late MAC protocol (protocol 3), a total of 727 cardiac PET studies were obtained with 114 misregistration artifacts (16%) observed; this difference in frequency of misregistration artifacts between the early MAC and late MAC protocols was statistically significant (P < 0.001). For patients with both rest and stress defects, we picked the quantitatively worst defect based on the quantitative statistical display of each patient and classified that patient as having either rest or stress artifact, but no patient was counted twice in calculating these percentages.
To obtain additional mechanistic insights, we also examined the frequency of misregistration artifacts on resting compared with the dipyridamole images in each of these protocols. Artifactual defects on resting emission images were significantly more frequent using the postdipyridamole attenuation of the late MAC protocol (44/55 [80%]) than that using the resting attenuation of the early MAC protocol (25/54 [46%]), a significant difference with P = 0.02. Artifactual defects on stress emission images using the resting attenuation of the early MAC protocol (29/54 [54%]) were significantly more frequent than that using the postdipyridamole attenuation of the late MAC protocol (11/55 [20%]), a significant difference with P = 0.003.
Figure 1A illustrates a severe defect on the resting perfusion scan that normalized after shifting the emission image to precisely superimpose it on the attenuation scan and reconstructing the image using the shifted data. Figure 1B left upper panels show the outline of the heart from the emission image superimposed on the attenuation image with a large area outside the heart border on the attenuation image in vertical and horizontal views. Figure 1B right upper panels show the same views and outline of the heart after shifting the emission image to obtain correct coregistration. The bottom panel shows the scanner in-plane acquisition shift view of the heart emission image superimposed on the attenuation image before (left) and after (right) shifting the emission image to achieve correct coregistration in routine clinical operations. Figures 2A and 2B illustrate a similar severe artifactual defect on a dipyridamole PET scan. Figures 3 and 4 illustrate milder artifactual defects on rest and dipyridamole images in a similar format to show the range of artifactual defects caused by attenuation–emission misregistration.
The baseline data for the late MAC subgroup are given in Table 1. The control group consisted of younger, leaner patients, with significantly less diaphragmatic motion and smaller hearts, differences that are important for analyzing the mechanisms of misregistration of the attenuation and emission images. Small degrees of misregistration were found in the healthy control group but significantly greater misregistration was measured in the patients (P < 0.001). Interestingly, downward heart displacement rest to dipyridamole was not significantly different between patients and control subjects (P = 0.210).
Characteristics of Late MAC Group with Rest SAC, Postdipyridamole SAC, and MAC Data
The effect of shifting emission images to correct the observed misregistration was substantial. Table 2 shows automated measurements of the severity and size of the artifacts before and after shifting to achieve optimal coregistration and re-reconstruction of the shifted emission images. In healthy subjects, the average quadrant relative activity value is 79% ± 6.8% with a value of 72% being outside 1 SD for healthy subjects and a value of 80% being within 1 SD.
Effects of Misregistration and Their Correction on Size and Severity of Image Defects
Shifting the emission images to correct attenuation–emission misregistration caused a significant increase in the lowest quadrant average activity (decrease in severity) in both the early and late MAC groups (P < 0.001 for the early MAC protocol and P < 0.001 for the late MAC protocol) corresponding to a visually apparent correction of the misregistration abnormality, as illustrated in Figures 1A, 2A, 3A, and 4A. In parallel with these quantitative and visual improvements, the combined size and severity of the defects quantified as the percentage of cardiac image with relative activity of <60% of maximum activity improved on the shifted emission images in both the early MAC group (P < 0.001) and the late MAC group (P < 0.001).
In Figures 1 through Figure 4, the rotated transmission images before shifting emission data for optimal coregistration are somewhat different than the rotated transmission images after shifting to optimize coregistration for the following reasons:
After shifting the emission images over the transmission images, there is a complete new software reconstruction of the emission images, including new rotation angles to produce cardiac short- and long-axis views of the shifted emission images. The same frame or slice number of the acquisition tomographic view on the shifted and nonshifted views was selected for analysis and for the illustrations. However, the postshift reconstructed emission images are in a different position within the attenuation image and required new angles of rotation. Therefore, these new postshift rotation angles copied to the transmission images caused different cuts through the attenuation image and therefore look different. Since the same frame number has slightly different cuts to produce the rotated attenuation views, nonshifted and shifted attenuation images are slightly different in appearance.
For illustrations, images have been grabbed from the display screen using a simple program that only allows a manual definition of the region of interest; although care has been given to define similar areas for the regions of interest, the grabbed images have been further processed offline to create the composite images (Figs. 1–4), resulting in different degrees of image magnification. This slightly differing magnification also accounts for some of the differences between the nonshifted and shifted images.
However, these differences in appearance of the rotated transmission images have no impact on measurements of the misregistration area since we have used the ratio between the misregistered area and the whole heart area, expressed as a percentage as illustrated in Tables 1 and 3.
Independent Predictors of Artifactual Defects in Late MAC Protocol Group
Since diaphragm motion could be measured from the rest SAC and dipyridamole SAC attenuation images in the late MAC group, further analysis was performed to identify the mechanisms of attenuation–emission misregistration and predictors of artifactual defects by multivariate stepwise logistic regression procedure, shown in Table 3. The strongest predictor of artifacts on the initial unshifted emission images is the presence and quantitative severity of misregistration of attenuation and emission images in the horizontal plane (odds ratio [OR] = 1.545, CI = 1.113–2.145, P = 0.009). The BMI is another predictor (OR = 2.659, CI = 1.032–6.855, P = 0.043), as well as the whole heart area in the horizontal plane at rest (OR = 1.096, CI = 1.018–1.179, P = 0.015). Diaphragm downward displacement after dipyridamole did not quite reach statistical significance as a predictor of artifacts on the initial unshifted emission images but was a good predictor of the area of misregistration on superimposed attenuation and emission images as detailed below. Moreover, diaphragm downward displacement from rest to dipyridamole may be substantial in some individuals as an obvious cause of misregistration artifacts.
Since attenuation–emission misregistration was the single most significant predictor of artifactual defects, multivariate stepwise linear regression analysis was used to identify predictors of misregistration, shown in Table 4. Diaphragm displacement between the rest and stress images is the strongest predictor of attenuation–emission misregistration (P = 0.001, CI = 0.158–0.630). BMI was also a good predictor of misregistration (P = 0.005, CI = 0.202–1.124). Surprisingly, small whole heart area in the horizontal plane at rest was a significant predictor of misregistration, suggesting that smaller hearts are more prone to attenuation–emission misregistration (P = 0.004, CI = −0.144 to −0.028). The Pearson correlation coefficient between the whole heart area and attenuation–emission misregistration in the horizontal plane was significant and negative (r = −0.554, P < 0.001), suggesting that larger hearts are expected to have less misregistration and smaller hearts more misregistration.
Independent Predictors of Misregistration in Late MAC Protocol Group
To assess diaphragmatic motion in relation with BMI, a more detailed analysis was performed in an additional 45 patients studied with protocol 1. These patients were prospectively selected and categorized in 3 equal groups based on their BMI, as follows: ideal BMI (<24.9 kg/m2), overweight (25–29.9 kg/m2), and obese (≥30.0 kg/m2). Diaphragmatic displacement between each of the 3 initial resting sequential attenuation scans was measured. After assuming the supine position in the scanner, substantial upward diaphragm displacement occurred mostly between the first 2 attenuation scans over the initial 10 min with less upward displacement during the third attenuation scan, over a period of 20 min. The upward diaphragm displacement between the initial 2 resting attenuation scans for the obese group was significantly larger compared with that of the other weight groups (P = 0.027 and P = 0.041, respectively), shown in Table 5.
Diaphragm Motion Between First and Second Attenuation Scan (10-Minute Interval)
DISCUSSION
This study demonstrates that with current cardiac PET imaging protocols artifactual defects in emission images due to attenuation–emission misregistration are common but can be visually recognized, quantified, and individually corrected. When PET perfusion imaging is used for identifying mild abnormalities in relative CFR as a marker of early CAD, recognizing and correcting these misregistration artifacts is important clinically.
Correction of misregistration artifacts altered the PET report of virtually every patient in which such a correction was made in one or more of the following ways: (a) the final diagnosis in the PET report of early coronary atherosclerosis or equivalent description using other words such as “mild deposition of cholesterol in the coronary arteries consistent with age and risk factors” to avoid inappropriate insurance liability; (b) the extent or severity of coronary atherosclerosis in the PET report, for either diffuse disease based on the longitudinal base-to-apex perfusion gradient or severity of flow-limiting stenosis; and (c) the qualitative and quantitative assessment of changes in severity of perfusion changes on follow-up PET images as a guide to treatment or revascularization procedures.
The main independent predictors of artifactual defects in myocardial perfusion PET are (a) quantitative misregistration of attenuation and emission images both at rest and after dipyridamole, (b) heart size (area) in the horizontal plane at rest, and (c) the BMI. The single most significant predictor of attenuation–emission misregistration was downward diaphragm displacement after dipyridamole in addition to heart area and BMI. The fact that downward diaphragm displacement after dipyridamole strongly predicted attenuation–emission misregistration but did not reach statistical significance in predicting artifactual defects suggests that the downward diaphragm displacement interacts with other factors to cause misregistration artifactual defects. Misregistration of the attenuation and the emission images and the associated artifactual defects can be corrected by manually shifting the emission images over the attenuation image to achieve optimal coregistration of the cardiac free lateral wall and re-reconstructing the images using the shifted emission data.
Mechanisms Underlying Attenuation–Emission Misregistration
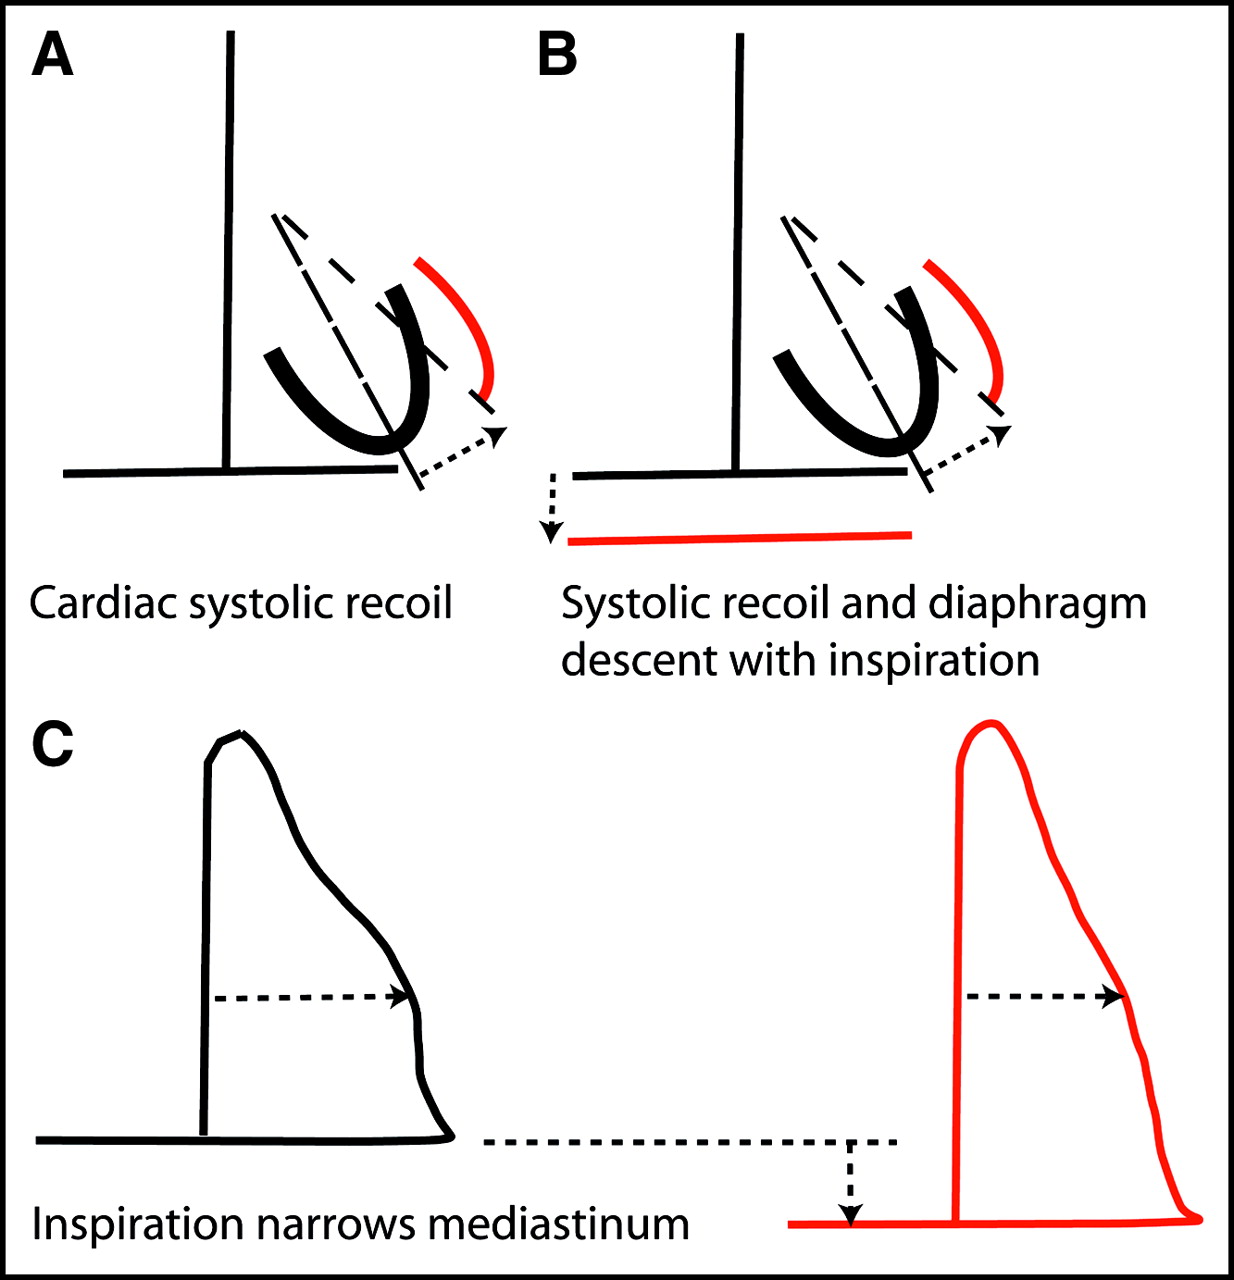
Our data can be explained by the following synthesis. Systolic contraction causes the root of the aorta and base of the heart to descend and the cardiac apex to recoil forward, up and to the left as in Figure 5, striking the inside of the chest wall where it is felt as an apical impulse. With tachycardia, the heart is in this recoil position for a longer time than that at resting heart rates. Therefore, during the interval of data acquisition for the dipyridamole PET image in which heart rate increases, the heart has a different average position during tachycardia as compared with the normal resting heart rate.

Normal cardiac and diaphragmatic motion. Black lines show left heart border during diastole and mediastinal outline during expiration. Red lines show changes in left heart border during systole and mediastinal outline during inspiration.
While standing, the diaphragm is at its lowest position and rises toward the heart on assuming the supine position. This upward repositioning of the diaphragm on assuming the supine position may be slow and plastic due to slow-moving abdominal contents toward the heart after lying supine, particularly with the weight of excess visceral fat, as suggested by our analysis of the consecutive initial resting attenuation scans in protocol 1.
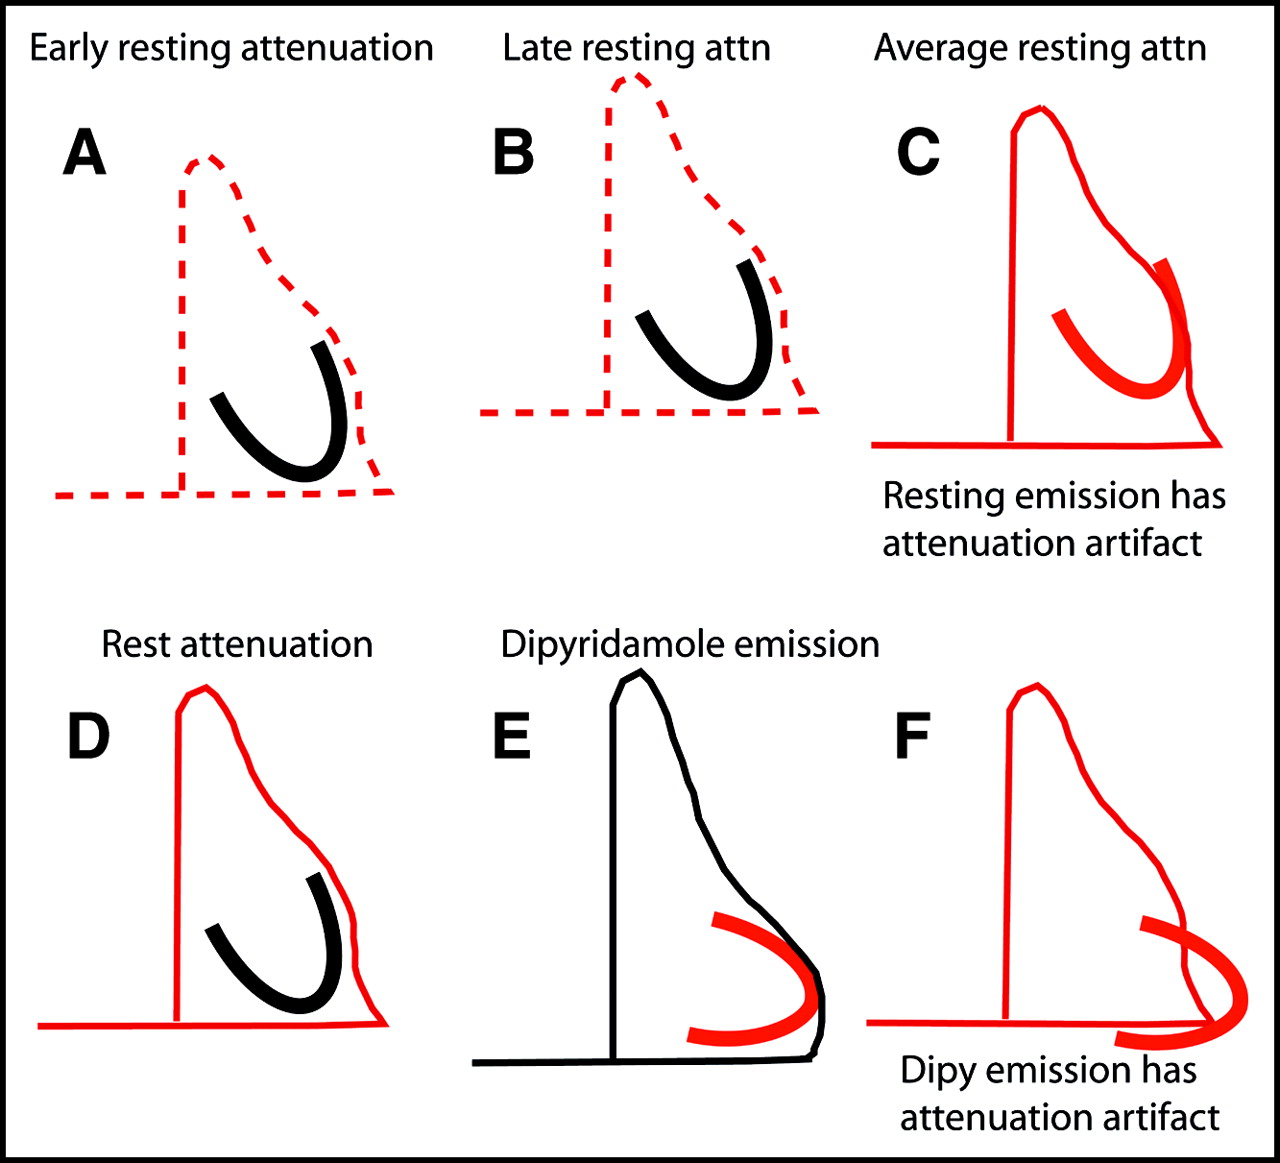
Dipyridamole typically causes a feeling of chest fullness and labored breathing associated with tachypnea so that the diaphragm is in a lower position for a longer time than that during normal slow breathing. As the diaphragm shifts inferiorly after dipyridamole, the mediastinum also narrows as illustrated in Figure 6E and Figure 7B.

Mechanisms for attenuation artifacts using resting attenuation scan. Red lines show positions of heart, mediastinum, and diaphragm during data acquisition; dashed red lines indicate mediastinum and diaphragm during standing and on first assuming supine position (left red dashed lines) and later in supine position after abdominal content shift cephalad (right red dashed lines). Black lines show positions of those structures not being imaged during attenuation or emission data acquisition of structures in red. Attn = attenuation; Dipy = dipyridamole.
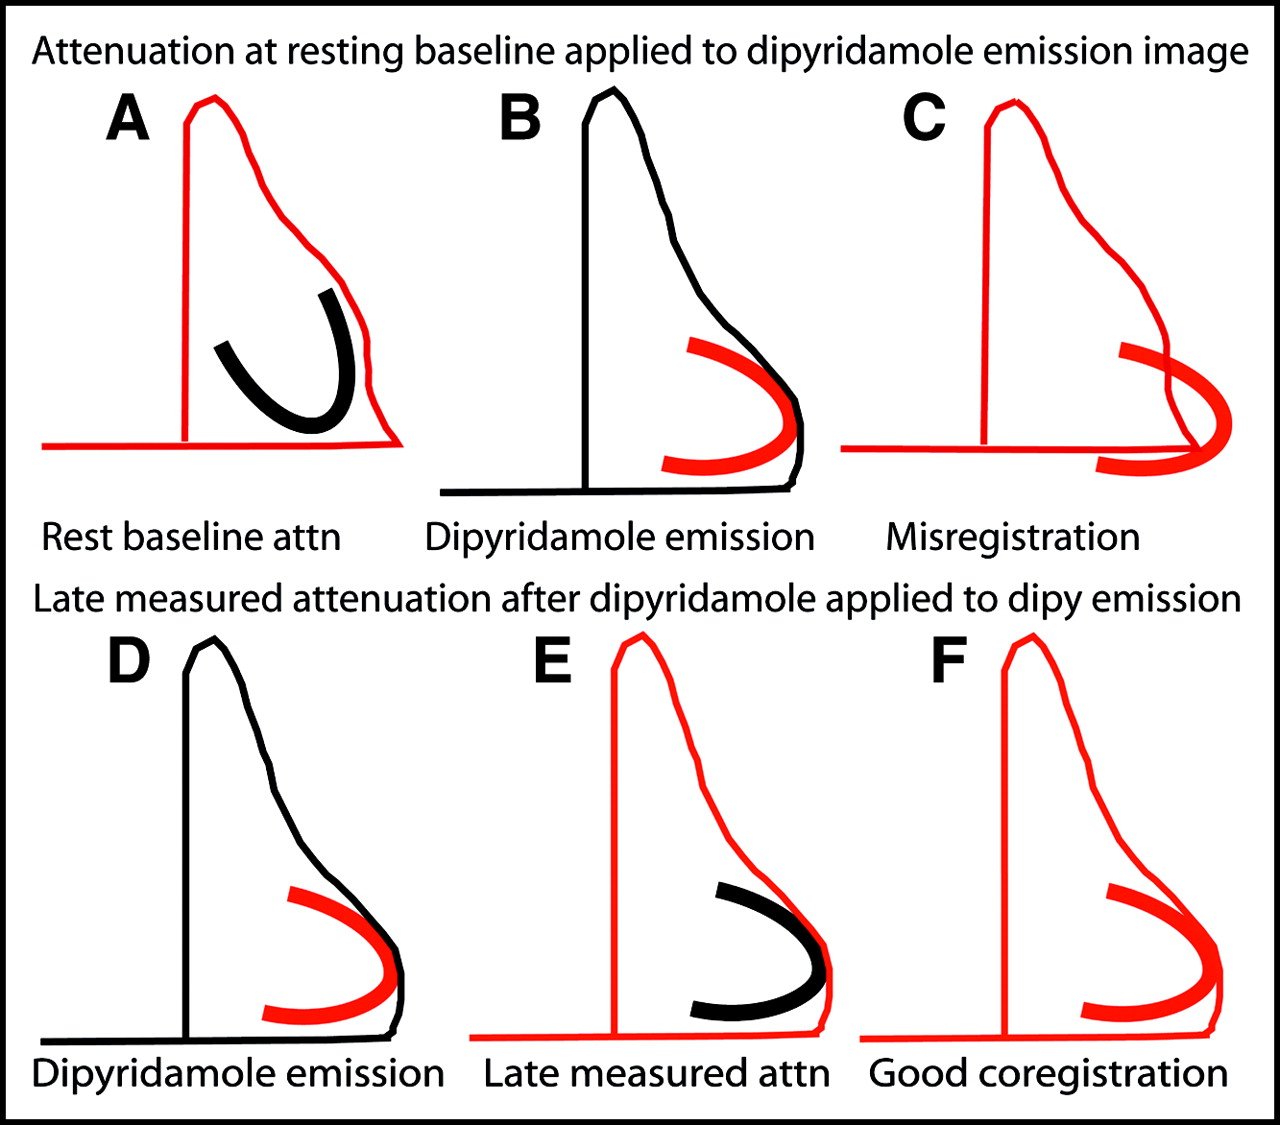
Mechanisms for attenuation artifacts using postdipyridamole scan. Legend is the same as Figure 6.
Therefore, the attenuating structures of the chest—lungs, left mediastinal border, heart, and diaphragm—undergo substantial slow plastic changes on assuming the supine position during resting and during dipyridamole imaging. Since the attenuation and emission data are acquired at different times during this complex sequence of slow plastic changes in the attenuation structures, attenuation–emission misregistration may occur (Figs. 6 and 7).
Using the early resting measured attenuation data for the dipyridamole emission image may cause misregistration as illustrated in Figure 6. Using the late measured attenuation after dipyridamole for the dipyridamole emission scan reduces misregistration artifacts in stress emission images since the attenuation structures best approximate those during stress emission image acquisition. However, using the late attenuation after dipyridamole for the resting emission scan may then cause attenuation–emission misregistration and artifactual defects in the rest emission scan, as illustrated in Figure 7.
The correlation between misregistration and BMI may be explained by several potential mechanisms. Greater BMI indicates more visceral fat having greater effects on the diaphragm position associated with greater attenuation–emission misregistration and more artifactual defects. In addition to these complex position changes, the amount of fat around the heart also has significant effects on attenuation–emission misregistration. In obese people, the fat around the heart causes the borders of the attenuation image to be bigger than the borders of the heart. Therefore, the left mediastinal border of the attenuation image extends farther leftward than the myocardium and thereby produces a “halo” of attenuation-corrected space around the heart that further complicates attenuation correction. The association of small hearts with more attenuation–emission misregistration is likely due to the relatively poor resolution of PET compared with small hearts such that even slight absolute misregistration causes a relatively large percentage of the heart to be misregistered.
Lateral cardiac recoil and diaphragmatic displacement have different effects on attenuation–emission superposition depending on whether the heart is positioned vertically as in thinner subjects or horizontally as in heavier people. For a horizontal heart as occurs in heavier people, recoil and diaphragm displacement tend to cause vertical misregistration with an anterolateral artifact, whereas in a vertical heart the artifact is more lateral. In thin people, misregistration artifacts are more likely due to cardiac recoil and downward diaphragmatic displacement after dipyridamole. In heavier people, these artifacts are more likely due to slow plastic upward displacement of the diaphragm and visceral fat on assuming the supine position plus later the same above changes after dipyridamole.
z-Axis misaligment along the long axis of the scanner is important as our illustration shows. However, as illustrated in Figures 5–7, the long axis and the left border of the heart are slanted leftward and downward so that horizontal shifting of the images in the in-plane acquisition tomographic views also corrects for vertical misalignment of attenuation and emission images as our data demonstrate. z-Axis shifting along the long axis of the scanner in 3D PET acquisition without in-plane septa is easier than in 2D PET acquisition with in-plane septa; however, the scatter from other organs in 3D PET is a major problem that substantially degrades cardiac images in our experience.
Solutions for Attenuation–Emission Misregistration
These complex changes in the attenuation structures of the thorax preclude predicting attenuation–emission misregistration artifacts in any individual. However, an attenuation–emission imaging sequence can be chosen to reduce misregistration artifacts that can also be recognized, routinely assessed on clinical images, and corrected. In our experience, the sequence of a single initial resting attenuation scan followed by resting and dipyridamole emission scans has the highest probability of attenuation–emission misregistration artifacts. For a one-attenuation scan protocol, the sequence of rest and dipyridamole emission scans followed by a late measured attenuation scan starting approximately 5–10 min after the dipyridamole emission scan has fewer misregistration artifacts since the late attenuation scan better approximates the average attenuation structures over the period of emission imaging.
Other solutions include separate measured attenuation scans for rest and for dipyridamole as we now currently do for more reliable results despite slightly prolonging the study. However, we also check every image with any defect for correct attenuation–emission coregistration using the acquisition tomographic shift software and shift the emission images to achieve optimal coregistration and reconstruct the emission images with shifted data if needed.
In our experience a short SAC attenuation scan immediately after dipyridamole frequently causes attenuation–emission misregistration for several complex interacting reasons. The attenuation structures during this brief SAC acquisition do not approximate the average of the changing attenuation structures during emission scanning or we do not adequately understand the SAC method yet. Another approach to attenuation correction in PET may combine CT and PET scanning that also reduces the study time (23–25). However, the same potential problems may be exaggerated by the very brief CT attenuation acquisition that does not approximate the average of the dynamically changing attenuation structures present during the more prolonged emission data collection. Further studies of the combined PET/CT approach are needed.
Limitations of Study
An expected criticism of this study is lack of coronary arteriography to prove that the image abnormalities were artifactual and are not due to CAD. Our study has demonstrated artifactual defects due to attenuation–emission misregistration on resting images that improve or disappear on dipyridamole images in which the attenuation–emission registration is corrected. The disappearance of resting image abnormalities on stress images after dipyridamole is not consistent with flow-limiting coronary artery stenosis as justification for coronary arteriography. For assessing the less severe perfusion abnormalities seen in early preclinical coronary atherosclerosis, coronary arteriography cannot be justified. Furthermore, based on >1,000 patients with coronary arteriograms, we have previously published the diagnostic value of mild-to-moderate regional PET perfusion defects and of the base-to-apex longitudinal perfusion gradient associated with diffuse nonobstructive coronary atherosclerosis before significant localized stenosis develops (1–3). By demonstrating specific attenuation–emission misregistration in the same region as the abnormality on the PET images and normalization of the images when the misregistration is corrected, we believe that our results do not require coronary arteriographic confirmation. Moreover, we have shown the longitudinal base-to-apex perfusion gradient to be a significant marker of diffuse CAD before significant flow-limiting coronary artery stenoses occur (3). This observation combined with the well-documented gross inaccuracies of visual arteriographic interpretation could be viewed as PET providing a more reliable reference standard for severity of coronary disease than the coronary arteriogram as used now clinically, provided attenuation–emission images are correctly coregistered.
A second criticism of the study is the absence of complete information on diaphragmatic displacement on assuming the supine position or after dipyridamole in the 3 different imaging protocols reported here. Traditionally, the cardiac PET imaging protocols involved only a single initial resting measured attenuation scan followed by rest and dipyridamole emission scans. For patients studied using this traditional single resting attenuation image before May 2000, we recognized a potential problem but had no knowledge of the causes or solutions. By May 2000, at the beginning of the 1,177 patients in this study, we had discovered the attenuation–emission misregistration problem and its empiric correction by shifting the emission images to obtain coregistration but without understanding the mechanisms. With further experience we have developed multiattenuation emission image sequences to study the mechanisms and solutions as reported here.
As a consequence of this study, we now routinely use a protocol with the following image acquisition sequence: a resting measured attenuation, resting emission, dipyridamole emission, and a postdipyridamole measured attenuation. Our study demonstrates a concept where the details of thresholding, viewing, and coregistering emission and attenuation images may vary depending on the scanner, the radionuclide used, the reconstruction technique, resolution settings, and the goal of cardiac PET in each case.
CONCLUSION
Misregistration of attenuation and emission images is common in PET rest-dipyridamole perfusion imaging and is associated with artifactual defects. Misregistration is directly predicted by the BMI and downward displacement of the diaphragm after dipyridamole and is inversely related to heart size. Artifacts are quantitatively related to the extent of attenuation–emission misregistration.
These artifactual defects due to attenuation–emission misregistration typically (a) are anterolateral or lateral but do not correspond to the typical course of any of the coronary distribution territories in comparison with a precise myocardial perfusion map, (b) are associated with visual and quantifiable misregistration of superimposed attenuation and emission images, and (c) disappear when the misregistration is corrected by manually shifting the emission image over the attenuation image until optimally superimposed with the image normalizing on re-reconstruction using shifted emission data. Multiattenuation rest and dipyridamole imaging sequences with routine review and coregistration of superimposed attenuation and emission images substantially improve PET images for identifying mild abnormalities of relative CFR due to early nonobstructive coronary atherosclerosis as the basis for intense, life-long pharmacologic and lifestyle management.
Footnotes
Received Sep. 21, 2003; revision accepted Jan. 5, 2004.
For correspondence or reprints contact: K. Lance Gould, MD, Weatherhead PET Center for Preventing and Reversing Atherosclerosis, University of Texas Medical School, 6431 Fannin St., Room 4.256MSB, Houston, TX 77030.
E-mail: k.lance.gould{at}uth.tmc.edu
REFERENCES
In this issue


Jump to section
Related Articles
Cited By...
- Value of SiPM PET in myocardial perfusion imaging using Rubidium-82
- The Effect of Misregistration Between CT-Attenuation and PET-Emission Images in 13N-Ammonia Myocardial PET/CT
- Clinical Utility of Enhanced Relative Activity Recovery on Systolic Myocardial Perfusion SPECT: Lessons from PET
- Impact of Unexpected Factors on Quantitative Myocardial Perfusion and Coronary Flow Reserve in Young, Asymptomatic Volunteers
- Low-Dose Quantitative Myocardial Blood Flow Imaging Using 15O-Water and PET Without Attenuation Correction
- Decreased Perfusion in the Lateral Wall of the Left Ventricle in PET/CT Studies with 13N-Ammonia: Evaluation in Healthy Adults
- Directions and Magnitudes of Misregistration of CT Attenuation-Corrected Myocardial Perfusion Studies: Incidence, Impact on Image Quality, and Guidance for Reregistration
- Does Coronary Flow Trump Coronary Anatomy?
- Comparison of Myocardial Perfusion 82Rb PET Performed with CT- and Transmission CT-Based Attenuation Correction
- Reducing Radiation Dose in Rest-Stress Cardiac PET/CT by Single Poststress Cine CT for Attenuation Correction: Quantitative Validation
- Attenuation Correction for Stress and Rest PET 82Rb Myocardial Perfusion Images
- Reply: Attenuation Correction for Stress and Rest PET 82Rb Myocardial Perfusion Images
- Frequent Diagnostic Errors in Cardiac PET/CT Due to Misregistration of CT Attenuation and Emission PET Images: A Definitive Analysis of Causes, Consequences, and Corrections
- Cine CT for Attenuation Correction in Cardiac PET/CT
- Clinical Myocardial Perfusion PET/CT
- Respiration-Averaged CT for Attenuation Correction in Canine Cardiac PET/CT
- Artifacts from Misaligned CT in Cardiac Perfusion PET/CT Studies: Frequency, Effects, and Potential Solutions
- PET/CT: Challenge for Nuclear Cardiology
- Clinical Evaluation of a New Concept: Resting Myocardial Perfusion Heterogeneity Quantified by Markovian Analysis of PET Identifies Coronary Microvascular Dysfunction and Early Atherosclerosis in 1,034 Subjects