


Abstract
Identification of small nuclei in the brain by PET has been limited by the spatial resolution of conventional scanners. The new detector technology and advanced signal analysis of a high-resolution research tomograph (HRRT) has improved 3-dimensional spatial resolution to 2.2 mm at sufficient efficiency and permitted the quantification of tracer concentrations in small volumes. Methods: In 9 healthy volunteers, cerebral glucose metabolism was investigated after intravenous injection of 370 MBq of 18F-FDG, and regional cerebral metabolic rates for glucose (rCMRGlc) were determined in various structures of the brain identified on coregistered MR images using stereotactic and topographic anatomic information. Results: rCMRGlc values (in μmol/100 g/min) were higher in the cerebral cortex (33.5 ± 2.98), the basal ganglia (32.6 ± 3.04 in the nucleus caudatus and 40.2 ± 3.50 in the putamen), the thalamus (36.6 ± 4.72), and the cerebellum (29.8 ± 2.20) and were lower in the cerebral white matter (12.3 ± 1.45) than those reported previously with conventional scanners. This resulted in an increased ratio of cortical values to white-matter values. Various nuclei in the basal frontal lobe (21.4 ± 3.19 in the basal forebrain and 32.3 ± 2.39 in the nucleus accumbens), the temporal lobe (22.2 ± 1.74 in the corpus amygdalae), the hippocampus (25.7 ± 2.11), the diencephalon (23.1 ± 3.33 in the corpus geniculatum laterale, 20.2 ± 2.87 in the corpus geniculatum mediale, and 25.2 ± 3.29 in the nucleus subthalamicus), and the brain stem (24.4 ± 2.47 in the colliculus superior, 31.4 ± 3.63 in the colliculus inferior, 31.0 ± 3.10 in the nucleus ruber, and 22.8 ± 2.35 in the substantia nigra) could be identified, and the metabolic rate was assessed in these structures. The effect of improved spatial resolution on quantified metabolic rates could directly be demonstrated in a few cases investigated on scanners of different generations. Conclusion: The improved spatial resolution of the HRRT decreased partial-volume effects in the quantification of metabolic rates in the brain and increased the accuracy of rCMRGlc values in large structures. For the first time, this scanner has permitted the determination of metabolic rates in small nuclei that are involved in various neurodegenerative disorders.
Small nuclei in the basal telencephalon and the brain stem play an important role for higher brain functions—for example, cholinergic innervation of the cerebral cortex from the nucleus basalis of Meynert for memory (1)—and are involved in the development of neurologic syndromes, such as the subthalamic nucleus in Parkinson’s disease, yielding a target for therapeutic intervention (2). The ability of imaging modalities to identify these nuclei is limited, as some consist only of a loose accumulation of a rather small number of nerve cells, and their delineation for interventional strategies usually relies on stereotactic coordinates that might be supported by neurophysiologic recordings. Functional imaging of these nuclei by SPECT, PET, or functional MRI is restricted by the spatial resolution of conventional scanners. The new detector technology and advanced signal analysis of a high-resolution research tomograph (HRRT) (ECAT HRRT; CTI/Siemens) (3) has improved 3-dimensional (3D) spatial resolution to 2.2 mm (full width at half maximum) at sufficient efficiency and permitted the quantification of tracer concentrations in small volumes of tissue. This study investigated the ability of this scanner to identify small structures in the brain and to reliably assess metabolic rates of glucose in small basal nuclei of healthy volunteers.
MATERIALS AND METHODS
In 9 healthy volunteers (8 male and 1 female; mean age, 35 y; range, 25–65 y), cerebral metabolism was investigated after intravenous injection of 370 MBq of 18F-FDG. The volunteers, who were familiar with the examination procedure and showed only minimal tension, apprehension, or excitement, were comfortably placed in the scanner in a room with low ambient light and low equipment noise, with eyes closed and ears unplugged. Before the examination began, short catheters were inserted into a cubital vein for injection and into a vein of the contralateral hand, which was subsequently kept in a thermostat-controlled water bath at 44°C for blood sampling as described by Phelps et al. (4). Subjects were instructed to relax and not to move or speak during the study. All stayed awake, and their plasma glucose levels, averaging 5.4 ± 0.48 mmol/L, remained stable throughout the examination. 18F-FDG of a specific activity of 200 GBq/μmol at the time of injection was synthesized according to the method of Hamacher et al. (5) using a remote-controlled system. Each subject received a rapid intravenous bolus injection of 370 MBq in 2 mL of sterile, pyrogen-free normal saline solution, and recording was started immediately.
PET measurements were done with the newly developed HRRT (3), a dedicated brain scanner with no interplane septa and with depth-of-interaction information. The HRRT consists of 8 panel detector heads arranged in an octagon with a head-to-head distance of 46.9 cm for opposing heads. The gantry has a 35-cm-diameter opening for the patient’s head, with an axially 25.2-cm-long and transaxially 31.2-cm-wide electronic field of view. With a quadrant-sharing phoswich detector block design, a detector head consists of 117 (9 × 13) double-layer lutetium-oxyorthosilicate (LSO)/LSO, LSO/gadolinium-oxyorthosilicate, or LSO/lutetium-yttrium-oxyorthosilicate blocks, which are viewed by 140 (19 × 14) photomultiplier tubes. The two 7.5-mm-thick crystal layers are cut into an 8 × 8 matrix, giving 128 single detector elements, each 2.1 × 2.1 mm wide. Depth-of-interaction information for resolution recovery is obtained by a greater than 7-ns difference in light decay, which, with pulse shape discrimination, allows events in the front layer to be distinguished from those in the back layer.
Data were acquired as 64-bit data words containing the complete information of a coincidence event and stored in list mode on a fast disk, giving approximately 30 GB of raw data during a 1-h acquisition. Afterward, true coincidences (prompt randoms) between 20 and 60 min after injection were rebinned into sinograms in high-resolution mode (span = 3 and ring difference = 67), resulting in a 3D dataset of 6367 sinograms, each consisting of 288 angular projections and 256 radial elements. This dataset was normalized, corrected for attenuation and scatter (6), and then iteratively reconstructed by parallel computing of the ordered-subsets expectation maximization 3D algorithm (7) on a reconstruction cluster (8) into an image volume consisting of 207 transaxial image planes with a voxel size of 1.21875 mm. Reconstructed resolution was almost isotropic, with 2.2 mm in full width at half maximum in the center and 2.5 mm at 10 cm off-axis. For attenuation correction, a transmission scan using a single-photon transmission point source had been acquired before tracer injection. The quantified activity images were transformed into glucose metabolic maps using the measured input function and the Sokoloff operational equation in the modification of Hutchins et al. (9) and a lumped constant (LC) of 0.52 (10).
For each volunteer, a T1-weighted MR image was recorded on a 1.5-T tomograph (Gyroscan Intera; Philips), using 200 coronal slices, a 256 × 256 matrix, and a 1 × 1 × 1 mm voxel size. The MRI datasets were coregistered to the PET datasets by an automatic iterative procedure that maximizes mutual information (11). Spheric volumes of interest for the hippocampus, white matter, basal ganglia, brain stem, and cerebellar nuclei were placed on the MR image manually for each individual by reference to standard atlases (12–14) using our software package 3D-Tool (15). VOIs had a radius of 1 mm (capsula interna) to 4 mm (nucleus ruber) according to the size of the structure; larger structures were sampled using up to 3 VOIs. Cortical regions were defined by a fully automatic procedure using the FSL software package (Oxford Centre for Functional Magnetic Resonance Imaging of the Brain) (16). The process starts with removal of nonbrain structures and extraction of gray matter from the MR image of each individual. A normal template MR image, on which the cortical gyri are defined manually according to anatomic criteria (17), is then warped onto the MR image of each individual. The cortical VOIs are defined by the overlapping of gray matter on the MR image and the warped template regions. Finally, rCMRGlc is calculated for all VOIs on the coregistered PET scans.
For 2 subjects, 18F-FDG PET scans, like the HRRT scans, were recorded on a high-resolution (HR) scanner (ECAT EXACT HR; CTI/Siemens) coregistered to the MR image and analyzed by the same VOIs. Reconstructed transaxial and axial resolutions were 4 and 5 mm, respectively, at the center and 5 and 6 mm, respectively, at 10 cm off-axis. Reconstruction was done by Fourier rebinning followed by filtered backprojection. Scatter was corrected in the same manner as for the HRRT, using the algorithm by Watson et al. (6). The reconstructed images represent the accumulated data from 20 to 60 min after injection, as for the HRRT.
Descriptive statistics are reported as means with SDs. Hemispheric differences were evaluated by t testing.
RESULTS
Figure 1 shows selected small nuclei as typical regions of interest on selected transverse PET slices of a healthy volunteer in comparison with coregistered T2-weighted MR images. Similar cross-sectional and frontal images were obtained from all subjects, and in all of them the topographic units could be outlined and defined as regions of interest corresponding to the anatomic structures. Regional cerebral metabolic rates for glucose (rCMRGlc) calculated according to Hutchins et al. (9) and pertinent statistics are presented in Table 1. Differences between hemispheres were generally small, with greater variance in the small nuclei than in the large cortical regions. With correction for multiple comparisons, significant asymmetry was seen only in the parietal and occipital lobes, whereas the left hemisphere showed a slightly higher rCMRGlc. The highest metabolic rates were in the putamen, whereas nearby pallidum was among the gray-matter structures with the lowest rCMRGlc (54% of putamen). The rCMRGlc of the neocortex was clearly higher than that of the allocortex (hippocampus) and cerebellum. Nucleus ruber and the colliculus inferior were the metabolically most active structures in the brain stem. The latter might have been activated by ambient noise from the scanner.
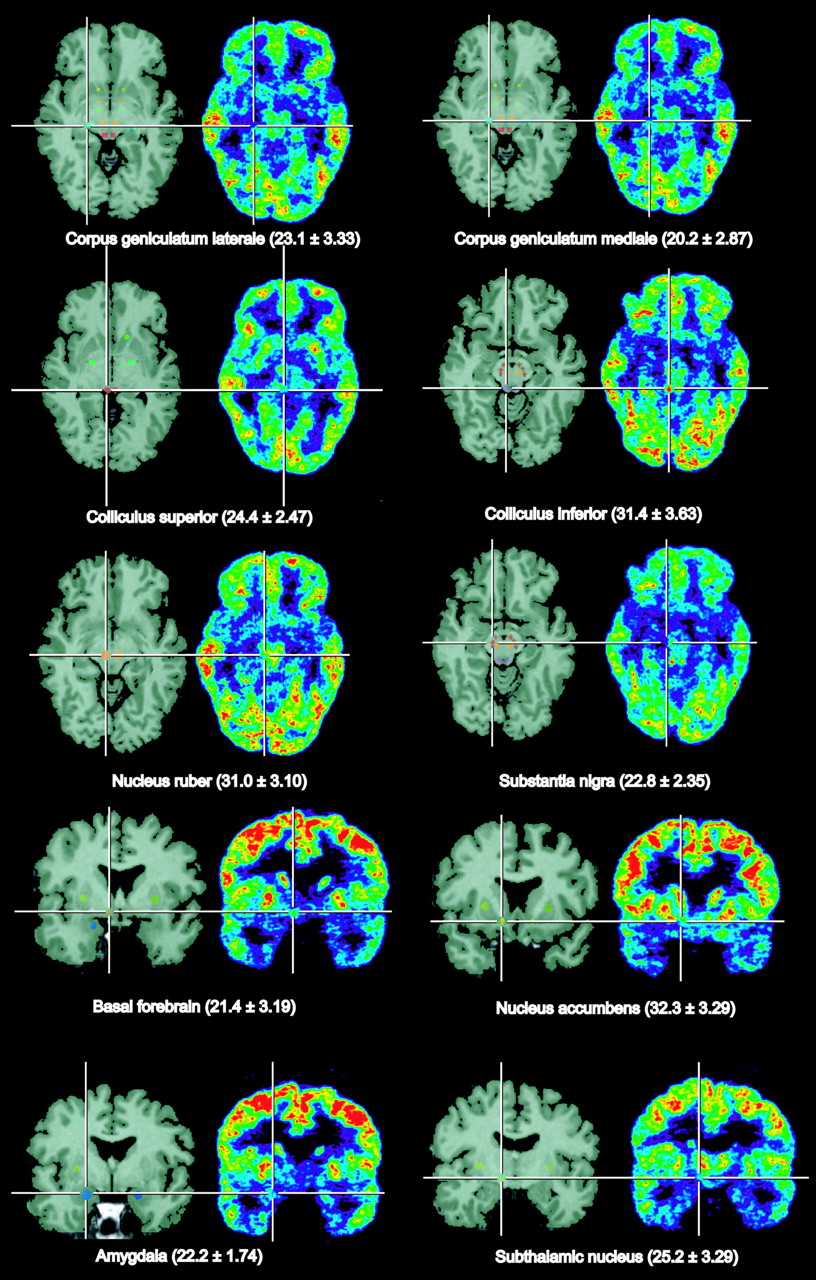
Identification of small brain nuclei on coregistered MRI and PET slices of a volunteer. Mean values and SDs of rCMRGlc in these structures from 9 volunteers are given in brackets.
rCMRGlc Values
In 2 subjects, a direct comparison of rCMRGlc obtained with scanners of different generations—HR and HRRT—was performed. As shown in Table 2, metabolic values in most metabolically active cortical and brain-stem regions were substantially higher on the HRRT than on the HR, whereas differences were much smaller in the relatively large basal nuclei (putamen, caudate) and metabolically inactive structures (e.g., pallidum, amygdala, and internal capsule).
Differences in rCMRGlc between HRRT and HR Scanners
DISCUSSION
The study of normal glucose metabolic activity in various regions of the brain has provided the basis for analyzing the involvement of distributed networks in various tasks, evaluating disorders affecting the central nervous system, and assessing the evolution of pathophysiologic processes and their attenuation by therapeutic interventions. Because of methodologic limitations of spatial resolution, the previous determinations yielded quantitative values of rCMRGlc for the individual cortical areas, the basal ganglia, the centrum semiovale for white matter, the cerebellum, and the brain stem in toto (18–26). The values reported in these studies, however, varied considerably because of differences in equipment and in the procedures for performing 18F-FDG studies. Varying the implementations to estimate glucose consumption from measured tissue activity—for example, an autoradiographic versus a kinetic approach—has shown that the accuracy of the input function and the more or less arbitrarily selected LC significantly affects the reported rCMRGlc values (27). The LC is a linear scaling factor in the operational equation. Thus, when it is registered, conversion and direct comparison of rCMRGlc values obtained with different LCs is possible. Unfortunately, LC is not always given in publications. Studies interested in quantitative metabolic rates have therefore included “normal values” from healthy volunteers as the basis for the description of changes during functional development (28) and with aging (29) and for the detection of disturbances related to functional impairment caused by generalized or focal neurodegenerative disorders and more localized brain diseases, such as focal epilepsies, ischemic stroke, and tumors (30,31). For disorders selectively affecting small brain structures or individual components of a functional network, a more accurate determination of metabolic rates is required and, as demonstrated for the metabolic/functional anatomy of the cerebellum (32), is the prerequisite for detailed analysis of degenerative disorders involving the cerebellum (25). The increasing insight into the role of small nuclei in the basal forebrain, the hypothalamus, and the brain stem for complex neurologic, cognitive, and mental performance requires noninvasive assessment of their function. However, the small size of these structures and the low number of nerve cells defining a functional nucleus prevented the reliable identification of these regions with conventional nuclear medicine equipment.
The newly developed HRRT (3), using LSO detectors and depth-of-interaction information with advanced front-end electronics and powerful parallel computing facilities, achieves uniform spatial resolution close to 2 mm across a 20-cm-diameter volume. Applying this scanner and using coregistration to high-resolution MR images, the small structures representing the small nuclei of interest could be identified and the metabolic rates could be determined for, what is to our knowledge, the first time. As might be expected, the metabolic rates in these structures varied depending on the size and shape of the regions of interest and on the neuronal density, which determined the tracer concentration in the region of interest relative to the concentration in neighboring structures. Whereas some of these nuclei (e.g., colliculus inferior) could easily be identified because of their high metabolic activity, the delineation of other structures with relatively low metabolism (e.g., nucleus accumbens and basal forebrain for nucleus basalis of Meynert) on PET images was rather vague and their detection was achieved by coregistered MR images. The validity of these measurements is supported by the improved accuracy of the rCMRGlc values in larger regions of interest, such as cortical areas, basal ganglia, and white matter: The decreased partial-volume effect increased the values in gray-matter structures and reduced those in the white matter. Our results are consistent with rough estimates of partial-volume effects as obtained from values by Mazziotta et al. (33), in which overestimation of white-matter rCMRGlc might reach 30% for the HR and 20% for the HRRT in small regions such as the capsula interna; underestimation of gray-matter activity is 20% and 10%, respectively, for small structures, such as corpus geniculatum laterale or mediale. This effect is demonstrated when the values measured in this study are compared with those previously reported (after accounting for different LCs); in Table 1, rCMRGlc values obtained in our laboratory are given as a reference (21), and data reported by other groups support this finding. The effect of improved spatial resolution on the metabolic values can directly be seen in the few cases that were investigated on scanners of different generations, the HR and the HRRT. These comparisons proved the better separation of values in gray- and white-matter structures with the new equipment. However, one must keep in mind that the healthy volunteers included in our study were not homogeneous but varied considerably between individuals (range of global metabolic rate: 30.8–40.4 μmol/100 g/min).
CONCLUSION
The improved spatial resolution achieved with the HRRT decreased partial-volume effects in the quantification of metabolic rates in the brain and increased the accuracy of rCMRGlc values in large structures. To our knowledge, this scanner is the first to permit the determination of metabolic rates in small nuclei that are involved in various neurodegenerative diseases and cognitive and psychiatric disorders. Therefore, this new-generation PET scanner may be of value in the study of various neurologic and psychiatric diseases.
Footnotes
Received Apr. 7, 2004; revision accepted May 20, 2004.
For correspondence or reprints contact: Wolf-Dieter Heiss, MD, Max Planck Institute for Neurological Research, Gleueler Strasse 50, 50931 Köln, Germany.
E-mail: wdh{at}pet.mpin-koeln.mpg.de
REFERENCES
In this issue


Jump to section
Related Articles
Cited By...
- Microglial activation, white matter tract damage, and disability in MS
- Metabolic Activity of Red Nucleus and Its Correlation with Cerebral Cortex and Cerebellum: A Study Using a High-Resolution Semiconductor PET System
- In Vivo Detection of Diffuse Inflammation in Secondary Progressive Multiple Sclerosis Using PET Imaging and the Radioligand 11C-PK11195
- Multimodal Quantitative Magnetic Resonance Imaging of Thalamic Development and Aging across the Human Lifespan: Implications to Neurodegeneration in Multiple Sclerosis
- HRRT Versus HR+ Human Brain PET Studies: An Interscanner Test-Retest Study
- Cortical Flattening Applied to High-Resolution 18F-FDG PET
- Assessment of 11C-PE2I Binding to the Neuronal Dopamine Transporter in Humans with the High-Spatial-Resolution PET Scanner HRRT
- Metabolic Imaging of Anterior Capsular Stimulation in Refractory Obsessive-Compulsive Disorder: A Key Role for the Subgenual Anterior Cingulate and Ventral Striatum